


Written by Lance Roberts, Clarity Financial
This week has been extremely interesting. On one hand, price volatility surged while measures of market volatility actually declined.

Please share this article – Go to very top of page, right hand side, for social media buttons.
Take a look at the chart below:
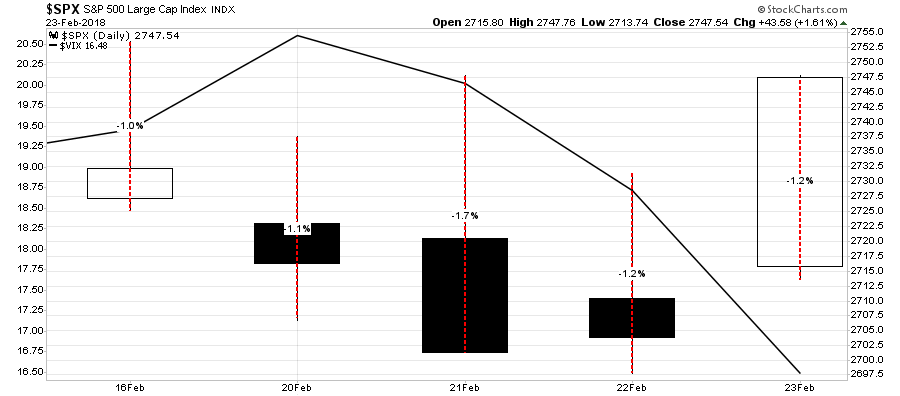
While the market did rise 0.55% last week, prices swung wildly in excess of 1% daily.
For me, that is volatile.
However, despite the wild swings in the market, the market “fear gauge,” as measured by the VIX plunged from its recent highs back towards its lows.
Investors have been quick to dismiss the recent “rout” as another “buy the dip” opportunity and have jumped back onto the “short-volatility” trade that blew up spectacularly just two weeks ago.
Memories are indeed short in a “bull market.”
On Tuesday I updated our market analysis as follows:
“This morning, the market opened back below the 50-dma. While this is concerning, and keeps our short-hedge in place for now, it is where we finish this trading week that will determine out next positioning changes.”
We use WEEKLY data to strip out the daily price volatility, like that shown above, which can lead to emotionally driven investing mistakes. Weekly data slows things down so that we can more accurately assess the message the market is trying to deliver. Therefore, we have to wait until the end of the trading week to make important allocation decisions and changes.
I have questioned over the last couple of weeks exactly how much volatility the Fed would allow before stepping into the fray to keep the markets stable.
We now know it is roughly a 10% decline.
Unsurprisingly, after two days of failed rally attempts, it was time to unleash both Bill “Say Anything” Dudley and Fred “The Pumper” Rosengren Friday morning to tell the markets what they have longed to hear.
Specifically were the comments about QE being “useful to have in the toolkit for those times when the short-term interest rate tool may not be available,” adding that the Fed is “quite likely” to require large-scale asset purchases again because real rates will remain low due to slow productivity and labor-force growth. They also added that “if LSAPs are indeed not effective, then the Fed may need to take other measures.” (Zerohedge has the complete article.)
In other words, despite the rhetoric to the contrary, the Fed isn’t going away…….ever!
Of course, as stated, that was all the market needed to hurl higher into the close on Friday closing solidly above the 50-dma.

As stated on Tuesday:
“In order for us to fully remove hedges, the market must close above the 50-dma on Friday.”
It did, and we closed out the last of our short-market hedges and are now back to being fully long-biased in portfolios.
With the market still in the seasonally strong time of the year, there is a high probability the market will make an attempt at the recent highs and potentially even go to new highs. As we noted two weeks ago, despite the “sell-off,” the markets did not “do” anything wrong. No critical trend lines, or supports, were violated and the bullish trend remains intact.
However,it also doesn’t mean we are completely “out of the woods” just yet either. There is a risk the market could reverse next week keeping prices confined within the bullish trend channel. A failure at the trend line, which would coincide with a break below the 50-dma, would likely lead to a retracement back to the 200-dma which is currently running along the bottom of the bullish-trend channel.
Here is what we are looking for:
Bullish
- If the market can break above current resistance, equity exposure can be added to portfolios for a push back towards previous highs.
- That push back to previous highs will also be a breakout of the already accelerated bullish trend. While bullish in the short-term, such a rally will likely be limited in its rise as overbought conditions are already returning very quickly.
- The target for a rally from current levels puts the market in the 3200 range.
Bearish
- On the bearish side, a failure at current resistance levels would likely lead to a retracement to the 200-dma. Such a correction would also trigger the MACD sell-signal which is already at historically high levels. That “sell signal” will put additional downward pressure on the market.
- As long as the market holds at the rising bullish trend and 200-dma, the bullish backdrop remains intact keeping portfolios weighted towards equity exposure.
- However, if the market breaks below those “critical support” levels, as noted above, the risk of a deeper correction rises. Such a break will lead to increased hedging and a reduction of equity risk in our portfolio models.
- A break of that critical support will likely lead to a retest of the longer-term bullish trend around 2250 which would be a 22% decline from recent highs and an “official bear market.”
- A break below 2250 will likely coincide with the onset of the next recession and is an entirely different portfolio management strategy.
While the “Great Bear Market Of 2018” may indeed be behind us, for now, it did NOT resolve the longer-term overbought, overvalued and overly bullish conditions for investors.
The recent rally has quickly relieved the pervasive “panic” of the media which existed just two weeks ago, and the “perma-bulls” have emerged back out of their bunkers. However, the risks of a larger correction are still present. We still highly recommend investors rethink levels of risk exposure in portfolios and take some actions.
I am reprinting the guidelines from last week.
Step 1) Clean Up Your Portfolio
- Tighten up stop-loss levels to current support levels for each position.
- Take profits in positions that have been big winners
- Sell laggards and losers
- Raise cash and rebalance portfolios to target weightings.
Step 2) Compare Your Portfolio Allocation To Your Model Allocation.
- Determine areas requiring new or increased exposure.
- Determine how many shares need to be purchased to fill allocation requirements.
- Determine cash requirements to make purchases.
- Re-examine portfolio to rebalance and raise sufficient cash for requirements.
- Determine entry price levels for each new position.
- Determine “stop loss” levels for each position.
- Determine “sell/profit taking” levels for each position.
(Note: the primary rule of investing that should NEVER be broken is: “Never invest money without knowing where you are going to sell if you are wrong, and if you are right.”)
Step 3) Have positions ready to execute accordingly given the proper market set up.


