Written by Lance Roberts, Clarity Financial
Data Analysis Of The Market and Sectors For Traders
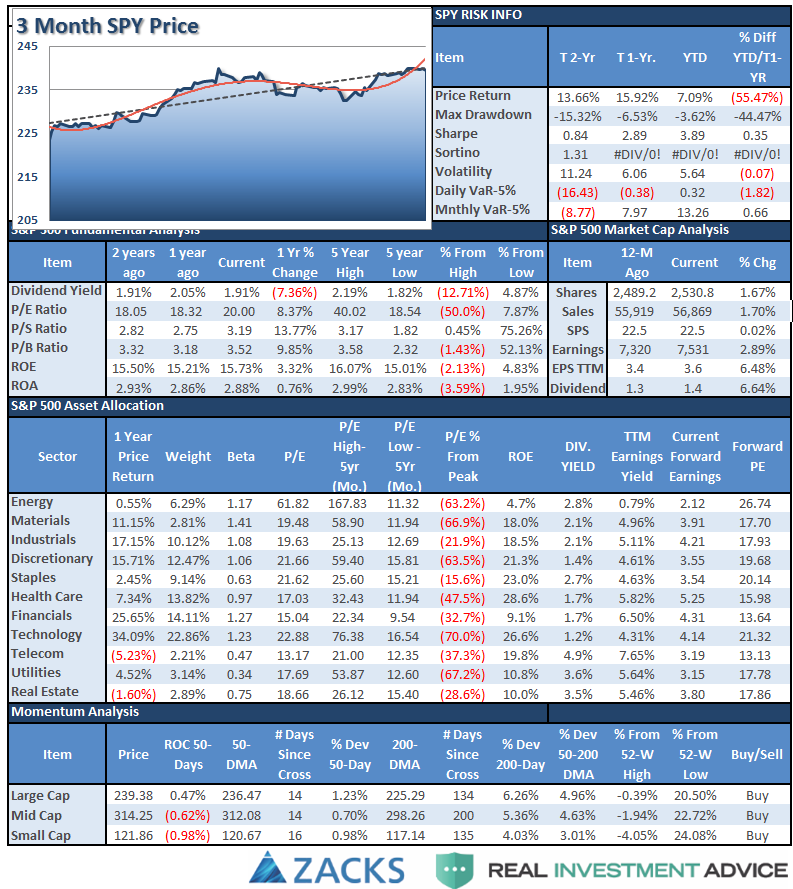
S&P 500 Tear Sheet
The “Tear Sheet” below is a “reference sheet” provide some historical context to markets, sectors, etc. and looking for deviations from historical extremes.

Please share this article – Go to very top of page, right hand side for social media buttons.
If you have any suggestions or additions you would like to see, send me an email.
NEW! Performance Analysis

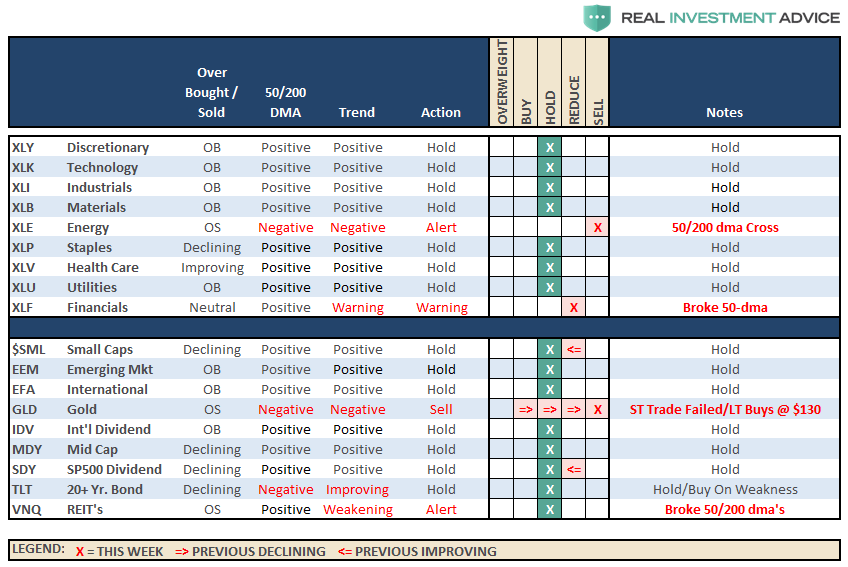
Sector Analysis
From last week:
“With that being said, the overall backdrop remains BULLISH for now. I do remain somewhat cautious on allocations currently given the ‘weekly sell signal’ alert remains intact currently and at a high level.
However, let me reiterate, I remain long-biased in portfolios currently, but am also maintaining fairly tight stop-loss levels as well as hedges currently. Although we did lighten up on those hedges a few weeks ago.”
As noted in the chart below, the bullish trend line from the 2016 lows remains intact for now. However, a break of that trendline will likely signal a bigger correction in the works. Stops have been moved up to previous lows set during the March correction. Any correction that violates critical support at 2015 highs (an -11.3% decline from recent highs) will signal the onset of a more severe bear market correction back to the 2016 lows at 1825ish (-24.3%) The previous correction in 2015-2016 was just -14.7%.
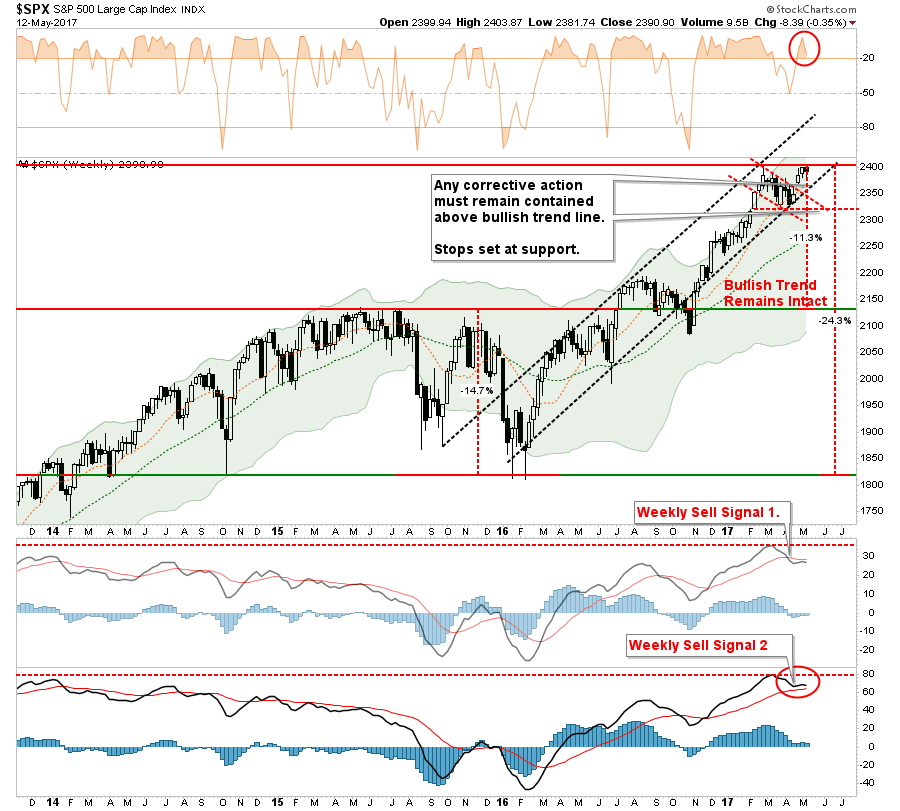
Of course, as I have stated many times previously, given the extreme length of time the market has remained in a low-volatility state will magnify the “psychological pain” of a correction. In other words, for overly complacent investors, a correction of 10%, or more, will “feel” much worse than it actually is.
Okay, let’s get to the sector analysis.
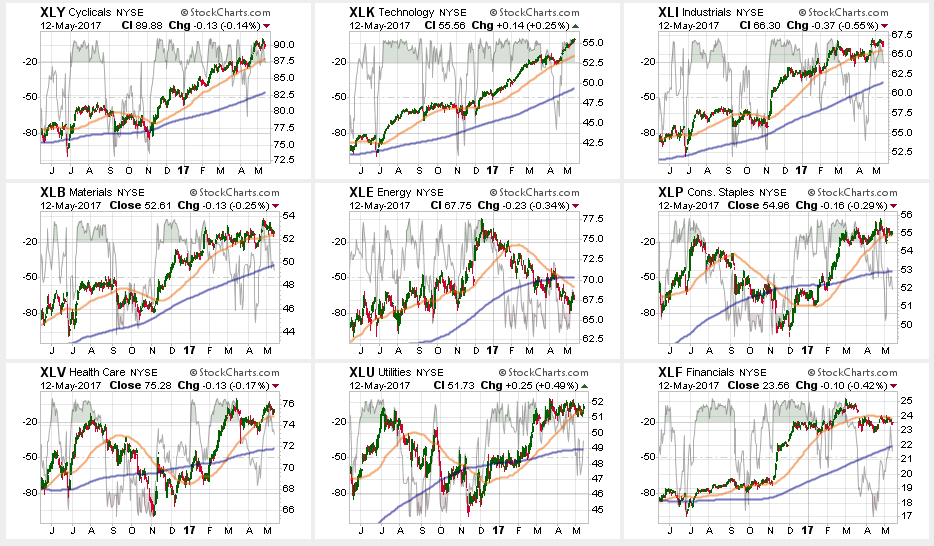
Outside of Technology, everything weakened. With the number of stocks leading the markets higher becoming much more narrow ($FB, $AAPL, $AMZN, $NFLX, $GOOG = #FAANG) the risk of a bigger correction has risen markedly.
Discretionary, Industrials, Materials, Staples, Healthcare and Utilities all weakened last week with the latter of group flirting with respective 50-dma’s. It will be important for these sectors to maintain their support levels as the underlying erosion of the market could well spread.
Energy continues to struggle after breaking its 50-dma and 200-dma. While energy had a bit of a bounce late last week on a move up in oil prices, the trend remains sorely negative. Energy has also triggered a major sector sell signal with the cross of the 50-dma below the 200-dma. Remain heavily underweight energy for the time being.
Note: Oil also failed at the $48/bbl resistance level last week. If oil prices retrace and break the previous lows there will likely be more damage to the energy sector. Risk is high currently.
Financials recently broke its 50-dma and has had two failed rally attempts keeping investors underweight the sector for now. With the sector pushing back towards overbought, a reversal here will likely coincide with further market weakness. Stops should be set at $23.
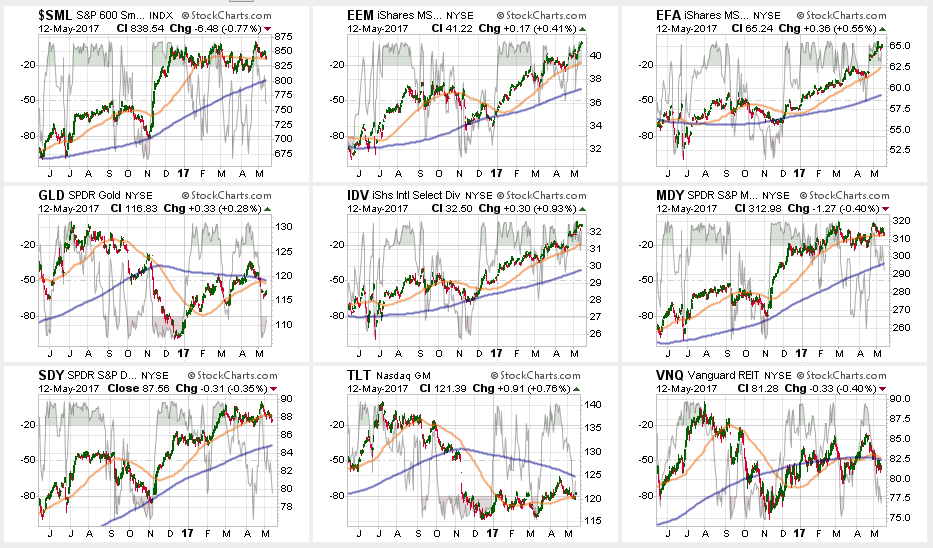
Small and Mid-Cap stocks lost steam last week with both flirting with the 50-dma’s after getting very overbought last week. As I noted last week:
“The question of sustainability of that strength will be answered this coming week. Continue to hold current positions (after recommending to take some profits recently) for now. A break of the multiple-bottom lows is now the ‘full stop.'”
The failure to maintain previous strength from puts support levels into close focus. Stops should be maintained at March lows.
Emerging Markets and International Stocks continued their strength following the French elections. There is a good bit of risk built into international stocks currently, but after having already taken profits a few weeks ago, we continue to hold these sectors for now with stop levels moved up to the recent lows.
Gold remains out of favor. The short-term trading opportunity failed and long-term traders never got above $1300/oz to enter. With Gold breaking the uptrend from the 2016 lows, there is no reason to own gold in portfolios currently. Furthermore, with the 50-dma still below the 200-dma, a “sell” signal remains. Gold needs to regain its footing above the 200-dma to become interesting.
S&P Dividend Stocks, Bonds and REIT’s – a few weeks ago I recommended taking profits from these hedges as they had become extremely overbought. I stated then:
“If the broader markets can rally over the next week or two, simply due to a reflexive oversold condition, look for these sectors to pull back to provide a better entry point.”
This has been the case. Now we wait to see what happens next but these sectors are becoming more attractive.
The table below shows thoughts on specific actions related to the current market environment.
(These are not recommendations or solicitations to take any action. This is for informational purposes only related to market extremes and contrarian positioning within portfolios. Use at your own risk and peril.)
Portfolio Update:
The bullish trend remains positive, which keeps us allocated on the long side of the market for now, but the weekly “sell signal” alert is not being dismissed.
However, the inability of the markets to convincingly breakout to new highs, despite the efforts of the #FANG stocks mentioned above, keeps us waiting for either a pullback to support, or a breakout to new highs, for an opportunity to put some of the recently harvested cash back to work on the long side.
For now, we wait to see what happens next, particularly as we move into the seasonally weaker months of the year. We are maintaining stops at recent support levels.


