
Written by Lance Roberts, Clarity Financial
Market Needs Traction
Michael Sincere had a very interesting post this past week in which he looked at the deterioration of the market.

He noted:
“Here’s something else to consider: For the past two years, the market has been in a sideways pattern, i.e., it’s eked out a small gain. Investors are getting anxious to generate any return on their money, just one of the many reasons they are dumping managed funds, and the reason they are desperately seeking yield. In my opinion, this is the time to be patient while waiting for the right opportunity. Anyone trying to force the market to give them money is going to be sorely disappointed in the near future.
Because Halloween and the election are drawing near, I don’t want to scare you. Nevertheless, the warning signs are everywhere. Once again, the strongest case for the bulls is the “invisible hand,” the entity that frequently spikes the indexes higher whenever the market starts to sell off. As I’ve said before, fear will overwhelm the invisible hand one day, but until then we can expect to get this drip-drip-drip type of selloff on low volatility.
Bottom line: The odds favor the bears in the near future. Keep your eye out for 2,130 on the S&P 500. If we drop below that level and the 200-day moving averages on the S&P 500, it could get nasty. Raise cash as we move closer to a correction. The biggest surprise is that we haven’t had one yet.”
I couldn’t agree more, and the market needs to get some traction quickly as crucial support is currently being tested. As shown in the chart below, bullishness remains high despite the recent sideways action of the market, this provides fuel for a correction should something panic investors.
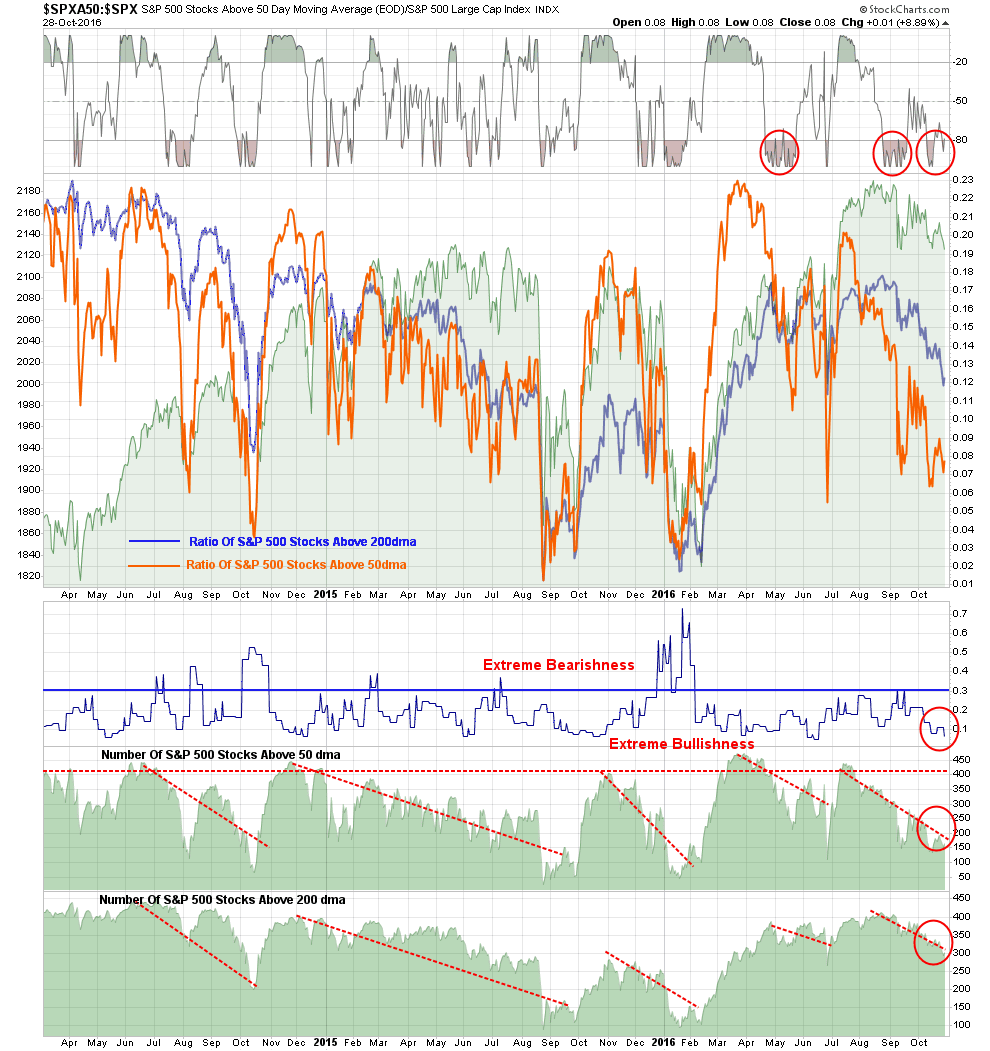
Furthermore, the deterioration in the breadth of the market is also concerning as shown above and below. With relative strength, momentum and breadth all on the decline, Michael is correct in stating the short-term outlook favors the bears momentarily, so caution is advised.
With multiple sell signals in place, as shown throughout the entirety of this week’s newsletter, the call for next week remains higher cash levels and reduce levels of equity risk for now. When market dynamics change to a more constructive backdrop there will be plenty of time to increase allocations to equities with a more favorable risk/reward potential.
That is not the case right now.
Model Update
S.A.R.M. Sector Analysis & Weighting
Taking a look at individual sectors of the market the deterioration of momentum and breadth becomes much more evident. The first chart below are the major sectors of the S&P 500 index.
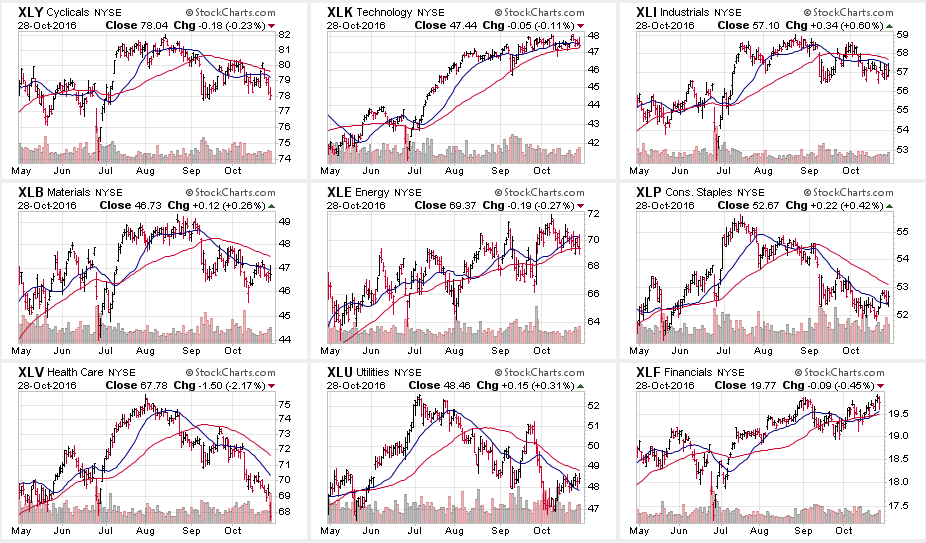
As you will notice 6-out-of-9 sectors have registered short term sell signals with the short-term moving average crossing below the long-term moving average. Furthermore, the majority of the leadership for the current market has come from the technology sector where the momentum of the advance has slowed sharply. However, Financials have picked up some leadership as of late in anticipation of higher interest rates from the Fed and well as the issues of both Wells Fargo (WFC) and Deutsche Bank (DB) issues being dismissed. Staples and Utilities have also started showing some improvement last week as the “chase for yield” continues.
Moving on to other major sectors we find some similar patterns emerging.
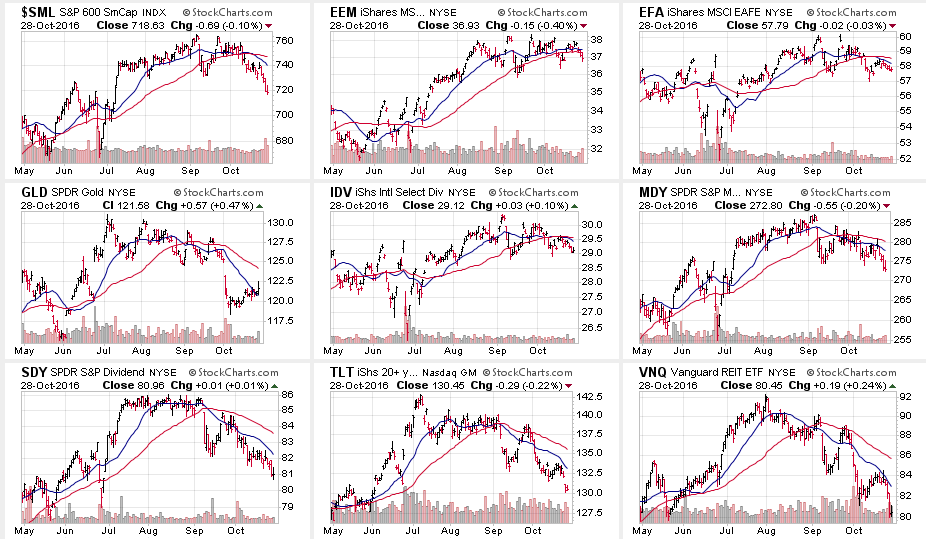
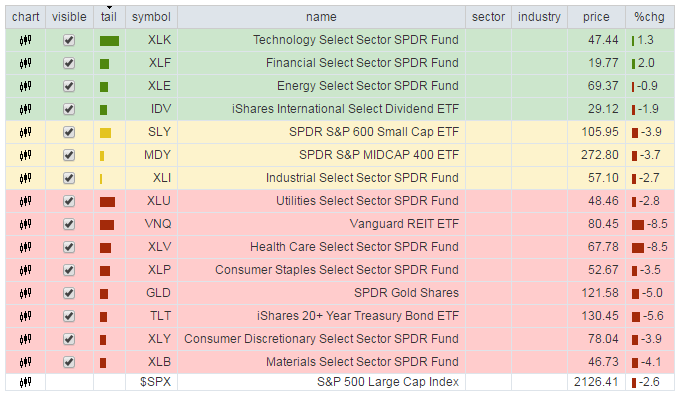
Once again we find the majority of major indices (8-out-of-9) registering sell signals and seeing deterioration among the previous leadership.
Small Cap, Gold, Mid-Cap, Dividend Stocks, Bonds, and REITs were all hit the hardest as of late. However, as I previously warned, the strengthening of the Dollar is now weighing on the performance of international and emerging market sectors. Caution is advised as the run in Emerging Markets is extremely long in the tooth and is directly impacted by weakness from industrialized economies.
As I stated last week:
“With the dollar strengthening, interest rates remaining elevated and labor costs on the rise, the risk to corporate profitability is elevated. If earnings season comes in weaker than expected, the recent ability of the market to hold support at bullish levels may fail.”
We are seeing that happen as earnings season progresses. Caution remains a prudent investment stance currently.
I will update this analysis in Tuesday’s Technically Speaking post (click here for free e-delivery)
Let’s take a look at the equal weighted portfolio model.
(Note: This is an equally weighted model example and may differ from discussions of overweighting/underweighting specific sectors or holdings.)
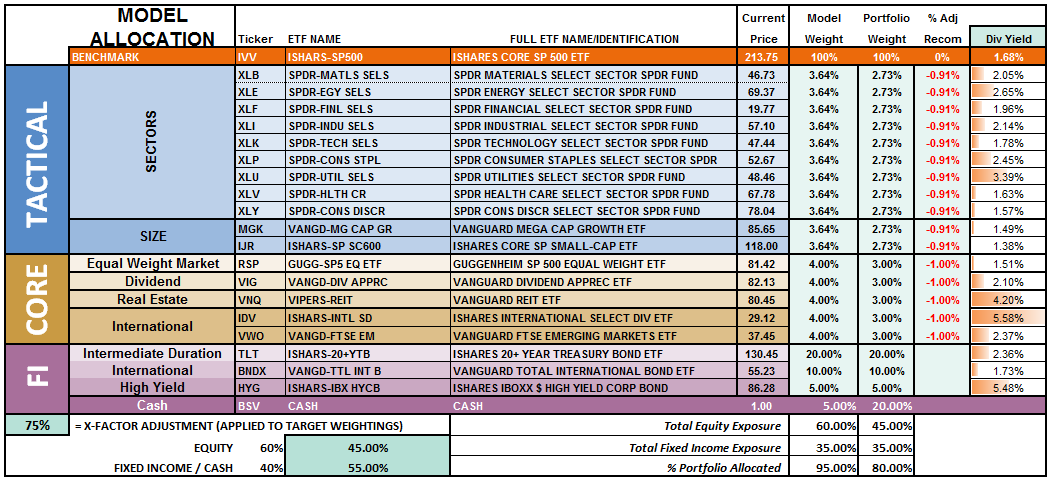
The overall model still remains underweight target allocations. This is due to the inability of the markets to generate a reasonable risk/reward setup to take on more aggressive equity exposure at this time.
Relative performance of each sector of the model as compared to the S&P 500 is shown below. The table compares each position in the model relative to the benchmark over a 1, 4, 12, 24 and 52-week basis.
Historically speaking, sectors that are leading the markets higher continue to do so in the short-term and vice-versa. The relative improvement or weakness of each sector relative to index over time can show where money is flowing into and out of. Normally, these performance changes signal a change that last several weeks.
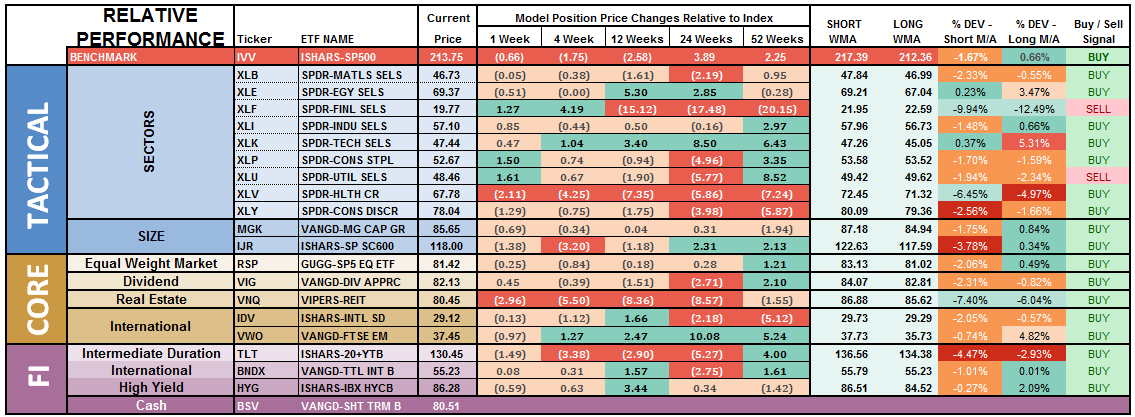
Notice in the next to the last column to the right, the majority of sectors which have previously been pushing extreme levels of deviation from their long-term moving average, have corrected much of those extremes.
Financials and Utilities have now registered, as shown in the last column, a “weekly sell signal.” Importantly, by the time a “sell signal” is registered, the related sector is typically very oversold and will bounce. This tends to be a good opportunity to reduce exposure to that related sector before a continued decline.
There is a broad deterioration across sector performance which suggests overall weakness in the markets will likely continue in the near-term. Some caution is currently advised.
The chart below is the “spaghetti” chart, via StockCharts, showing the relative strength/performance rotation of sectors relative to the S&P 500. If we are trying to “beat the index” over time, we want to overweight sectors/asset classes that are either improving in performance or outperforming the index, and underweight or exclude everything else.
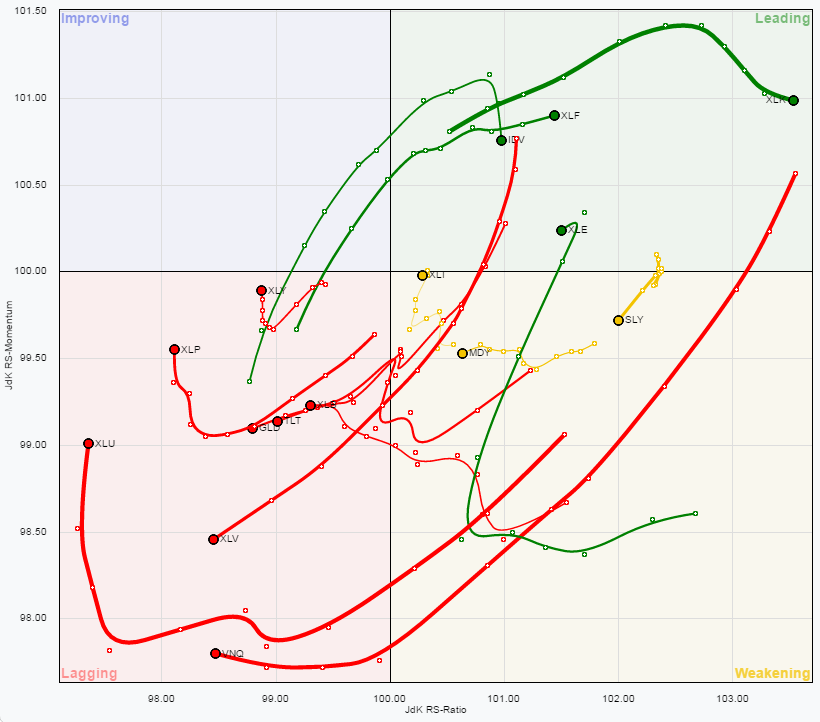
Utilities, REIT’s, Staples, Discretionary, Materials, Bonds, Gold, and Healthcare have remained under pressure this past week. While still underperforming the broad market Utilities, Industrials, Materials, Staples, and Discretionary have begun showing signs of improvement. With the rise in rates largely done, sectors with the most benefit from falling rates look reasonable.
The opposite holds true for those sectors that are adversely affected by a stronger dollar and weaker oil prices. With dollar tailwind still intact, and oil prices grossly extended, profit taking in Small-Cap, Mid-Cap, Emerging Markets, International and Energy stocks seems logical. This recommendation remains from the last couple of weeks and remains salient.
Most importantly, given that a bulk of the sectors remain either in weakening or lagging sectors, this suggests the current advance in the market remains on relatively weak footing.
Over the last couple of weeks I have recommended taking profits in the Technology sector. This was due to the extreme levels of outperformance of that sector which has begun to fade. The rotation out of technology is likely not complete yet and brings into focus extremely oversold sectors such as Health Care, Utilities and Staples as potential candidates.
The risk-adjusted equally weighted model has been increased to 75%. However, the markets need to break above the previous consolidation range to remove resistance to a further advance.
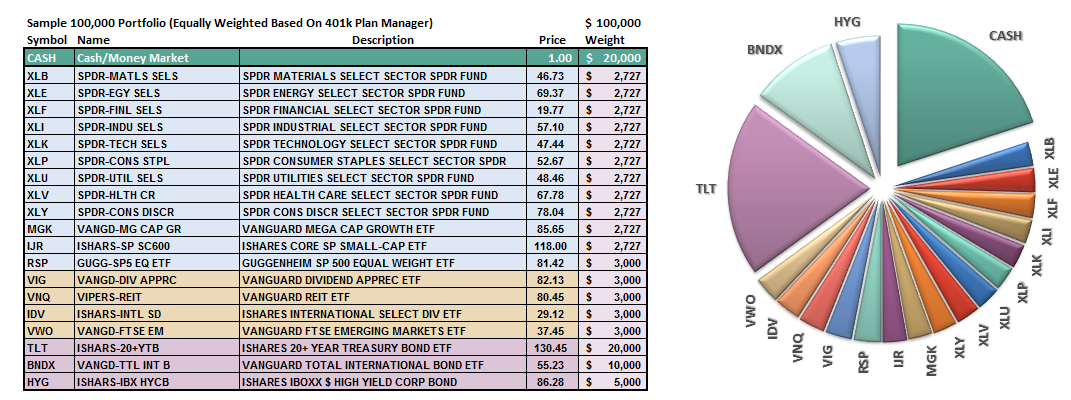
Such an increase will change model allocations to:
20% Cash
35% Bonds
45% in Equities.
As always, this is just a guide, not a recommendation. It is completely OKAY if your current allocation to cash is different based on your personal risk tolerance, time frames, and goals.
For longer-term investors, we still need to see improvement in the fundamental and economic backdrop to support the resumption of a long-term bullish trend.Currently, there is no evidence of that occurring.
THE REAL 401k PLAN MANAGER
The Real 401k Plan Manager – A Conservative Strategy For Long-Term Investors
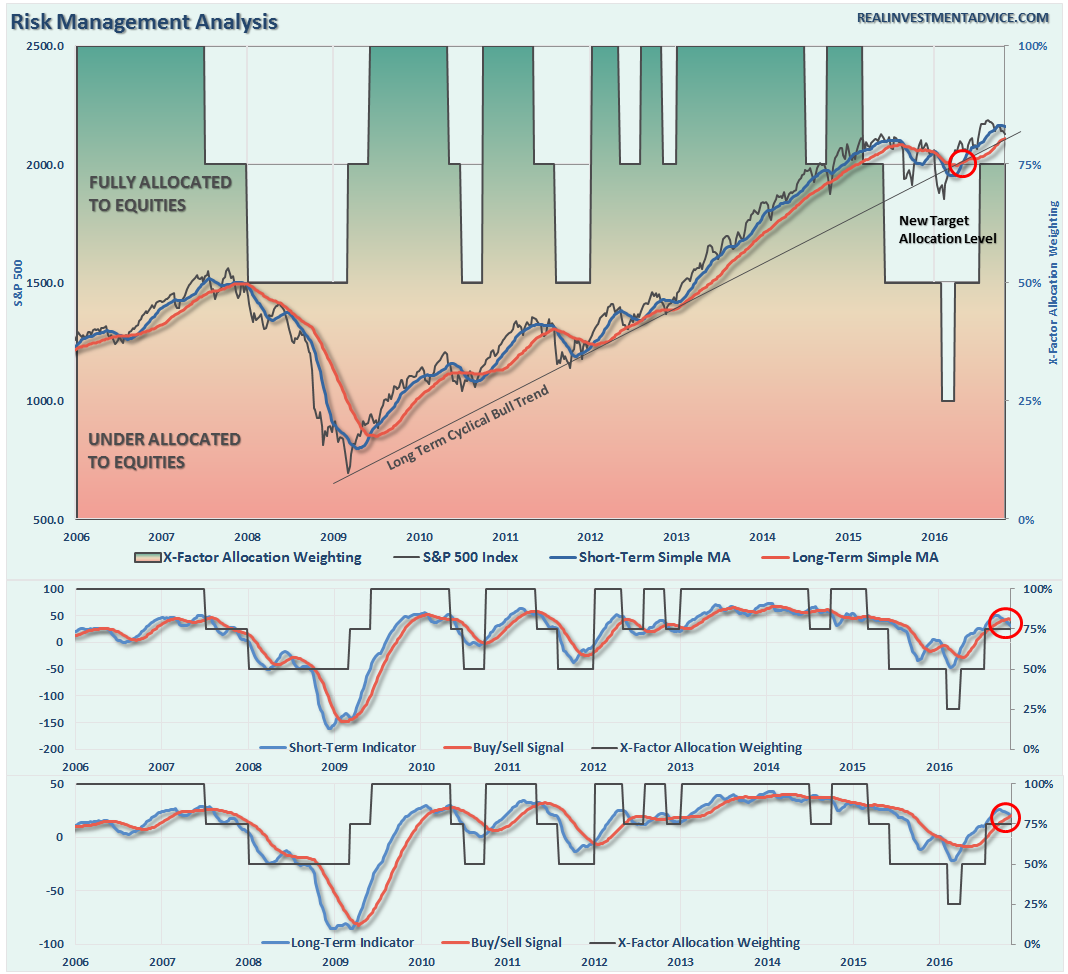
NOTE: I have redesigned the 401k plan manager to accurately reflect the changes in the allocation model over time. I have overlaid the actual model changes on top of the indicators to reflect the timing of the changes relative to the signals.
There are 4-steps to allocation changes based on 25% reduction increments. As noted in the chart above a 100% allocation level is equal to 60% stocks. I never advocate being 100% out of the market as it is far too difficult to reverse course when the market changes from a negative to a positive trend. Emotions keep us from taking the correct action.

On The Ledge
The good news is the market was able to hold 2125 last week keeping support in place, but just barely. Following the revelation of more investigations into Hillary Clinton, stocks made a “run for the border” and it wasn’t to get a bag full of tacos.
However, the markets DID hold support which keeps allocation models stable this week, but mind you we are standing on a proverbial ledge.
The bad news is a more important correction may have just started, however, it is too early to know for certain. We remain on high alert with our initial “sell signals” in place as shown in the chart above.
It is advised, as boring as it has been, to remain cautionary in 401k allocations. While it certainly has not been as fun as watching “paint dry,” it has kept volatility low and principal safe. However, we will make changes accordingly depending on what the market decides to do next.
As noted two weeks ago:
“We are dangerously close to triggering a second sell signal, the bottom part of the chart, which will likely coincide with a failed rally attempt over the next week or two. Such an outcome would suggest a weaker market environment in the intermediate term with a high degree of caution required.”
Again, with early warning signals are suggesting the correction has more room to go, so let’s be patient once again this coming week.
Thank goodness, there is only one more week to go before the election. Once we have that behind us, assuming we don’t have another Democratic contest of results as we saw in 2000 with “dangling chads,” we should have better clarity on market direction headed into the end of the year.
Sit tight for now and I will update you on Tuesday.
If you need help after reading the alert; don’t hesitate to contact me.
Current 401-k Allocation Model
The 401k plan allocation plan below follows the K.I.S.S. principal. By keeping the allocation extremely simplified it allows for better control of the allocation and a closer tracking to the benchmark objective over time. (If you want to make it more complicated you can, however, statistics show that simply adding more funds does not increase performance to any great degree.)

401k Choice Matching List
The list below shows sample 401k plan funds for each major category. In reality, the majority of funds all track their indices fairly closely. Therefore, if you don’t see your exact fund listed, look for a fund that is similar in nature.


