Written by Lance Roberts, Clarity Financial
With the majority of the technical and fundamental backdrop covered above, there is not much more to add. However, I did want to pick up this one additional note David Larew dropped last week with reference to George Lindsay’s “3-Peaks and a Domed House” formation.

I dug around a bit and found a good description of the formation by Jeff Hirsch:
“The term “Three Peaks and a Domed House Top” is just an easy way to remember and recognize this recurring market pattern. Occurring at nearly every major U. S. equity market top, the pattern illustrates consistent market behavior. The Domed House Top is akin to a head-and-shoulders top.”
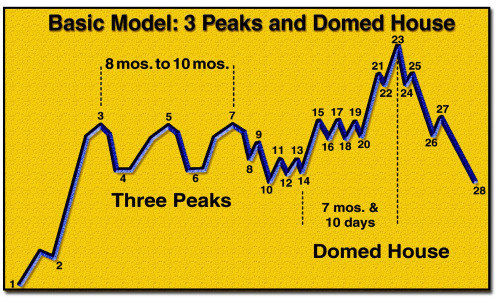
“The pattern describes how markets tend to come off a low and move up until a resistance point is reached (point 3). Then after two attempts to move higher (points 5 and 7) there is a sell-off to point 10. This is the ‘Separating Decline’ that separates the Three Peaks from the Domed House. Point 10 is always lower than either point 4 or 6, often both. If is not lower it does not qualify and the pattern is nullified. The Domed House starts with a base between points 10 and 14. A rally usually ensues and forms another higher base (points 15 to 20, Roof of the First Story). Then from there the final surge to the high creates the Dome from points 21 to 25. The drop-off returns to the vicinity of point 10.
Lindsay based these formations after studying 150 years of market charts back in 1968. When looking at the point 23 dates in Lindsay’s original they all matched up with a bull market high. Additionally, Lindsay stated that the pattern ‘may occur on either a major or minor scale. When it is of major scope, a typical formation begins at a bear market low.’
Lindsay noted that minor and major formations of Three Peaks and a Domed House often overlapped with a Peak of one being a Dome of another. Sometimes Three Peaks followed a Domed House. Some tops could not be fit into the pattern and do not qualify. But Lindsay did find that, ‘…the market has followed [the formations] at least 60% of the time…’ and that, ‘The majority of all major advances ended in a pattern which resembled the Three Peaks and a Domed House.’”
And here is David’s analysis that defines it pretty well.
Just an interesting point worth considering.
Model Update
S.A.R.M. Sector Analysis & Weighting
Last week, I discussed in this section the importance of an “inside week.” To do it once is rare; two in a row is especially so and thus perhaps deserving of attention in the context of this tentativeness over the past few months. As CNBC reported earlier this week:
“’Inside weeks happening several weeks in a row is almost unheard of,’ Miller Tabak equity strategist Matt Maley commented Monday on CNBC’s ‘Trading Nation,’ calling it a sign that investors ‘don’t know what’s going to happen next – they don’t know what to do with their money.’”
According to CNBC, the last three times two ‘inside weeks’ in a row were spotted was February 2008, June 2007, and January 2000.
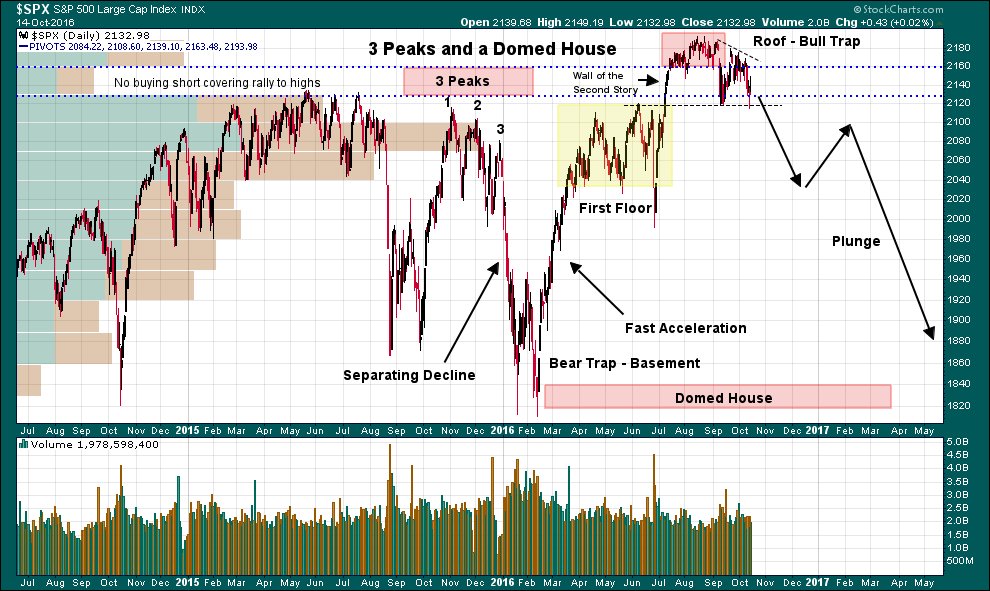
As I have noted previously, there are more than just a few similarities between the current topping process and those previously. While this time could surely turn out differently, let’s rationally think about outcomes.
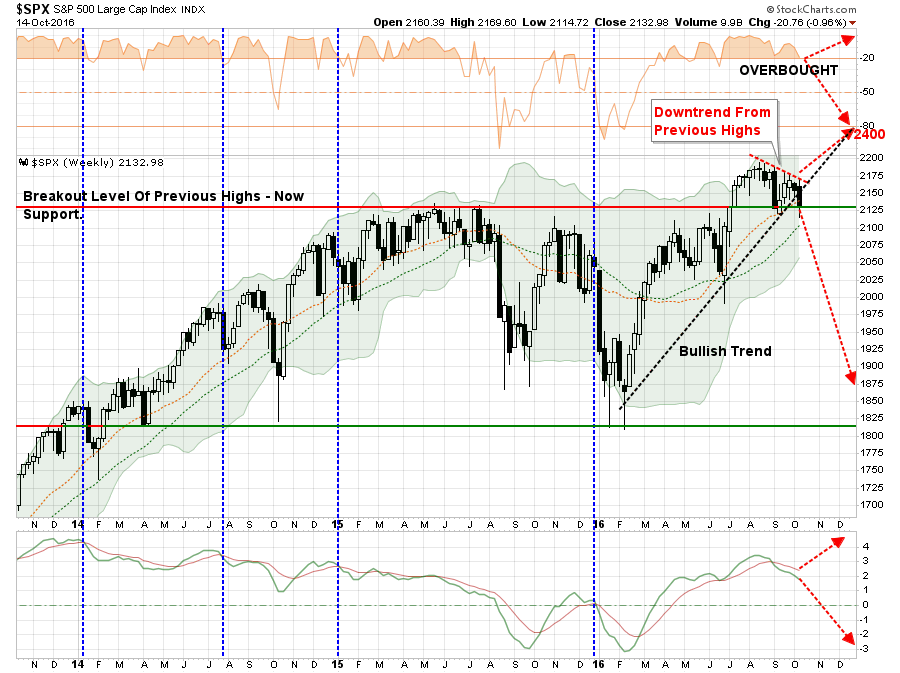
The chart below shows the potential for a bull rally from current levels, which would coincide with a recovery in earnings and economic growth, to 2400. It also shows the potential for a decline back to pattern lows if this current bull cycle does fail.
Here are the potential outcomes assuming an investor, starting with $100,000 in cash, either invests it all here (buys the dip) OR remains in cash.
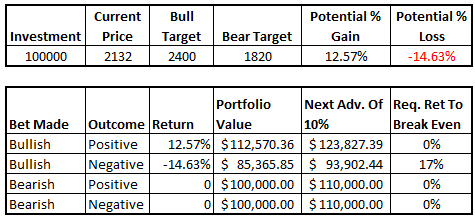
The biggest problem with being overly bullish at current levels is the risk to the loss of investment capital. Yes, by being bearish, there is a risk of missing out on gains. But missing out on gains is far different than destroying principal which then must be recouped before additional gains towards financial goals can be achieved.
While a loss of 14% during the decline wouldn’t seem to be that big of a deal, it requires roughly 17% just to get back to even. In other words, the bearish investor, assuming the markets can immediately string together two back to back years of 10% gains, would have a two-year advantage on the bullish investor that guessed wrong.
There is a massive difference between “missing out” on gains in the “short-term” and destroying principal which has “long-term” impacts.
I will update this analysis in Tuesday’s Technically Speaking post (click here for free e-delivery)
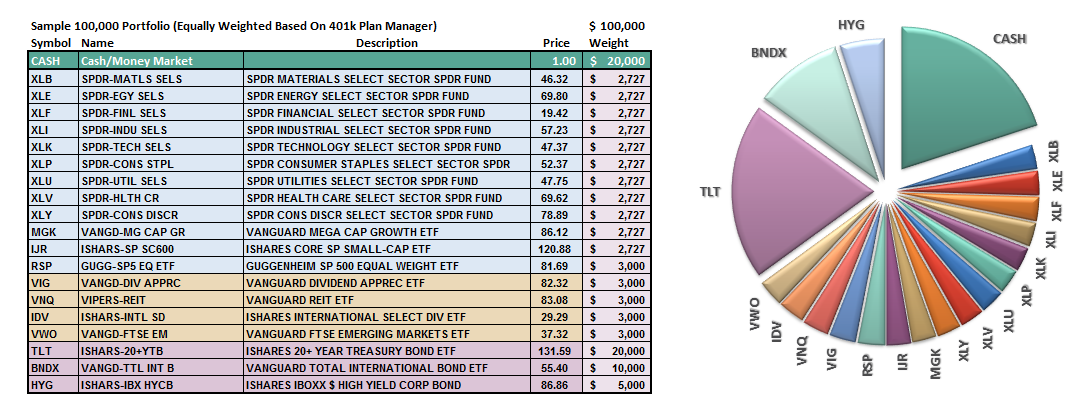
Let’s take a look at the equal weighted portfolio model.
(Note: This is an equally weighted model example and may differ from discussions of overweighting/underweighting specific sectors or holdings.)
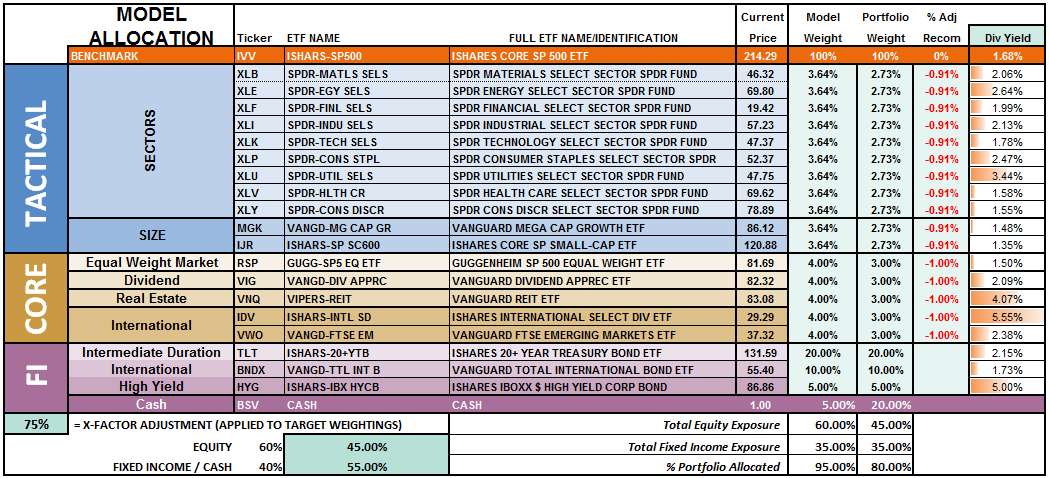
The overall model still remains underweight target allocations. This is due to the inability of the markets to generate a reasonable risk/reward setup to take on more aggressive equity exposure at this time.
Relative performance of each sector of the model as compared to the S&P 500 is shown below. The table compares each position in the model relative to the benchmark over a 1, 4, 12, 24 and 52-week basis.
Historically speaking, sectors that are leading the markets higher continue to do so in the short-term and vice-versa. The relative improvement or weakness of each sector relative to index over time can show where money is flowing into and out of. Normally, these performance changes signal a change that last several weeks.
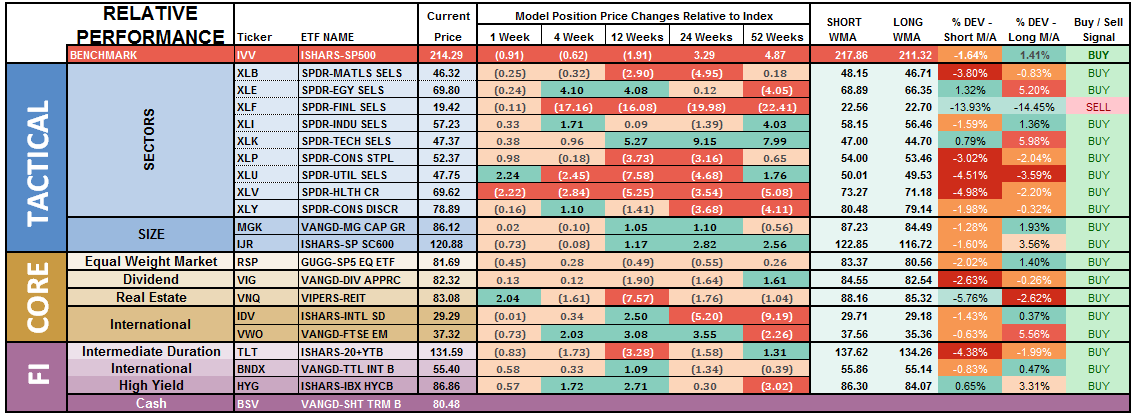
Notice in the next to the last column to the right, the majority of sectors which have previously been pushing extreme levels of deviation from their long-term moving average, have corrected much of those extremes.
Importantly, Financials have now registered, as shown in the last column, a “weekly sell signal” which suggests further weakness in the sector in the near to intermediate term.
There is a broad deterioration across sector performance which suggests overall weakness in the markets will likely continue in the near-term. Some caution is currently advised.
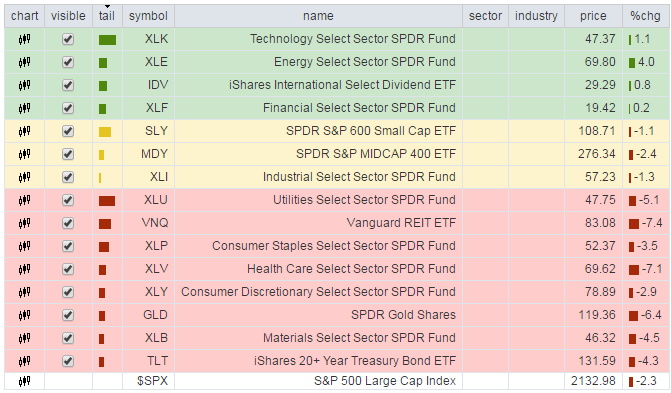
The chart below is the “spaghetti” chart, via StockCharts, showing the relative strength/performance rotation of sectors relative to the S&P 500. If we are trying to “beat the index” over time, we want to overweight sectors/asset classes that are either improving in performance or outperforming the index, and underweight or exclude everything else.
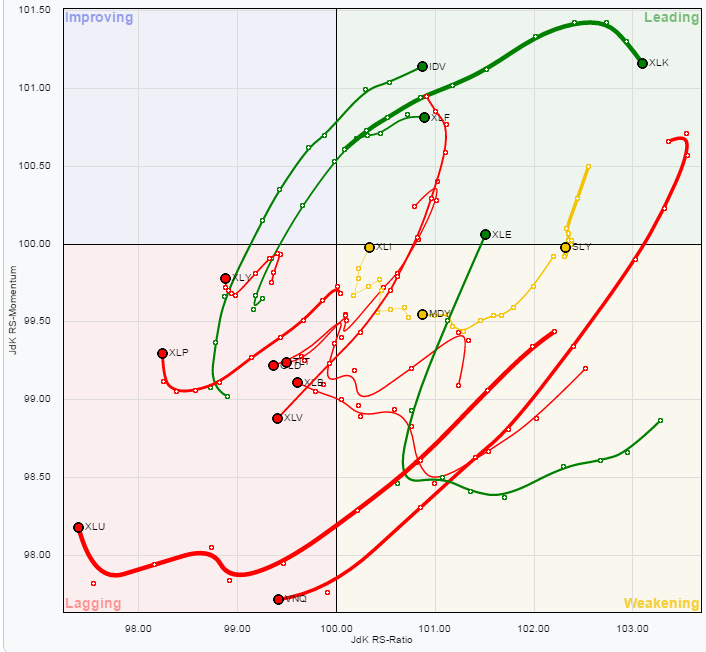
Utilities, REIT’s, Staples, Discretionary, Materials, Bonds, Gold, and Healthcare have remained under pressure this past week. This has largely been due to the rise in interest rates. However, that rise in rates looks largely done and suggests a decline in rates from here is much more likely as hopes of a Fed rate hike in December fades along with upcoming economic data.
We remained aggressive buyers of bonds over the last week in anticipation of a rotation back into safety. Such a rotation will likely coincide with weaker than expected economic data and any further correctionary action in markets following a short-term bounce likely next week.
I recommended lifting profits last week in International, Emerging Markets, Small Cap, and Financial sectors which proved prescient. The recent strength in the US dollar will likely continue to weigh on these areas.
Most importantly, given that a bulk of the sectors remain either in weakening or lagging sectors, this suggests the current advance in the market remains on relatively weak footing.
Profit taking should also be focused on Technology stocks as the current outperformance of this sector is very long in the tooth.
The risk-adjusted equally weighted model has been increased to 75%. However, the markets need to break above the previous consolidation range to remove resistance to a further advance.
Such an increase will change model allocations to:
20% Cash
35% Bonds
45% in Equities.
As always, this is just a guide, not a recommendation. It is completely OKAY if your current allocation to cash is different based on your personal risk tolerance, time frames, and goals.
For longer-term investors, we still need to see improvement in the fundamental and economic backdrop to support the resumption of a long-term bullish trend. Currently, there is no evidence of that occurring.


