by Lance Roberts, Clarity Financial
On Tuesday, I updated last weekend’s analysis stating:
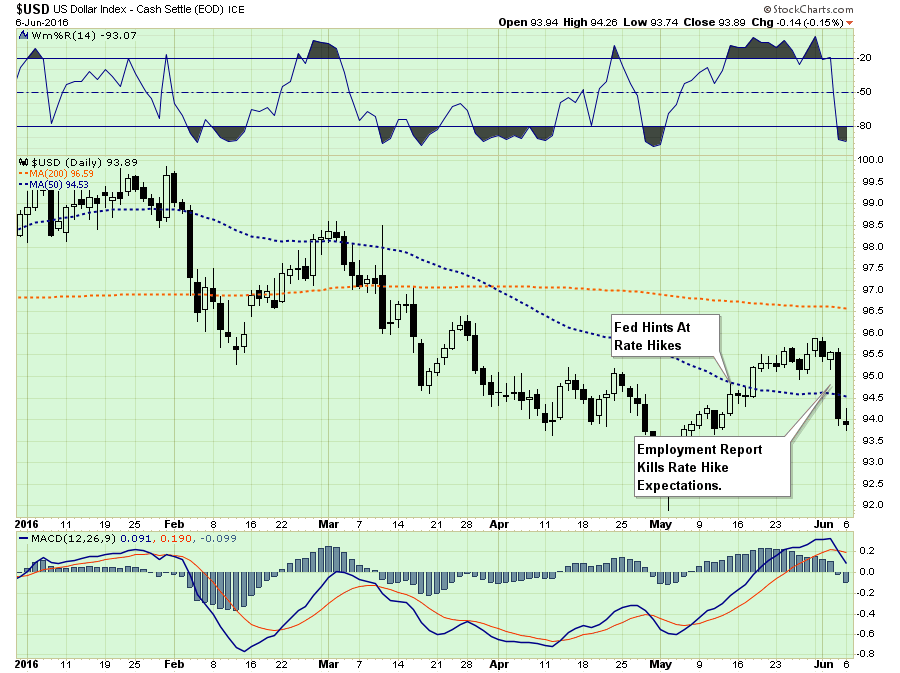
“On Monday, the market did indeed break above 2100 as suggested. That rally higher was driven by Yellen’s comments that suggested no rate hike coming in the months ahead. However, while her comments were certainly dovish, the markets had already been pricing in a “no rate” hike scenario during the last couple of weeks as the economic data continued to crumble.
This was most clearly seen in the collapse of the dollar on Friday as the extremely weak employment data killed rate expectations reversing recent currency flows in expectations of higher yields.

While the jobs report was clearly a disappointment, it is only one data point in a series of developments which suggest that economic deterioration is much more substantial than most of the bullishly biased individuals believe.
As Ed Harrison at Credit Writedowns penned last week:
“My worry is that the data are showing end of cycle weakness. And given the fact that this cycle is already seven years long, I believe it is more likely that we are near the end of cycle than we are near the beginning.
If in fact, we are near the end of the cycle, we are also in the unfortunate position of having no counter-cyclical monetary policy space and limited political fiscal space. That means no yield curve steepening. Instead, we will see flattening. And the distress in high yield will be acute. Bond yields may rally but I don’t see equities benefiting since earnings are already in decline. Instead, there will likely be a wholesale flight to safety and crisis. To the degree that the Fed decides to hike into this weakness yet again, we should expect the credit situation to be worse.
We are muddling along at stall speed. 100%. And this could continue. But the data are increasingly suggesting it won’t.”
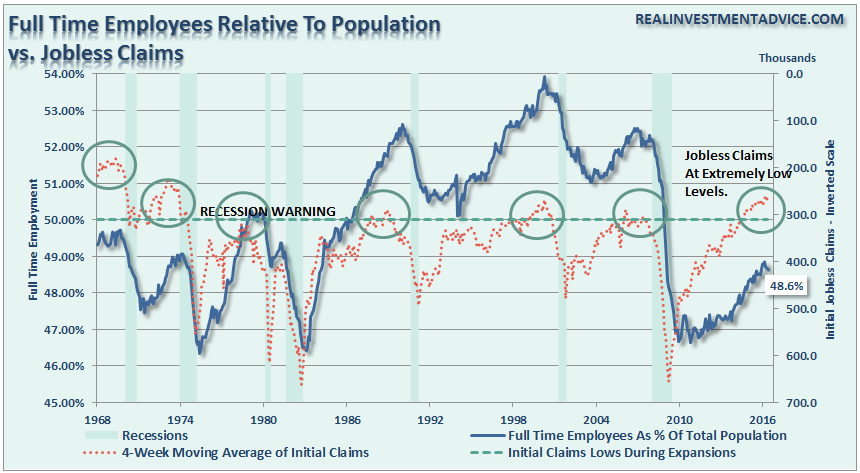
While job growth certainly deteriorated over the last several months, the reality is that job growth is ALWAYS a lagging indicator relative to the rest of the economy. Why? Because labor is expensive. It is expensive to hire, expensive to train and expensive to terminate. Therefore, companies tend to hoard required labor as long as possible which is what creates drops in unemployment claims to low levels at the end of an economic growth cycle.
However, there are many other areas of the economy that are also sending extremely clear signals that something more important may be afoot.
As Michael Lebowitz penned Saturday:
“Commercial and Industrial (C&I) loan delinquency rates, have a strong historical correlation with employment. C&I delinquency rates have risen over the last year and a half, in-line with the decline in corporate profits, to levels last seen four years ago. While the overall delinquency rate is still relatively benign, it is increasing sharply. Another important observation about the delinquency growth rate is that delinquencies tend to trend in one direction for long periods. Note: C&I loans are loans to corporations and businesses and not individuals. Data on these loans are reported on by the Federal Reserve.
The graph below, courtesy of Cyril Castelli of R-Cube, highlights the relationship between the rate of change in C&I delinquencies and employment. The delinquency rates are inverted to better highlight the correlation.”
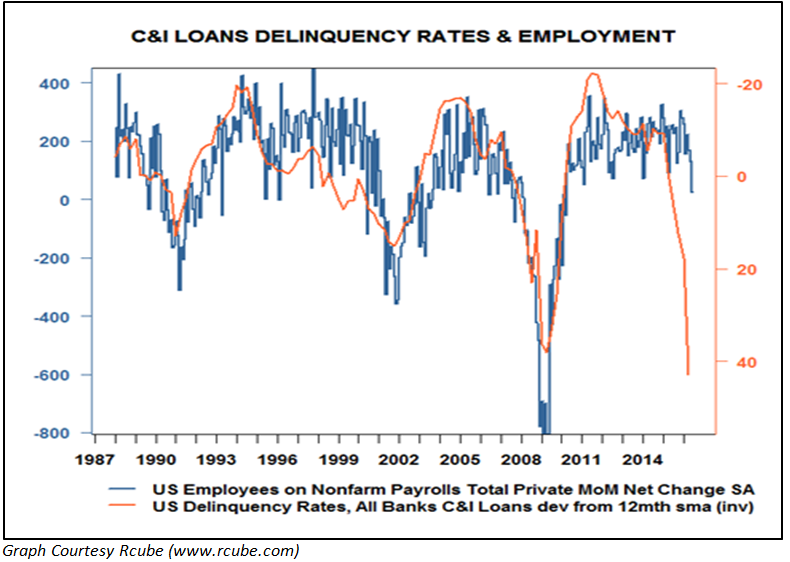
As revenues and profits decline the ability to repay loans becomes more difficult. Of course, that same lack of revenue, which leads to rising delinquency rates, certainly does not foster a hiring spree for companies.
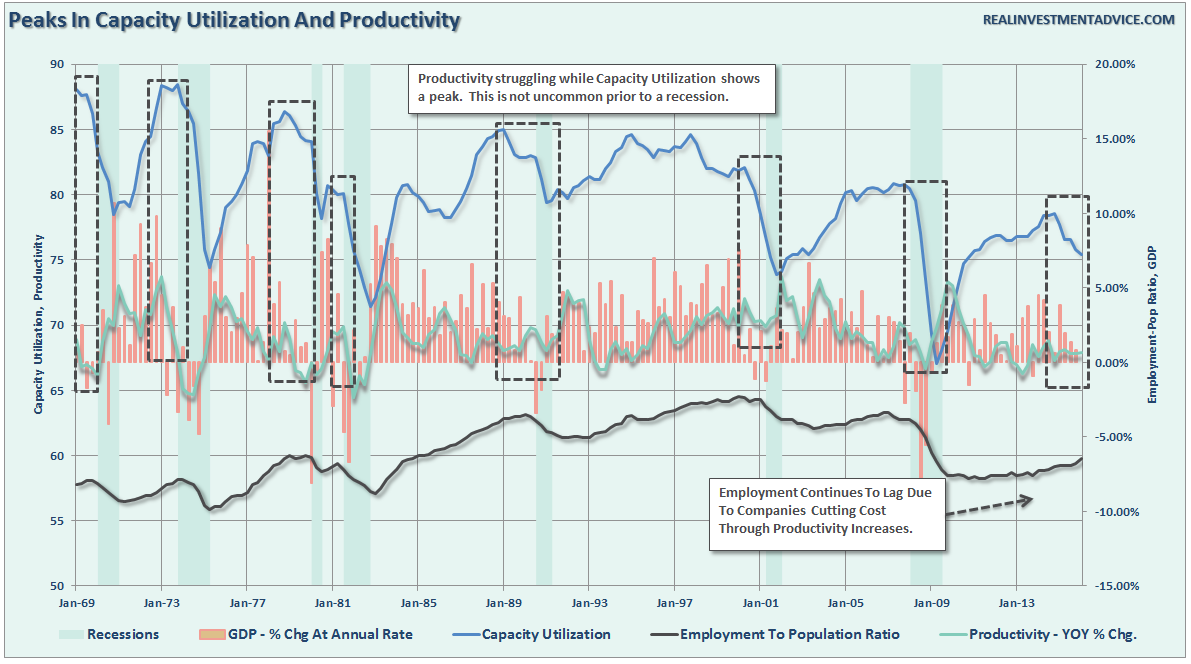
Furthermore, a look at capacity utilization and productivity also suggest that something is indeed amiss economically speaking.
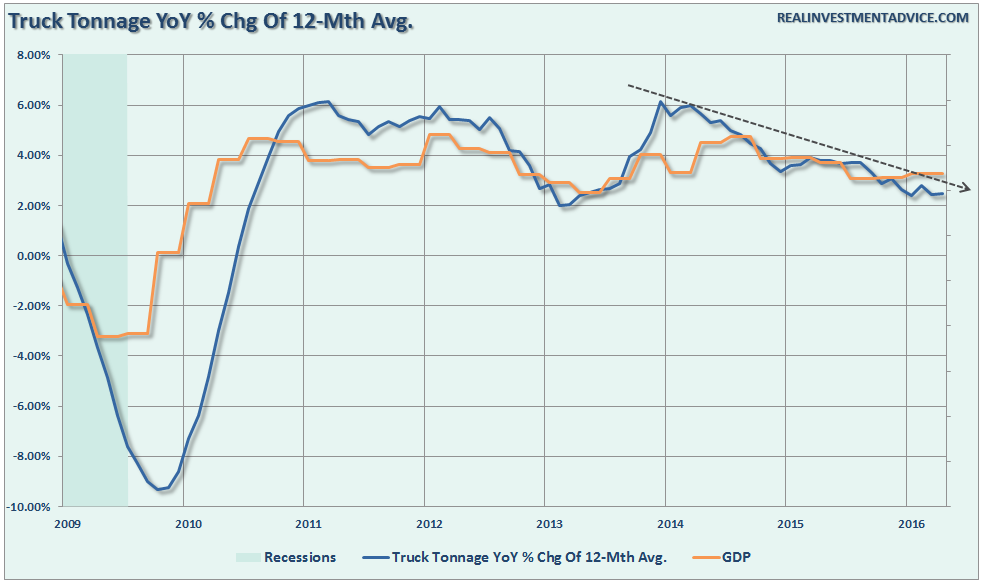
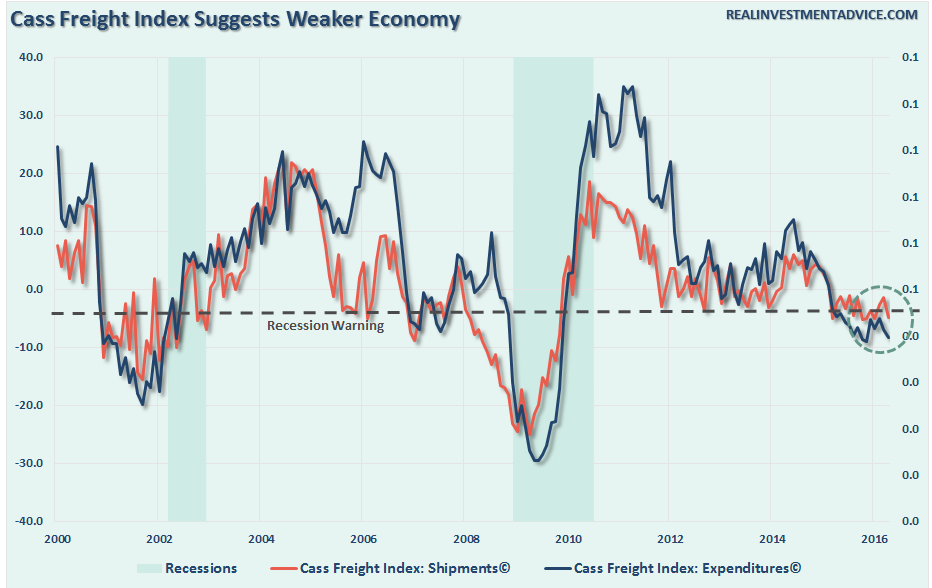
Of course, eventually, when consumer demand (70%ish of economic growth) slows enough, so does freight and trucking demand.
Of course, the problem with economic data is the markets, as they have been as of late, can ignore the data for quite some time. As John Maynard Keynes once quipped:
“The market can remain irrational longer than you can remain solvent.”
However, what is crucially important not to forget is that eventually price does revert to reflect reality and not the other way around.
Profit Recovery Hopes May Be Disappointed
The reason I addressed the data above is to give you a bit of perspective regarding my argument about the expected “profits” recovery in the second half of the year.
Just last week Richard Bernstein stated the following:
“Earnings-driven bull markets seem to be the norm during the year following a profits recession trough.
Our earnings forecast for the four-quarter period ending June 2017 is roughly $115. The current S&P 500 PE multiple based on trailing reported GAAP earnings is about 24. If history were to repeat, then the multiple could compress by 2 multiple points during that period, which would give one an expected S&P 500 level of about 2500 (115 x 22 = 2530), or about 20% expected return.”
That’s a bold estimation.
But here is the problem. First, it assumes that Bernstein’s earnings forecast are correct.
“If one thinks the Fed will wait to raise rates (as we do) and if one thinks that the profits cycle will trough by year-end 2015 (as we do), then it follows that 2016 might be a good year for US stocks.”
Not so much.
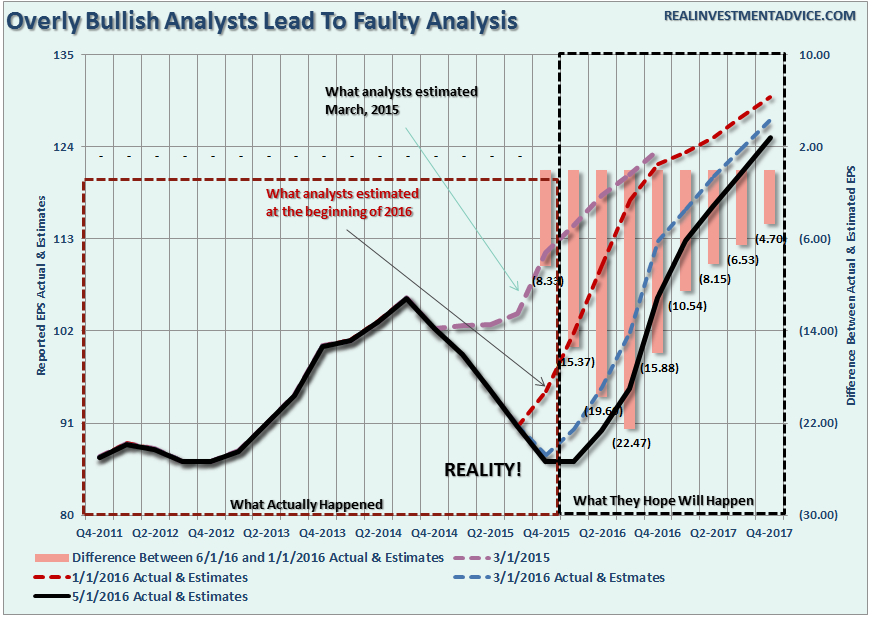
Earnings estimates for 2016 have been on the decline since last year, and as usual, have continued to be overly optimistic. Given the weakening economic backdrop, as discussed above, it is quite likely that current estimates will once again prove to overly optimistic as well.
However, let’s set estimates, and all the inherent “bullshit” that goes along with Wall Street estimates, and look at valuations.
Multiple contractions are far more ominous over longer periods of time. As shown in the chart below, the 5-Year CAPE (Cyclically Adjusted P/E) is far more sensitive to bull and bear markets in equities.
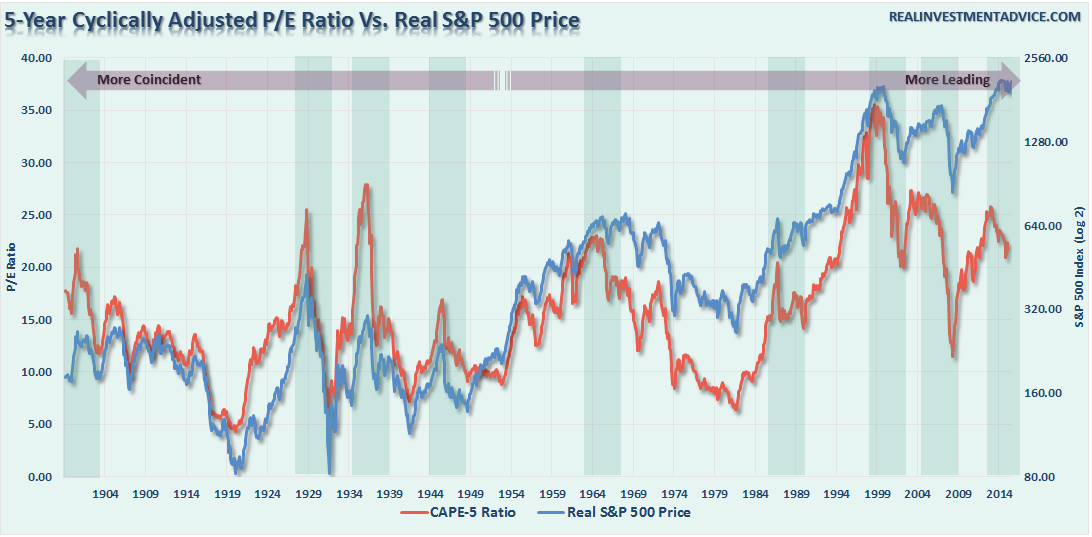
Post-WWII, the 5-year CAPE ratio has been more of a leading indicator of market returns in the future. However, this is the inherent problem of Wall Street analysis which touts investing for the long-term but then discusses potential returns over the next 12-months.
Another way to view this data is by looking at the deviation of the CAPE-5 ratio from its long-term average. Currently, at 41.11% above its long-term mean of 15.8x, the historical analysis suggests that future outcomes will likely not be palatable.
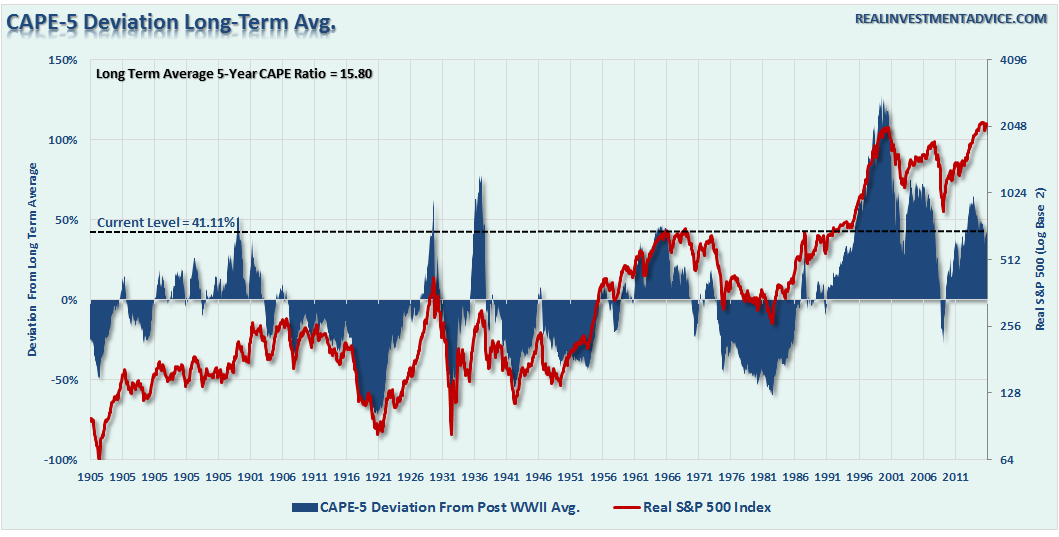
Here is the point. While markets can remain irrational in the short-term, historical analysis suggests the next few years will likely be either disappointing or potentially destructive.
Oh yes, about those earnings estimates. I wouldn’t really base my investment decisions on their accuracy.
Rates Suggest Negative Revisions Ahead
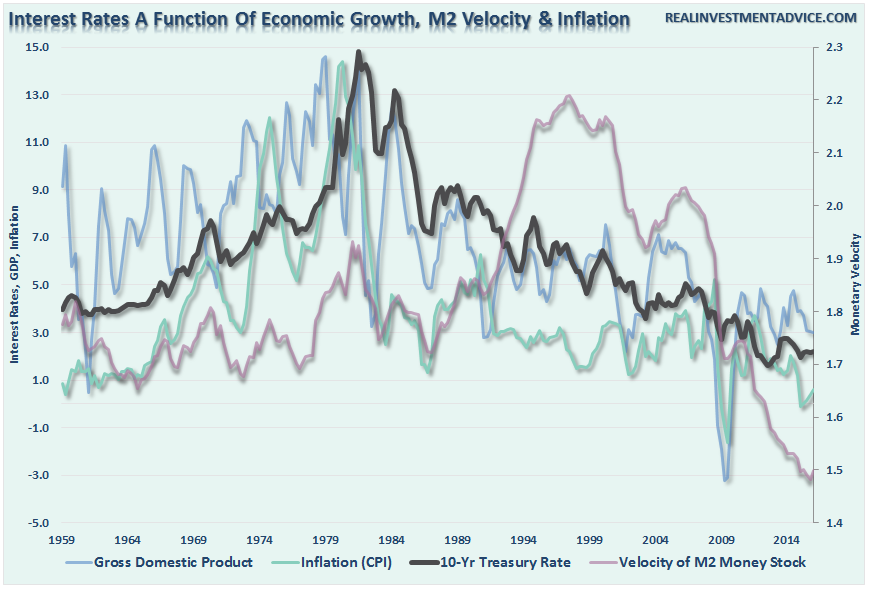
Despite rumors to the contrary, since 2013, the bond bull market remains alive and “kicking.” This is no surprise as I have written many times in the past, as interest rates, and ultimately bond prices, are a direct reflection of real economic strength and inflationary pressures.
Currently, as shown in the technical chart below, despite the recent disjointed rally in the S&P 500, the bond market has been suggesting a more bearish posture. As shown in the chart below, interest rates SHOULD have rallied (pushing bond prices lower) as money rotated from the SAFETY of bonds into equity related RISK.
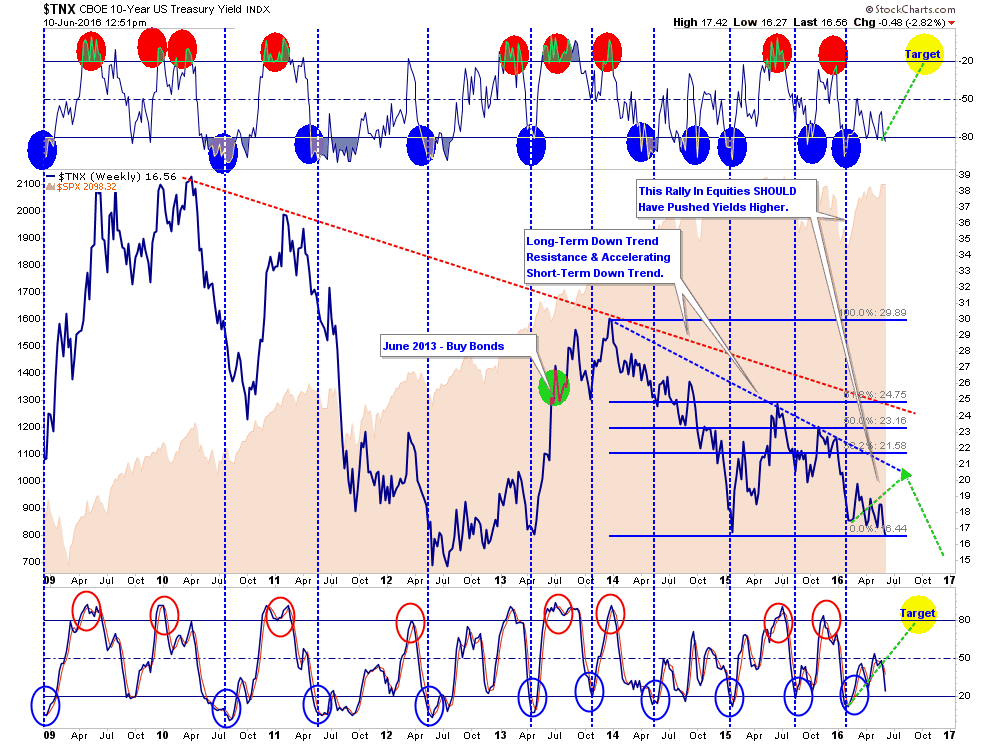
That didn’t happen, which suggests the current RISK-ON rally may be a bullish trap.
Furthermore, the recent decline in rates likely suggests a much weaker economic environment than is currently expected. The last time that rates were this low, and potentially heading lower, was during the economic slowdown in 2012 which boarded on recession.
In 2012, the Federal Reserve was in extreme accommodation mode, profits were growing and multiples were expanding. That is not the case today.
The takeaway of all this is the risk to equities may be higher than currently expected. If rates, economic data trends, and valuation reversions are sending the correct message, the forthcoming negative revisions to the underlying data will derail the current bullish thesis of a profits recovery in the making.
“When reward is at its pinnacle, risk is near at hand.” – Jack Bogle


