Written by Steven Hansen
Today, this post has added interactives “bending the curve” which show the U.S. is over the peak. Following is a set of interactive graphs and tables for the world and individual states – as well as today’s headlines on coronavirus which include topics on immunization and the half-life of the virus when exposed to sunlight, heat, and humidity.

Although the news looks better from where the U.S. was one week ago, what is evident reading between the lines is that there is no real understanding of how this virus spreads. Also one should question why the virus effects were so much worse in the U.S. than most other advanced economies.
One prime reason the U.S. does not know more is that record-keeping, testing, and data accumulation is lacking.
Coronavirus News You May Have Missed
Study proves that coronavirus vaccine would never work; might actually create MORE new viruses through recombination in human hosts – Natural News
Bill Gates, Andrew Cuomo, and others are calling for mass vaccinations against the Wuhan coronavirus (COVID-19), even though a vaccine for the novel virus doesn’t yet exist, as a condition for release from lockdown. But a 2015 study reveals that any vaccine for the Wuhan coronavirus (COVID-19) would actually create more viruses inside people’s bodies, making the situation worse than it already is.
An honest perusal of this study will more than likely lead you to one conclusion: That there’s never actually going to be a vaccine released for the Wuhan coronavirus (COVID-19) because making a truly effective one would never work. Of course, one could still be released that’s claimed to be effective, but any genuine look at it by regulators would surely reveal that it’s bogus, resulting in its rejection.
… It’s worth noting that developing a vaccine for coronavirus was already tried with the SARS variety. According to this study, multiple vaccines for SARS were, in fact developed, but none of them were ever approved because of the serious risks involved.
WebMD Poll: 93% With COVID-19 Symptoms Didn’t Get Test – Medscape
About 10% of people think they may have been infected with COVID-19, yet only 7% of them received a test to find out, a new WebMD poll finds.
That percentage is even higher in the New York City area, which has the greatest number of cases in the country. The WebMD poll suggests about 26% of New York City area residents are positive for COVID-19.
The poll mirrors national trends, which show that infection with SARS-CoV-2, the coronavirus that causes COVID-19, is more widespread than current data suggests.
Early antibody testing data from New York City showed an infection rate of 21.2% in the city.
White House promotes new lab results suggesting heat and sunlight slow coronavirus – The Washington Post
… William N. Bryan, the acting undersecretary for science and technology at the Homeland Security Department, detailed recent lab studies carried out by the agency at the U.S. Army’s high-level biosecurity laboratory at Fort Detrick, Md.
The results, which have not been peer reviewed but were briefed to the press and on live television via slides, largely match other laboratory studies and the suspicions of some researchers by showing that the novel coronavirus, like many other viruses, does not survive as long on certain surfaces and in the air when exposed to high amounts of ultraviolet light and warm and humid conditions.

Gee, what a surprise that heat, humidity, and sunlight affect a SARS type coronavirus. A 2011 study of the SARS coronavirus concluded;
The main route of transmission of SARS CoV infection is presumed to be respiratory droplets. However the virus is also detectable in other body fluids and excreta. The stability of the virus at different temperatures and relative humidity on smooth surfaces were studied. The dried virus on smooth surfaces retained its viability for over 5 days at temperatures of 22-25°C and relative humidity of 40-50%, that is, typical air-conditioned environments. However, virus viability was rapidly lost (>3 log10) at higher temperatures and higher relative humidity (e.g., 38°C, and relative humidity of >95%). The better stability of SARS coronavirus at low temperature and low humidity environment may facilitate its transmission in community in subtropical area (such as Hong Kong) during the spring and in air-conditioned environments. It may also explain why some Asian countries in tropical area (such as Malaysia, Indonesia or Thailand) with high temperature and high relative humidity environment did not have major community outbreaks of SARS.
Heat, humidity, and sunlight are at the beaches in Florida and elsewhere. One has to wonder why the beaches are closed.
Six new coronavirus symptoms just officially added to CDC list. What are they? – Miami Herald
The Centers for Disease Control and Prevention has tripled the number of coronavirus symptoms it lists on its website.
The federal organization previously listed fever, cough and shortness of breath as symptoms of COVID-19. The CDC has added six additional symptoms as people “have had a wide range of symptoms reported,” it says on its website.
New symptoms for the disease now include “chills, repeated shaking with chills, muscle pain, headache, sore throat and new loss of taste or smell,” the CDC said.
‘No Evidence’ That Recovered COVID-19 Patients Are Immune, WHO Says – NPR
The World Health Organization has pushed back against the theory that individuals can only catch the coronavirus once, as well as proposals for reopening society that are based on this supposed immunity.
In a scientific brief dated Friday, the United Nations agency said the idea that one-time infection can lead to immunity remains unproven and is thus unreliable as a foundation for the next phase of the world’s response to the pandemic.
“Some governments have suggested that the detection of antibodies to the SARS-CoV-2, the virus that causes COVID-19, could serve as the basis for an ‘immunity passport’ or ‘risk-free certificate’ that would enable individuals to travel or to return to work assuming that they are protected against re-infection,” the WHO wrote. “There is currently no evidence that people who have recovered from COVID-19 and have antibodies are protected from a second infection.”
Nursing homes are ordered to take in the infected. – The New York Times
The disease caused by the coronavirus has killed more than 10,500 residents and staff members at nursing homes and long-term care facilities nationwide, according to a New York Times analysis. That is nearly a quarter of deaths in the United States from the pandemic.
But states including California, New Jersey and New York are increasingly turning to nursing homes to relieve the burden on hospitals and take in Covid-19 patients considered stable enough to be released.
Although there is no evidence so far that the practice has allowed infections to spread in nursing homes, many residents and advocates fear that it is only a matter of time. One lawsuit in New Jersey alleges that a worker was likely to have been sickened by a Covid-19 patient readmitted from a hospital.
Coronavirus: What we still don’t know about Covid-19 – BBC
- How many people have been infected.
- How deadly it really is.
- The full range of symptoms.
- The role children play in spreading it.
- Where exactly it came from.
- Whether there will be fewer cases in summer.
- Why some people get much more severe symptoms.
- How long immunity lasts, and whether you can get it twice.
- Whether the virus will mutate.
| U.S. Only | Global | U.S Percentage of Total | ||||
| Today | Cumulative | Today | Cumulative | Today | Cumulative | |
| New Cases | 21,352 | 890,524 | 76,607 | 2,740,000 | 27.9% | 32.5% |
| Deaths | 1,054 | 51,017 | 5,151 | 195,387 | 20.5% | 26.1% |
| Mortality Rate | 4.9% | 5.7% | 6.7% | 7.1% | ||
| total COVID-19 Tests per 1,000 people | 0.58 | 14.06 | ||||
Today’s Posts On Econintersect Showing Impact Of The Pandemic With Hyperlinks
Current Economic Projections Considering The Coronavirus Impact
The Safest Way To Throw Out Contaminated Rubber Gloves
How Will COVID-19 Affect The Spending Of Financially Distressed Households?
A Post-Coronavirus Recovery In Asia – Extending A ‘Whatever It Takes’ Lifeline To Small Businesses
Infographic Of The Day: Staying Rational During Market Volatility
24.6% Unemployment Rate Coming
April 24, 2020 Weather Impacts On Economic Activity – Agriculture Being Stressed
Why Farmers Are Dumping Milk Down The Drain And Letting Produce Rot In Fields
Why Does President Trump Want You To Pay More For Amazon Products?
Coronavirus: Are We Underestimating How Many People Have Had It? Sweden Thinks So
Coronavirus INTERACTIVE Charts
include($_SERVER[‘DOCUMENT_ROOT’].’/pages/coronavirus.htm’); ?>
Analyst Opinion of Coronavirus Data
There are several takeaways that need to be understood when viewing coronavirus statistical data:
- The global counts are suspect for a variety of reasons including political. Even the U.S. count has issues as it is possible that as much as half the population has had coronavirus and was asymptomatic. It would be a far better metric using a random sampling of the population weekly. In short, we do not understand the size of the error in the tracking numbers.
- Just because some of the methodology used in aggregating the data in the U.S. is flawed – as long as the flaw is uniformly applied – you establish a baseline. This is why it is dangerous to compare two countries as they likely use different methodologies to determine who has (and who died) from coronavirus.
- COVID-19 and the flu are different but can have similar symptoms. For sure, COVID-19 so far is much more deadly than the flu. [click here to compare symptoms]
- From an industrial engineering point of view, one can argue that it is best to flatten the curve only to the point that the health care system is barely able to cope. This solution only works if-and-only-if one can catch this coronavirus once and develops immunity. In the case of COVID-19, herd immunity may need to be in the 80% to 85% range. WHO warns that few have developed antibodies to COVID-19. At this point, herd immunity does not look like an option.
- Older population countries will have a higher death rate.
- Each publication uses different cutoff times for its coronavirus statistics. Our data uses 11:00 am London time. Also, there is an unexplained variation in the total numbers both globally and in the U.S.
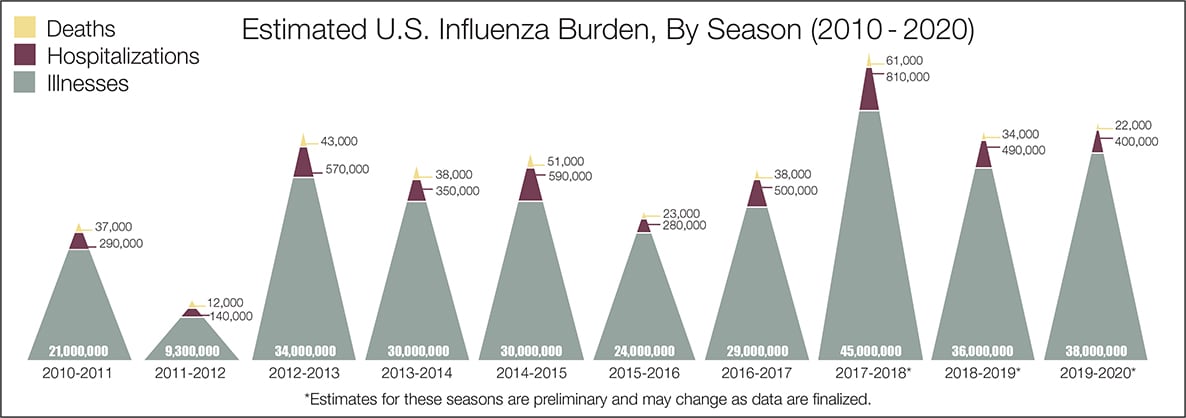
- The real question remains if the U.S. is over-reacting to this virus. The following graphic from the CDC puts the annual flu burden in perspective [click on image to enlarge].
What we do not know about the coronavirus [actually there is little scientifically proven information]. Most of our knowledge is anecdotal – not backed by scientific studies:
- Is social distancing at 6 feet correct? Some are saying 4 meters (13 feet). And what is the correct social distance if one rides a bike?
- Will warm weather and higher humidity slow the coronavirus spread? Will September see another spike in cases? Next Winter may see more cases than seen previously.
- Should we decontaminate products (such as food) that are brought into the house?
- Does one develop immunity after recovering from coronavirus?
- Is COVID-19 mutating? How will this impact the ability to create immunization or even immunity?
- Are ventilators damaging patients – should oxygen be used instead?
The bottom line is that COVID-19 so far has been shown to be much more deadly than the data on the flu. Using CDC data, the flu has a mortality rate between 0.06 % and 0.11 % Vs. the coronavirus which to date has a mortality rate of over 5 % – which makes it between 45 and 80 times more deadly. The reason for ranges:
Because influenza surveillance does not capture all cases of flu that occur in the U.S., CDC provides these estimated ranges to better reflect the larger burden of influenza.
include(“/home/aleta/public_html/files/ad_openx.htm”); ?>


