


Written by Sig Silber
Updated at 5:25 pm EDT August 20, 2021 to include the new week 3 – 4 forecast issued today.
This August 19, 2021, NOAA four-season forecast for CONUS and Alaska – including the Early Outlook for September, 2021 – covers a period that begins one month later than the forecast last month and extends one month longer. Also included is the updated three-month drought forecast. With this forecast we appear to have something like La Nina Conditions in Fall and possibly Winter. The level of confidence is not high on this, particularly the Winter aspect.

Please share this article – Go to the very top of the page, right-hand side for social media buttons. Please feel free to share this report with anyone you feel will find it useful.
The most significant statement from the NOAA Discussion.
| “The official CPC/IRI ENSO outlook indicates a 62 percent chance of La Nina during SON, with peak odds for La Nina at 69 percent in NDJ.” |
| This is very important because that is what CPC/IRI said on August 12, 2021. In their report today, their analysis is very different. Their wording today is “Similar to, but much more conservative than, the new official CPC/IRI outlook issued earlier this month, this objective outlook calls for ENSO-neutral to persist through at least Aug-Sep-Oct, with possible additional cooling followed by a return to ENSO-neutral.” |
Quite frankly it is annoying to me that the CPC/IRI releases results on the same day as does NOAA which is really the CPC part of NOAA. It is as if that group tries to introduce as much confusion as possible. By reading the NOAA discussion, it is clear that the forecast is based on the August 12 Report from CPC/IRI. I think the arrangement with IRI should be renegotiated as it seems to me that this organization which is part of Columbia University demonstrates a lack of common sense. It may not be their fault. And for sure, the CPC/IRI report is not the only tool that NOAA uses. But they seem to rely on it a lot and you can see the above quote from the NOAA discussion and the new quote from CPC/IRI. |
In our ENSO Analysis part of this report later in this report, we show both of the probability distributions released by CPC/IRI which I believe is mostly IRI. They release two a month and the first one is based on a survey of meteorologists. NOAA seems to have more faith in that report than the second report which is based on the results of a large number of forecasting models. We see this flip flopping regularly with the CPC/IRI results. It is August so the SPB does not come into play. I have not looked at the JAMSTEC forecast in any detail but I have included the Australian BOM forecast which is more consistent with the August 19 CPC/IRI forecast. I know that JAMSTEC also forecasts a weak Modoki-like La Nina but their forecast is based on August 1 conditions so it may or may not be reliable other than the Modoki aspects which probably are part of the situation. The duration of La Nina conditions and the intensity of the La Nina conditions would impact the forecast. Thus the high level of uncertainty for late Fall and the Winter. Will we be having a mild La Nina or neutral conditions with a La Nina bias. That area of the Pacific will be cool but how cool is the issue. We are talking about whether the anomaly at the surface will be -0.5C or -0.8C or something like that. So it does not totally change the forecast of temperature and precipitation but the choice of assumptions will have some impact. It is not just the ocean temperature but the reaction of the atmosphere to that temperature. So a small change in the assumptions on the Sea Surface Temperature in the Nino 3.4 Measurement Area may have a large impact on the reaction of the Atmosphere. September is not likely to be impacted by this uncertainty. But October through January are likely to be impacted. |
| When you read the NOAA discussion and possibly our comments you will see that this difference does not impact the months farther out as the forecast in that case is based on statistical trends and it does not impact September. With respect to the uncertainty of the impact in late Fall and most importantly this coming winter. I do not know what to say. On September 9 we will get a new report from NOAA based on the first report from CPC/IRI. We may get some clues from the End of Month Report but that focuses on September but it may provide some clues to the subsequent months. For those doing water planning, this kind of confusion is simply not helpful. This is vital to the U.S. West right now. There needs to be better coordination between CPC and CPC/IRI. IMO the CPC/IRI mid-month report should not be released on the same day that NOAA releases its Seasonal Outlook. We are not yet to the point where the Seasonal Outlook adjusts automatically to the latest ENSO forecast. Perhaps we need to get there. |
I encourage everyone to read the full NOAA Discussion. They do a good job of explaining how they have made the forecast. That makes it possible to critique their forecast if one disagrees with their assumptions and methodology. I am not suggesting that readers should do that but I am suggesting that the NOAA maps provide the synthesized forecast while the NOAA discussion provides additional information on why and how the forecast may differ from the maps presented. So looking at the maps is great but reading the NOAA discussion and then looking at the maps provides additional understanding of how this forecast may play out.
A. Focus on the NOAA Update
First, we will take a look at the NOAA Early Outlook for September 2021. It is called the Early Outlook because it will be updated at the end of August. Only the September Outlook will be updated at that time.
Temperature

Precipitation

We have nothing to compare these maps with as NOAA does not provide in their Update a forecast for each of the subsequent two months separate from their three-month forecast. Thus I do not have forecast maps for September from the previous NOAA Report to compare against. The current month is not over so we can not really compare the forecast for next month against the actual for this month. If we do the comparison with JAMSTEC, we have been receiving monthly forecasts for the first three months so we may be comparing the NOAA and JAMSTEC forecasts for September, I have not received the forecast from JAMSTEC but I am not inclined to do that comparison. It is probably best in this article to just try to understand what NOAA is trying to convey about September*. For Temperature, there is a cool anomaly centered on Louisiana and including a circle of neighboring states or parts of neighboring states. Then there is a huge EC area and then a warm area across the Northern Tier, a large part of the West and southern Florida. Western Alaska is also warm. All of this is relative to the current climate norms.
With respect to precipitation, most of the Eastern third or more of CONUS is wet except for Florida and southern Georgia and a bit of Alabama and South Carolina which are EC. There is a large dry anomaly stretching from California to Minnesota. It shows a higher probability of being drier than normal as it extends north and east. New Mexico and half of Arizona are EC which should mean a normal September climax of the Monsoon for those areas. Western Alaska is dry but the Alaskan Panhandle is wet.
Listen up all those planning to play the Monsoon Fantasy Game described at the end of this article. It will be time to get your September forecasts in very soon. You might want to pay attention to the September forecast.
* compared to normal/climatology for the indicated time of the year.
Visual Consistency Testing.
It is useful to see how the month forecast fits with the set of shorter forecasts that we have. The first two maps cover only August and the third map as of today covers through September 10. Thus only the third of the three maps is at all useful for this purpose. The Seasonal Outlook was issued late this month since the third Thursday fell on August 19. The earliest possible issue of the forecast is on the 15th of the month. We are publishing on a Thursday so we do not have the updated Week 3-4 forecast. 10 days is not an adequate basis for doing this visual consistency testing. There are 30 days in September. We will update this article tomorrow and we will then have 17 days which is marginally adequate for our purposes. We have now updated the discussion as we now have the new Week 3 – 4 Forecast. Remember that compared to the prior forecast is starts one week later and extends on week longer.
First Temperature
 |  |  |
| The new monthly forecast is to the right. Does it appear to be reflective of the parts of the month for which we have forecasts? → |
| ↑ ← We now have17 days of short-term forecasts. That is not enough information to be real precise but it does seem like there is at least a fair fit with the full month forecast. We will also revisit the forecast at the end of August when the September forecast is updated. |

And then Precipitation
 | 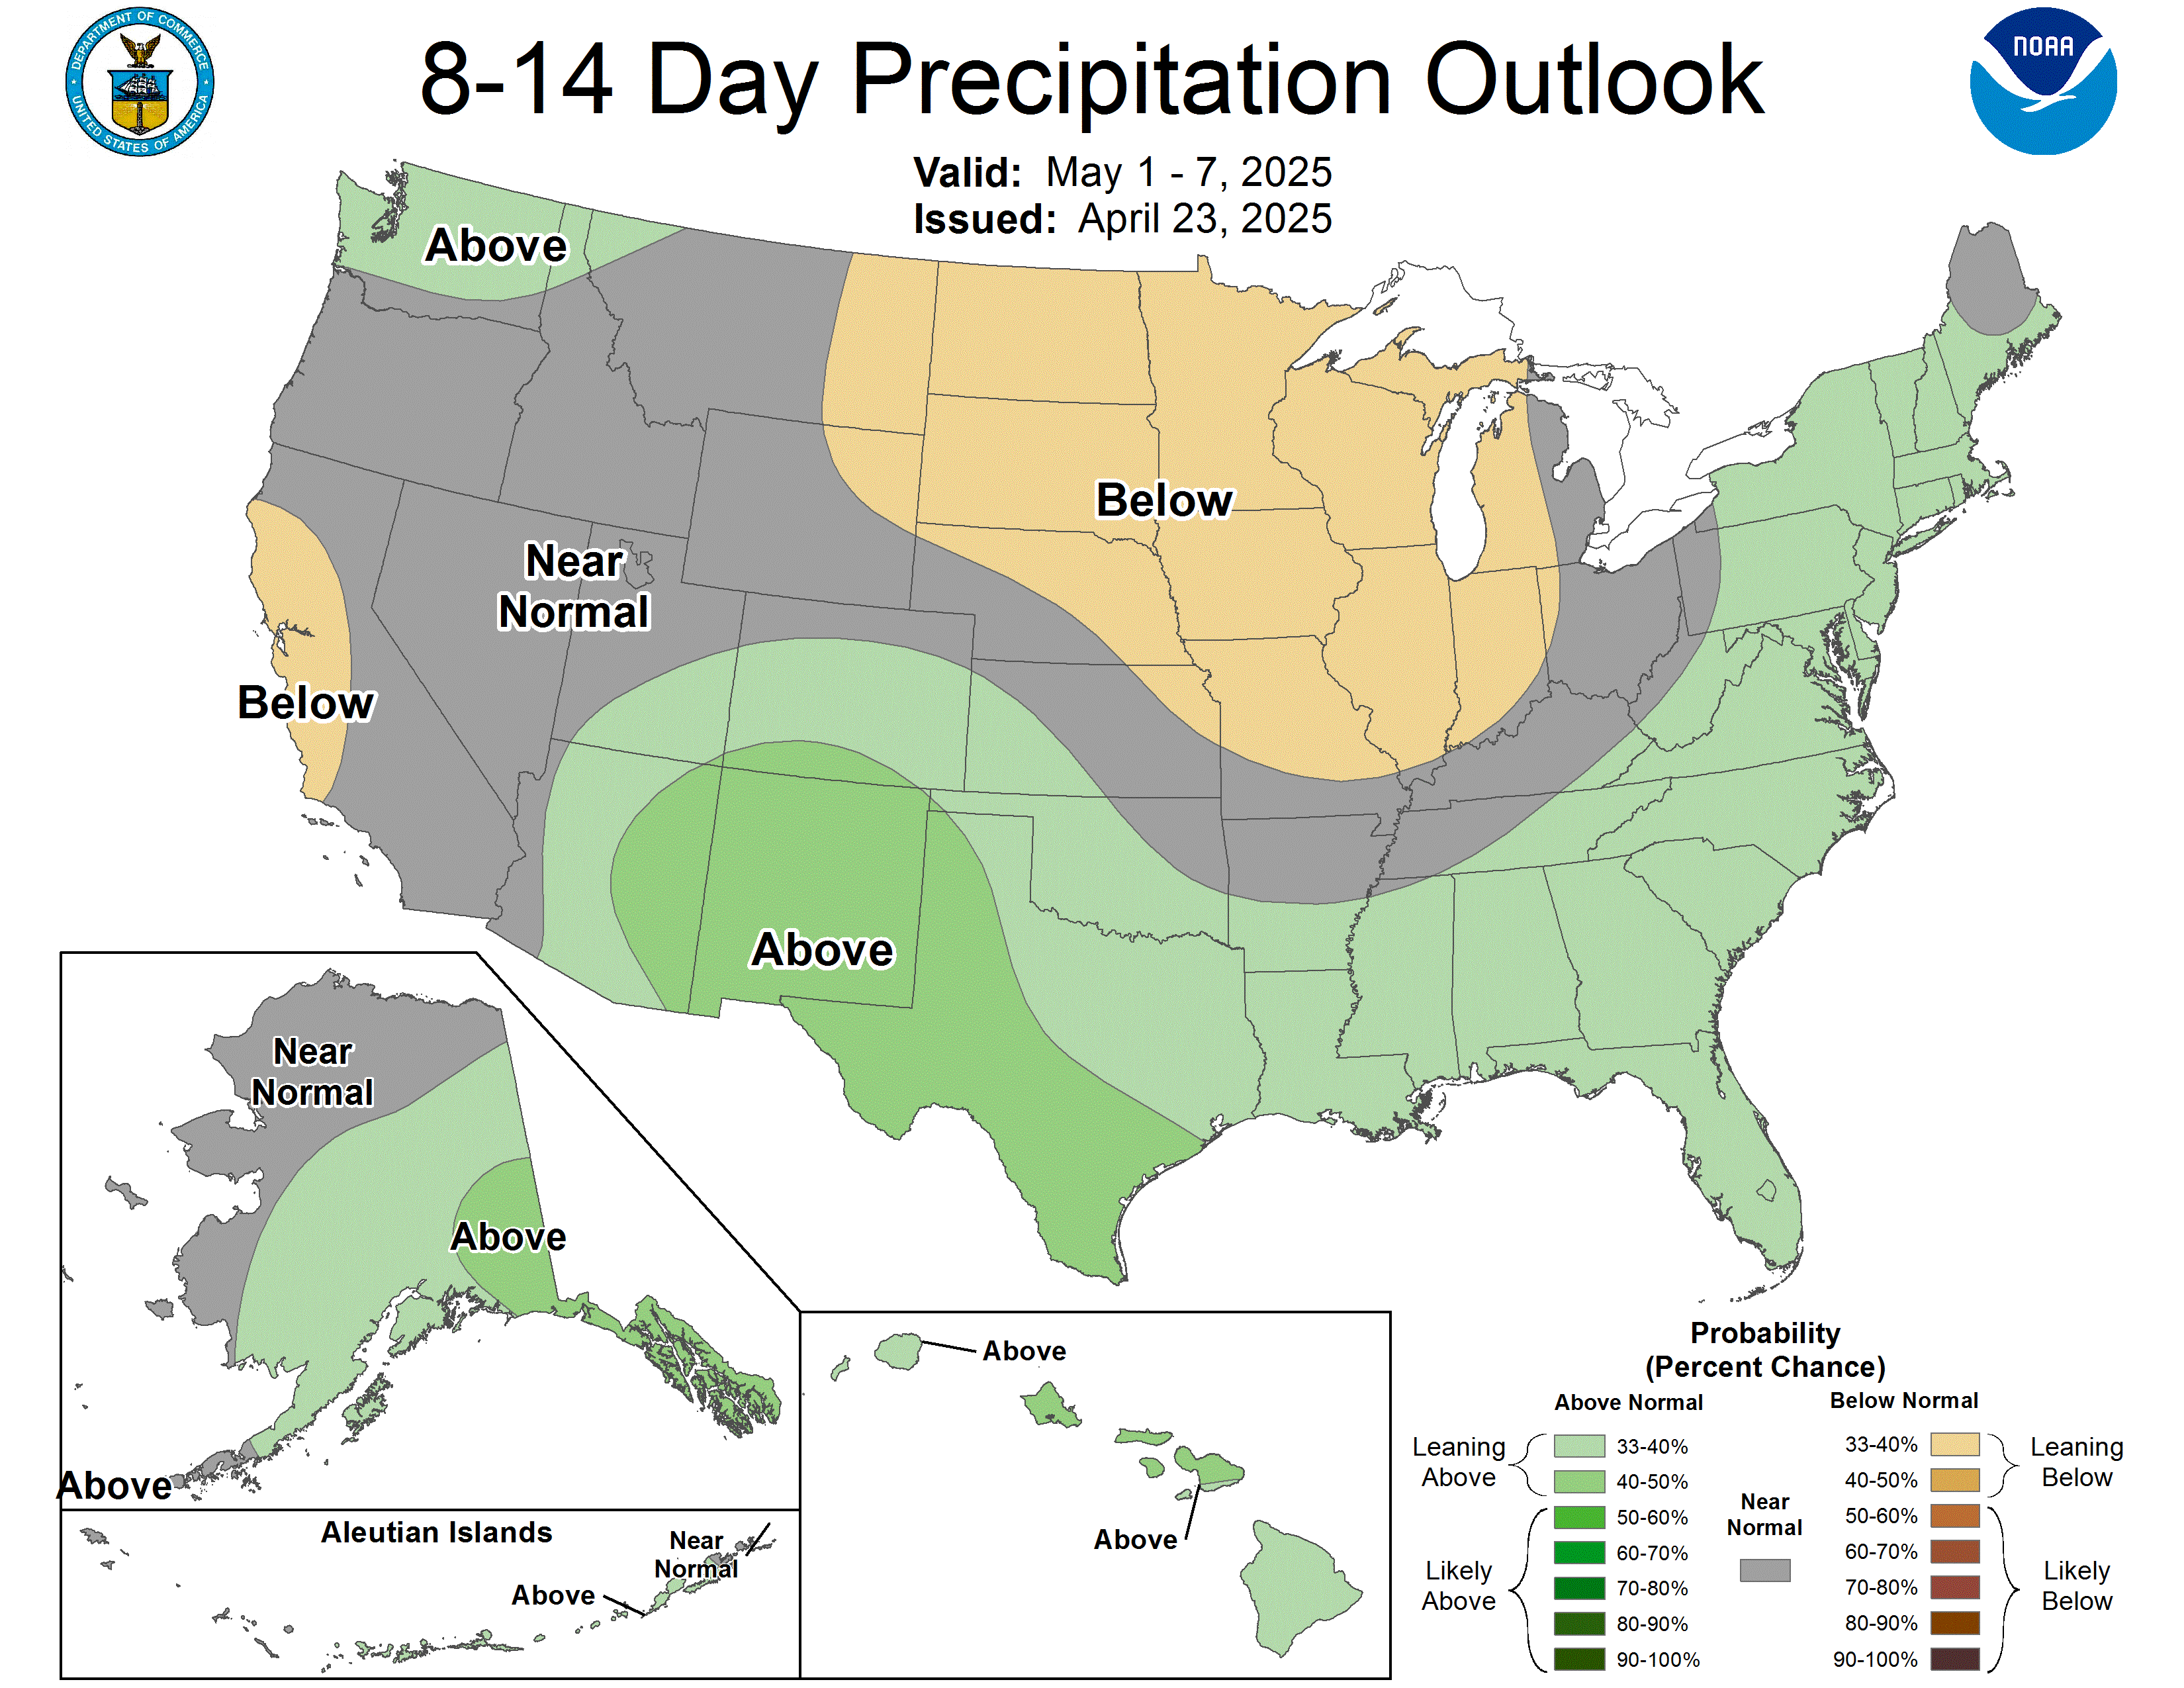 | 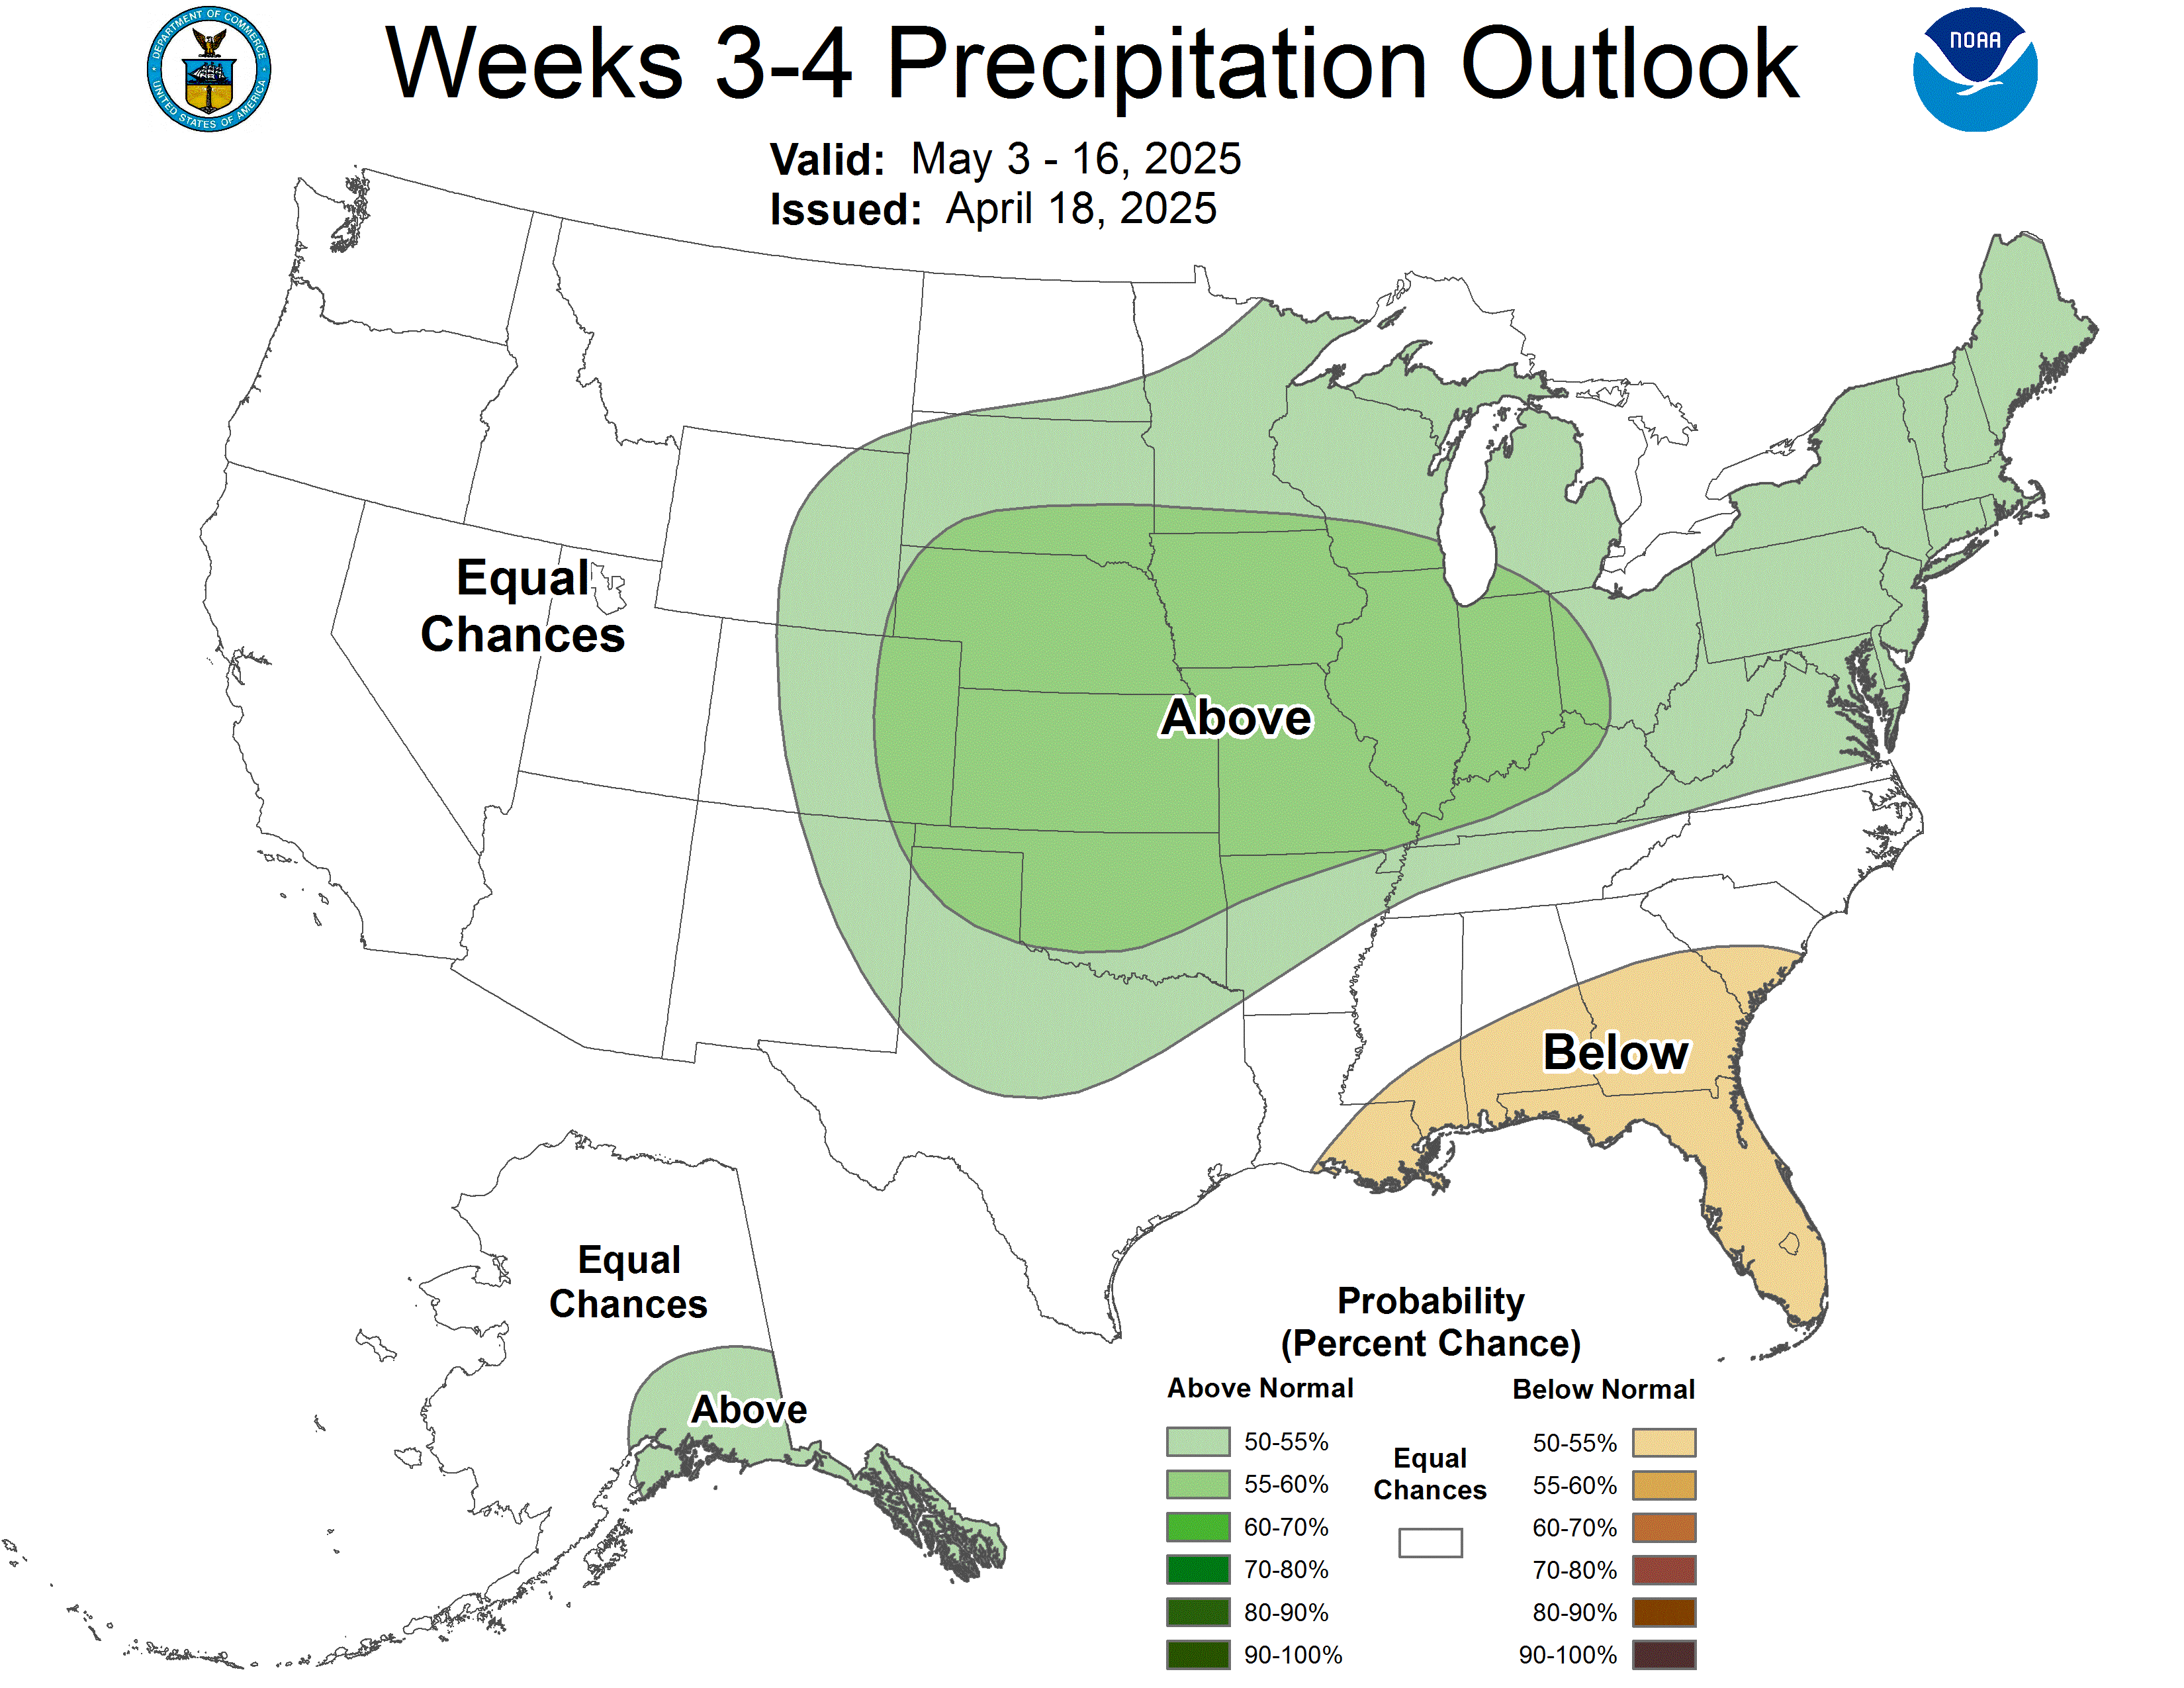 |
| The new monthly forecast is to the right. Does it appear to be reflective of the parts of the month for which we have forecasts? → |
| ↑ ← We now have 17 days of short-term forecasts. That is not enough information to be real precise. It does seem like there is a fair fit with the full month forecast with dry periods and wet periods in some cases canceling each other out. We will also revisit the forecast at the end of August when the September forecast is updated. |
Sometimes it is useful to look at the Week 3-4 Discussion. It was issued Friday afternoon August 20, 2021 and it is shown below.
Week 3-4 Forecast Discussion Valid Sat Sep 04 2021-Fri Sep 17 2021
ENSO-neutral conditions are currently present across the tropical Pacific Ocean. Equatorial sea surface temperatures (SSTs) are near to below average across most of the Pacific Ocean with low level easterly wind anomalies observed over the east-central equatorial Pacific Ocean and upper level westerly wind anomalies across the western and eastern equatorial Pacific Ocean. The RMM indices depict an active MJO eastward propagation across the Western Hemisphere during late July and early August. Dynamical model MJO index forecasts favor the MJO to decrease in amplitude as it propagates east over the Indian Ocean.The MJO is likely to continue influencing anomalous global tropical rainfall and modulating tropical cyclone development through Week-1. The Week 3-4 temperature and precipitation outlooks are based primarily on dynamical guidance including the GEFS, CFS, Canadian, ECMWF, JMA, the Subseasonal Experiment (SubX) multi-model ensemble (MME) of experimental and operational ensemble prediction systems, with additional considerations for MJO, ENSO-neutral, decadal climate trends, and soil moisture conditions, as well as the predicted evolution of the pattern from Week-2 forecasts.
A fair amount of variability exists among the dynamical models regarding the anomalous 500-hPa height pattern over the Week 3-4 period. A trough and associated negative 500-hPa height anomalies are forecast over the eastern CONUS. Most dynamical models feature near to above normal 500-hPa height anomalies over Hawaii.
Above normal temperatures are forecast across most of the northern and eastern CONUS, southern Mainland Alaska and the Aleutians as well as the Alaska Panhandle, as a result of slightly positive mid-level height anomalies and decadal trends. Equal chances of above and below normal temperatures are also predicted for southern areas of the Southwest Monsoon region, with the prediction of continued precipitation for the region. Below normal temperatures are likely for the southern Lower Mississippi Valley, associated with both currently unusually high soil moisture conditions and a potential for tropical storm activity during the period.
Below normal precipitation is likely for much of the Pacific Northwest region, southern Mainland Alaska and the Aleutians as well as the Alaska Panhandle, as indicated by blends of precipitation tools and the SubX MME consensus precipitation forecast. An active monsoon and above normal precipitation is predicted for parts of the Southwest region by a consensus of dynamical model forecasts. A predicted trough over the eastern CONUS increases odds for above normal precipitation for much of the Gulf Coast and Southeast regions. Above normal precipitation is predicted for parts of the Northern Plains and Upper Mississippi Valley region, as indicated by blended precipitation forecast tools and the SubX MME precipitation tool.
The SubX MME indicates increased probabilities of below normal precipitation for all of the Hawaiian Islands in the Week 3-4 period. Model forecasts indicate greater uncertainty for the temperatures outlook for Hawaii during the Week 3-4 period, so equal chances of above and below normal temperatures are predicted.
Now we consider the three-month Outlook.
Notice that the three-month periods are abbreviated e.g September/October/November is shown as SON. You will see such abbreviations often in this report.
Prior Temperature Outlook for SON 2021

New Temperature Outlook for SON 2021

Now Precipitation.
Prior forecast for SON 2021

New Precipitation Outlook for SON 2021

I can make the comparison easier by showing the prior forecast and the current forecast side by side.
| Prior Forecast | New Forecast | |
| Temperature | | |
| Precipitation | |  |
Now let us focus on the long-term situation.
First Temperature
Prior 14 Month Temperature Outlook: SON 2021 – ASO 2022

New 14 Month Temperature Outlook: OND 2021 – SON 2022

To compare maps from one release to another, one needs to remember that the new release drops one three-month period and adds a later one. So to make the comparisons one has to shift the new maps to the right one position and that makes the map on the right drop-down to become the left-most map in the next level. I do not have a computer software tool for doing that for you so you have to do it mentally. When I do the comparison, I print the two sets of maps and put them side by side and number the same three-month maps 1, 2, 3,…..,11 in both sets of maps to make it easier for me to easily compare the same three-month period in the new with the previous forecast.
I am now showing them side by side in addition to one after another. It is easier to make the comparison this way but to do it I have to make the maps smaller and readers have to remember how to compare two sets of maps when one starts a month later than the other. Here goes:
| Forecast Issued Last Month | Forecast Issued This Month |
| |
Based on this procedure, I conclude that:
Now Precipitation
Prior 14 Month Precipitation Outlook: SON 2021 – ASO 2022

New 14 Month Precipitation Outlook: OND 2021 – SON 2022

I am also going to show the two graphics side by side. It is tricky because the array for the current month starts one month later. So you have to follow the instructions I provided with the temperature array of maps. So you can compare the forecast maps by looking at the large ones which are shown with the prior month forecast followed by the forecast this month or you can look at them side by side.
| Last Month | This Month |
| |
If you want larger versions of each newly issued map (temperature and precipitation) you can find them here. And then each of those maps can be clicked on to further enlarge them.
Sometimes it is useful to compare the three-month outlook to the forecast for the first of the three months. It shows how much the pattern changes over the three months.

One can mentally subtract the First-Month Outlook from the Three-month Outlook and create the Outlook for the last two months in the three months.
*The concept is that the probabilities of a deviation from climatology in the First Month and the combined Month Two-Three forecast that one derives must average out to the probabilities shown in the three-month maps.
Below is the NOAA Discussion (slightly reorganized) released by NOAA on August 19, 2021. Headings that are “Initial Cap” only rather than all caps were added by the Author of this Update Report for clarity. Also, we have organized the sequence of the sections of NOAA Discussion to first present the Atmospheric and Oceanic Conditions and then the Initial Month (September), the NOAA Summary for SON, and finally the remainder of the 15-Month Forecast.
CURRENT ATMOSPHERIC AND OCEANIC CONDITIONS
The coupled oceanic and atmospheric observations reflect ENSO-neutral conditions. Sea surface temperatures (SSTs) are near climatological averages across most of the equatorial Pacific Ocean, though for most of July, Nino3, Nino3.4, and Nino4 were slightly negative. At depth, temperatures were largely below normal for the month of July and into August, a change from June and into early July when temperatures at depth were above normal. Over the central Pacific, low-level winds have been stronger than average, while upper-level winds are less coherent. OLR shows reduced convection west of the Date Line, and almost no signal for the equatorial central and eastern Pacific.
PROGNOSTIC DISCUSSION OF SST FORECASTS
Most dynamical and many statistical tools are indicating a transition to La Nina in the autumn, with higher odds into winter 2021-2022. The SST-CA (Constructed Analog based on SSTs) is a bit of an outlier, indicating a warmer solution than most other tools. The CPC Consolidation outputs have SST anomalies below -0.5 C from SON 2021 to DJF 2021-2022. Dynamical model ensemble means from the NMME all predict below normal SSTs in the Nino3.4 region, with all models below the -0.5 C threshold by November. Copernicus Climate Change Service (C3S) models are slightly warmer but all display negative SST anomalies in the ensemble means. C3S and NMME have different climatologies, that differ about the same magnitude of the differences in the mean plots. The official CPC/IRI ENSO outlook indicates a 62 percent chance of La Nina during SON, with peak odds for La Nina at 69 percent in NDJ.
30-DAY OUTLOOK DISCUSSION FOR SEPTEMBER 2021
The September 2021 outlooks are issued against the backdrop of El Niño Southern Oscillation (ENSO) Neutral conditions and an ongoing strong Madden-Julian Oscillation (MJO) event. The most recent three month observations of the Niño 3.4 index (corresponding to the May-June-July season) indicated mean sea surface temperature (SST) anomalies of -0.4C. This represents a weakening relative to the La Niña event experienced during the past winter when the average index value during the December-January-February season was near -1.0C. Equatorial SSTs are generally expected to remain near to below average with a re-emergence of La Niña conditions possible within the next three months and a La Niña Watch is currently in effect. Additionally, an ongoing strong MJO event is currently propagating eastward over the Indian Ocean with the amplitude of the Wheeler-Hendon index exceeding 2.5. The current evolution of these ENSO and MJO signals would tend to favor below normal 500-hPa heights across much of the eastern Contiguous United States (CONUS) and south of Alaska. Signals from the MJO and ENSO conflict across western North America as MJO composites favor much higher 500-hPa heights relative to that produced by ENSO composites. It should be noted that the sample size of these composites are relatively small, thus, reducing the reliability of the signal. Analysis of the most recent monthly and subseasonal dynamical model guidance, recent trends, as well as contributions from current environmental conditions were also utilized in the production of these outlooks.
Temperature
Above normal temperatures are favored for much of the western CONUS and Northern Plains due to good agreement among dynamical model guidance and MJO composites. Enhanced probabilities of above normal temperatures are largely absent farther to the south and east across the remainder of the Plains, most of the Mississippi Valley, and the Southeast, consistent with potential troughing over the eastern CONUS suggested by MJO and ENSO composites. Below normal temperatures are favored for the western and central Gulf Coast Region, the Lower Mississippi Valley, and eastern sections of the Southern Plains, supported by dynamical model guidance from the CFSv2 and Copernicus Climate Change Service (C3S). Agreement is generally good among dynamical model guidance for warmer than normal conditions across the Great Lakes and Northeast. Thus, above normal temperatures are favored for these regions. However, probabilities are tempered due to potential troughing across the eastern CONUS suggested by MJO and ENSO composites. Uncertainty is high across most of Alaska due to weak or conflicting signals among dynamical model guidance. Therefore Equal Chances (EC) of above, near, or below normal temperatures are indicated for most of the state. However, above normal temperatures are weakly favored for parts of coastal southwestern Alaska due, in part, to above normal SSTs in adjacent waters.
Precipitation
The potential for troughing may promote an active pattern across much of the central and eastern CONUS. This is supported by MJO and ENSO composites which favor above normal precipitation from parts of the Gulf Coast northeastward to the Great Lakes and Mid-Atlantic states and the CFSv2, which depicts a wet pattern across most of the southern two-thirds of the CONUS. However, probabilities are tempered due to lack of support from the NMME and C3S dynamical model tools. Conversely, below normal precipitation is favored across much of the West as dynamical model guidance generally supports a dry pattern, particularly from the Great Basin to the Northern Rockies and Northern High Plains. A wet pattern is favored farther to the north across southeastern
Alaska due to good dynamical model support and agreement with MJO composites. ENSO composites, as well as dynamical model guidance from the NMME and CFSv2 favor a dry pattern for parts of western Alaska, where elevated chances of below normal precipitation are indicated.
SUMMARY OF THE OUTLOOK FOR NON-TECHNICAL USERS (Focus on September, October and November)
ENSO-neutral conditions are present in the equatorial Pacific and ENSO-neutral is favored for the remainder of summer. La Niña could emerge during the August-October season and last through the 2021-22 winter. The odds for La Nina to develop earlier in the autumn of 2021 have increased this month, and the outlooks reflect that change.
Temperature
The temperature outlook for September-October-November (SON) 2021 largely favors above normal temperatures, with the exception of Southern Mainland Alaska and the Alaska Panhandle, portions of the Northwest to the Northern Plains, and portions of the Lower-Mississippi Valley and Gulf Coasts.
Precipitation
The precipitation outlook is highly uncertain, so probabilities are modest and coverage is low for the SON outlook. There are no strong changes to climatological odds east of the Mississippi, and below normal precipitation is generally favored from the Southwest to the Great Plains. Above normal precipitation is weakly indicated from the Alaska Panhandle to the Pacific Northwest. Conversely, below normal precipitation is slightly favored for parts of the South Coast of Mainland Alaska.
Equal chances (EC) are indicated for areas where probabilities for each category of seasonal mean temperatures and seasonal accumulated precipitation are expected to be similar to climatological probabilities.
BASIS AND SUMMARY OF THE CURRENT LONG-LEAD OUTLOOKS
PROGNOSTIC TOOLS USED FOR U.S. TEMPERATURE AND PRECIPITATION OUTLOOKS
Dynamical model forecasts from the NMME and C3S multi-model ensemble systems are used extensively for the first six leads when they are available. A consolidation of ENSO-OCN, CA, CCA, and NMME was also used for all seasons. OCN representing recent trends , was also considered in all seasons. The SST-CA was weighted less due to the outlier forecast for Nino 3.4 values, though it did serve as a slight hedge in some areas.
PROGNOSTIC DISCUSSION OF OUTLOOKS – SON 2021 TO SON 2022
TEMPERATURE
For the SON outlook, above normal temperatures are favored across most of the CONUS and Alaska. Trends and an increased influence of La Nina resulted in competing signals for portions of the Pacific Northwest, Northern Rockies, and Northern Plains, so EC is indicated there. A potential cooler start to the season resulted in a mixed signal for much of the Gulf Coast and Southeast, so EC was indicated from eastern Texas to Georgia. Sea ice coverage and extent in the seas north of Alaska are above/ahead of recent years, but still likely to be below/behind the long-term normal, so odds for above normal temperatures are favored, with more certainty, for the north coast of Alaska.
For OND 2021 through MAM 2022, the seasonal outlook represents the enhanced likelihood of La Nina. Positive decadal temperature trends across most of the domain are moderated by the impacts of temperature variability due to La Nina. Areas of EC expand across much of Alaska and the northern tier of the CONUS in OND 2021 and NDJ 2021-2022, including the Pacific Northwest, Northern and Central Plains, and western Great Lakes regions. Below normal temperatures are more likely for parts of the Pacific Northwest in DJF through FMA 2022, and across the northern tier into parts of the northern Plains in FMA. Below normal temperatures are also favored for parts of southeastern Mainland Alaska and the Alaska Panhandle from NDJ 2021-2022 through FMA 2022, due to potential La Nina impacts.
For AMJ 2022 and thereafter, the forecast pattern primarily reflects decadal trends with above normal temperatures favored for much of the West and across the southern and eastern CONUS through next spring and summer. Probabilities of above normal temperatures peak in the summer of next year across the West and along the Atlantic coast, consistent with the seasonal influence of decadal climate trends . Decadal trends favor above normal temperatures for northwestern areas of Alaska next spring, related to long term changes in sea ice cover during this season, and across the state by summer of 2022.
PRECIPITATION
Dynamical model forecasts from the NMME support slightly elevated probabilities of below normal precipitation for much of the West into the Northern Plains, excluding parts of the Pacific Northwest, in the SON seasonal outlook. Dynamical model forecasts and some statistical tools favor above normal precipitation in SON for portions of the Pacific Northwest and the Alaska Panhandle. Trends would favor below normal in the Alaska Panhandle, so this portion of the outlook is more reliant on dynamical model output and relationships to La Nina. Those same tools indicate enhanced odds for below normal precipitation for portions of southern mainland Alaska.
From this coming winter into next spring the precipitation pattern forecast increasingly reflects the potential for La Nina development and influence. Enhanced probabilities of below normal precipitation persist for much of the Southwest through MAM 2022, while probabilities of above normal precipitation are enhanced for parts of the Mississippi and Ohio Valleys from JFM through MJJ 2022.
After spring 2022, and into summer 2022, decadal precipitation trends become more influential, favoring above normal precipitation for parts of the Mid-Atlantic in MJJ through SON 2022. The same trends would favor below normal precipitation along the Rockies and over the Southwest in summer 2022. Decadal trends are the primary signal for above normal precipitation for the North Slope of Alaska in NDJ 2021 through FMA 2022 and for parts of eastern interior Alaska in JJA through SON 2022.
We will discuss this more when we compare the JAMSTEC to the NOAA forecast. But it is useful to look at the JAMSTEC discussion. But we have not received it yet. If we receive it soon, I will add it to the report.
Drought Forecasts
These two forecasts (Monthly and Season) are issued by the same agency but to obtain them you need to access two different links here (for the single month forecast which comes out at the end of the month and here for the forecast issued with the Seasonal Outlook.
Here is the Three-Month Drought Forecast that was issued on August 19, 2021

We can compare the new forecast to the prior forecast recognizing that the new forecast is for a three-month period that begins one month later.
| Prior Forecast | New Forecast |
 | |
There are two versions of the discussion of the seasonal drought outlook: long and short and this month I am providing the long version.
Discussion for the Seasonal Drought Outlook
Tools used in the U.S. Seasonal Drought Outlook (SDO) included the Climate Prediction Center (CPC) temperature and precipitation outlooks for September and September through November 2021 (SON), various short- and medium-range forecasts and models such as the 7-day quantitative precipitation forecast (QPF) from the Weather Prediction Center (WPC), the 6-10 day and 8-14 day CPC extended-range forecasts (ERFs), the Weeks 3-4 outlooks and related tools from CPC, dynamical models at the monthly and seasonal time scales, the 384-hour total precipitation forecasts from several runs of the GFS, climatology for the SON season, and initial conditions such as soil moisture. The USDM valid on August 17 was used for initial drought conditions.
Drought remains firmly entrenched across the western conterminous U.S., with nearly the entire Western Region experiencing drought conditions (D1 or worse) according to the U.S. Drought Monitor, valid on August 17, 2021. Across much of the West Coast, the northern Great Basin, and Northern Rockies, record-setting heat waves in recent weeks to months, coupled with much below-normal precipitation, have resulted in drought expansion and deterioration. Despite the expansion of drought conditions during the Summer months, La Niña is favored to redevelop during the Fall, which typically leads to cooler-than-normal conditions across the Pacific Northwest and Northern Rockies, and acts to increase odds for above-normal precipitation across these same areas, particularly toward the end of the period. Coupled with the fact that November is the climatological start to the rainy season in the Pacific Northwest, drought improvement and removal is favored along the windward slopes of the Cascades, with persistence east of the Cascades.
Farther south over the Four Corners, however, a robust North American Monsoon season has aided in slow drought recovery since July, particularly over parts of Arizona and New Mexico. With the climatological end to the North American Monsoon in September and the favored redevelopment of La Niña conditions in the tropical Pacific Ocean during the Fall season, which typically favors warm and dry conditions over the Southwest, any additional improvements in the Southwest would most-likely be very early in the SON season, with warm and dry conditions setting in for the remainder of the season (October-November). In addition, the U.S. Drought Monitor (as of July 27, 2021) depicts much of Arizona and New Mexico with longer-term (hydrologic) impacts, indicative of the longer-term dryness this region has experienced going back to Summer 2020. Therefore, persistence is forecast across the Desert Southwest and Four Corners, due to the early end (with respect to the SON season) of the monsoon season, coupled with the potential return of La Niña conditions in the Pacific.
Forecast confidence is high for the Four Corners and Great Basin, and moderate elsewhere in the West.
Drought is entrenched across northern and western sections of the High Plains Region (i.e. the Dakotas, Wyoming, and western Colorado). In the Central Plains (eastern Colorado, Nebraska, and Kansas), a wet Spring and active North American Monsoon season has resulted in large improvements, and even drought removal, earlier in 2021. However, drier-than-normal conditions over the past 30 to 90 days have resulted in drought redevelopment and deterioration, particularly across Nebraska and parts of Kansas. As the High Plains Region transitions from a wetter to drier time of year during the SON season, chances for drought improvement will become greatly diminished. Despite an increased potential for heavy precipitation across the Dakotas over the next 7 days (per WPC’s 1-7 day QPF) and a lack of temperature and precipitation signals (i.e. equal chances for above and below-normal) during September, warmer and drier conditions are favored for the SON season as a whole across the High Plains. As such, drought persistence is favored for much of the region, with the potential for drought development in the Central Plains.
Forecast confidence is moderate for the High Plains Region.
Since the August-October SDO release, the Southern Region has benefited from a mean frontal boundary that has been draped over the region for the better part of August, causing an active precipitation regime. However, several spots have missed out on the heavier precipitation amounts, particularly across the Tennessee Valley, resulting in some abnormal dryness in addition to deterioration to D1 (moderate drought) conditions in the Smoky Mountains. Meanwhile, in far western Texas, near the Big Bend and Trans-Pecos regions, an active North American Monsoon has helped to nearly eliminate drought altogether from Texas. With above-normal precipitation over the next 7 days and improved precipitation deficits in recent weeks, drought removal is predicted near the Big Bend of Texas. Drought removal is likely in the Tennessee Valley, with equal chances for above-, near-, or below-normal temperatures and above-, near-, or below-normal precipitation during September, despite a likely return to above-normal temperatures later in the Fall. In addition to the equal chances for above-, near-, or below-normal precipitation, the potential threat for tropical activity also looms, as the climatological peak to the Atlantic Hurricane season will occur toward the beginning part of the SON season (early-to-middle September).
Forecast confidence high for the Southern Region.
Much of the Great Lakes have experienced marked improvements to, and removal of, drought conditions during the past couple of months. The lack of a temperature signal and favored above-normal precipitation across the Great Lakes during September favor drought improvement (D2) and removal (D1) across southern Wisconsin, northern Illinois, and eastern and northern (Upper Peninsula) Michigan. Farther west in Iowa and Minnesota, temperature and precipitation signals are either lacking or lean toward above-normal temperatures and/or below-normal precipitation, indicating drought persistence is likely, despite the increased potential for heavy precipitation across parts of the Upper Midwest over the next 7 days.
Forecast confidence for the Midwest Region is low-to-moderate.
The only drought in the Southeast Region resides along the Blue Ridge Mountains of Virginia and West Virginia, with some locations experiencing 6-12″ precipitation deficits since January 1, 2021. Last week’s passage of the remnants of Tropical Storm Fred has brought temporary relief, but more will be needed to completely alleviate conditions. However, an active precipitation pattern is favored through much of September, with equal chances of above-, near-, or below-normal for the remainder of the SON season. Additionally, the typical reduction in evapotranspiration rates during the Fall and the threat of potential tropical activity associated with the climatological peak of the Atlantic Hurricane season, removal of drought is favored for areas experiencing D1 (moderate drought) in Virginia.
Forecast confidence is high for the Southeastern Region.
In the Northeast Region, drought is restricted to Cape Cod interior, northern parts of New England, and extreme northeastern New York, with some locations in northern New England experiencing nearly 20″ water-year-to-date precipitation deficits (per AHPS) going back to October 1, 2020. Despite favored above-normal temperatures throughout the SON season, equal chances for above-, near-, or below-normal to above-normal precipitation is favored for the Northeast as a whole, with above-normal chances more likely during September. Additionally, with the increased potential during the Fall for coastal lows and/or transitioning tropical cyclones, removal of moderate drought (D1) on Cape Cod is favored, with persistence elsewhere across the Northeast.
Forecast confidence is moderate-to-high for the Northeastern Region.
With improved conditions over the past couple of weeks and near to below-normal temperatures and near to above-normal precipitation favored in the extended range (through Week-2), drought removal is likely in Alaska before the Winter season takes hold. In Hawaii, drought conditions exist mainly on the leeward slopes. Near-normal temperatures are favored during the SON season for Hawaii and, in spite of increased potential for below-normal precipitation, drought persistence is likely, with no additional development. The recent passages of Tropical Storms Fred and Grace has led to improvements in the drought depiction in recent weeks. With the continued threat of an active Atlantic Hurricane season, drought removal is favored for the remaining D1 (moderate drought) areas in Puerto Rico.
Forecast confidence is high for Alaska and Puerto Rico, and moderate in Hawaii.
ENSO Considerations
Now let us look at the NOAA recent ENSO Update. This happens every month on the second Thursday. I show this because it is the information that NOAA works from in producing the Four-Season Forecast. We have covered some of this when we reported on the IRI/CPC analysis on August 12, 2021. We may discuss it again when we do the NOAA/JAMSTEC Comparison.
ENSO UPDATE


But then August 19 comes around and CPC/IRI decides to publish again.

Below is a NOAA graphic that is not part of the release of information by NOAA when they discuss ENSO. My interpretation of this graphic is that we are NOT in La Nina right now. It is a cross-section of the Equatorial Pacific. What counts is the surface temperature and this only shows the Equator and the actual calculation is based on the temperature anomaly from 170W to 120W but inducing 5 degrees north and south of the Equator. I have a different graphic that shows that but this one is probably more accurate for the area shown. The water is anomalously cold east of 100W. But west of 150W it is certainly not as cold as -0.5C. So we are definitely in ENSO Neutral the question being what is next and when will there be a change.
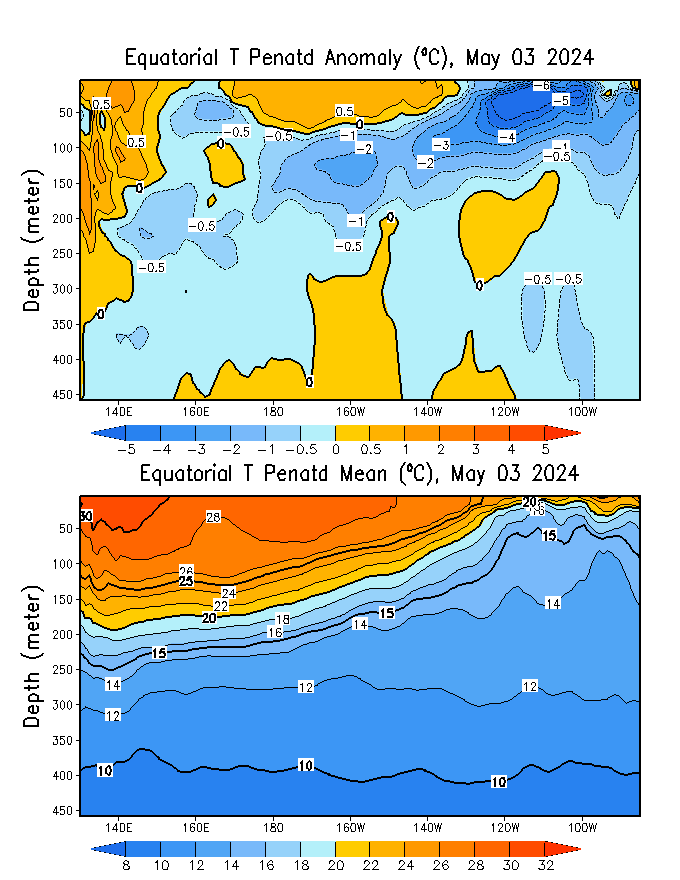
But now I freeze the graphic and focus on the top part which shows the temperature anomalies.

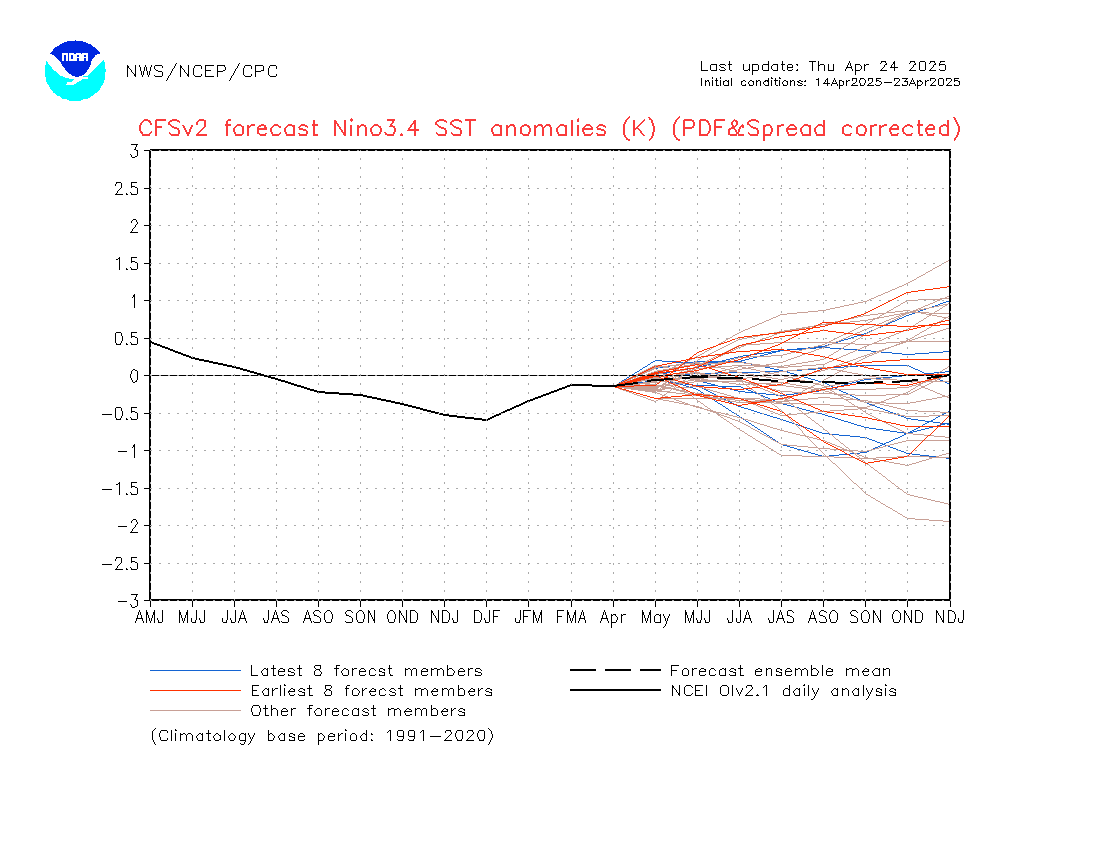

The Southern Oscillation Index or SOI being above 7 confirms that the Atmosphere is in tune with the Sea Surface Temperatures in the Pacific along the Equator. At least temporarily the SOI Index is in neutral territory. This is another graphic that we have not frozen.

Here is the BOM (Australia Bureau of Meteorology) Nino3.4 tracker.

Here is their current forecast.

B. Conclusion
From the perspective of NOAA, we not in a La Nina but may be soon. There is an issue as whether we will be in La Nina or not, whether we will almost be in La Nina or actually be in La Nina, how intense it might be and how long we remain in that La Nina condition if we indeed enter that condition. The tools NOAA uses to forecast the state of ENSO has introduced the concept of a possible double-dip La Nina. That is not unusual. It appears very likely that this will be either a marginal La Nina or a near La Nina. It should be less intense than last winter.
Special Appendix


Play for fun and to increase your knowledge of the North American Monsoon (NAM). But there are prizes: two of them actually


