econintersect.com
  • 토토사이트
    • 카지노사이트
    • 도박사이트
    • 룰렛 사이트
    • 라이브카지노
    • 바카라사이트
    • 안전카지노
  • 경제
  • 파이낸스
  • 정치
  • 투자
No Result
View All Result
  • 토토사이트
    • 카지노사이트
    • 도박사이트
    • 룰렛 사이트
    • 라이브카지노
    • 바카라사이트
    • 안전카지노
  • 경제
  • 파이낸스
  • 정치
  • 투자
No Result
View All Result
econintersect.com
No Result
View All Result
Home Uncategorized

May 22, 2021 Seasonal Forecasts: Part II, NOAA Comparison with JAMSTEC

admin by admin
9월 6, 2021
in Uncategorized
0
0
SHARES
0
VIEWS

Written by Sig Silber

We published the NOAA Long-Term Forecast Part I on May 20, 2021. Tonight we compare the NOAA forecast for Alaska and CONUS with the JAMSTEC forecast. It is easier to see the agreement and disagreement by comparing the maps which we show side by side in a table with a summary of the comparison. Obviously, the farther out you look, the less confidence you have in the forecasts and thus the differences in the forecasts. Also provided are the JAMSTEC World Forecasts. JAMSTEC has sent us their forecast privately as their website is still not functional and what they have sent us includes a monthly forecast for each of the first three months so we are also able to compare the NOAA and JAMSTEC June forecasts this time. As usual, there are some significant differences between the two forecasts but also a lot of agreement.

NOAA v. JAMSTEC


Please share this article – Go to the very top of the page, right-hand side for social media buttons. Please feel free to send this article to anyone who you think might find it interesting and or useful.


C. Comparison of the NOAA and JAMSTEC Forecasts

Below is the comparison of the NOAA and JAMSTEC temperature and precipitation forecast maps for the month of June and then three time-periods and from left to right the NOAA forecast for Alaska and CONUS (the contiguous mid-latitude U.S) and then JAMSTEC for North America (which includes Canada and part of Mexico). The NOAA forecast maps can be clicked on to enlarge. The JAMSTEC maps in the table are not set up to be clicked on to enlarge (because we do not have a larger version of them). We have concluded that these smaller images work fine for comparison purposes.  Later in the article, we show the World Forecasts.

JAMSTEC works only with three-month seasons: Summer JJA, Fall SON, and Winter DJF. Out of each three months, there is one where the months in the two forecasts align perfectly for the first time period. This is one of those months so for the first period we are comparing JJA for both JAMSTEC and NOAA. But we also have a separate June forecast from JAMSTEC. We have not usually had a single-month JAMSTEC forecast. I gather they make them but do not show them on their website. But they sent me two documents one containing the seasonal forecasts and one containing three monthly forecasts. So even though we are comparing seasonal forecasts starting with JJA, we are also able tonight to compare the June forecasts.

JAMSTEC is currently running a somewhat simplified version of their updated model. It is based on a 36 member ensemble, not 100, (apparently this version of the model was described in an article Doi et al. 2017, J. Climate). But they are using the new features which we had also been using in recent articles where we compared the two forecasts. One of the new features is a model of the temperature of the oceans by layers at various depths. This probably helps to incorporate the changing phases of ENSO into the forecast.

In addition to the value of comparing the JAMSTEC and NOAA forecasts, the JAMSTEC forecast by showing North America provides more context for the Alaska and CONUS Forecasts as the temperature and precipitation patterns cover North America, not just Alaska and CONUS.

Map Comparisons and our Comments

Temperature*

 NOAA Alaska Plus CONUSJAMSTEC North America

June

2021

https://www.cpc.ncep.noaa.gov/products/predictions/long_range/lead14/off14_temp.gif

Summer

JJA 2021

https://www.cpc.ncep.noaa.gov/products/predictions/long_range/lead01/off01_temp.gif

Fall

SON 2021

Winter

DJF 2021/2022

For June: NOAA shows a large EC anomaly where JAMSTEC shows the heart of the warm anomaly. So that is an area of disagreement.
For Summer: The JAMSTEC forecast for JJA is similar to their forecast for June. NOAA relocates their EC anomaly to the north as compared to their June forecast. They both are more aggressive with the warm anomaly for Alaska.
For Fall: There is a lot of agreement in Fall.
For Winter: NOAA shows a large EC area which JAMSTEC does not show it to be EC (except for a small part of the extreme Northwest). But JAMSTEC agrees with NOAA for Alaska and shows an overall cooler Western Canada. So the difference is one of degree.

Precipitation*

 NOAA Alaska Plus CONUSJAMSTEC North America

June

2021

https://www.cpc.ncep.noaa.gov/products/predictions/long_range/lead14/off14_prcp.gif
 

Summer

JJA 2021


Fall

SON 2021

Winter

DJF 2021/2022

https://www.cpc.ncep.noaa.gov/products/predictions/long_range/lead08/off08_prcp.gif
For June: It is not total disagreement. But NOAA shows an Eastern wet anomaly. The dry anomaly they both show for JAMSTEC extends into the Great Plains and for NOAA it trends into the Northwest.  So the forecasts for June are substantially but not totally different.    
For Summer: They both show a failed North American Monsoon. The differences noted for June to a large extent are the differences shown for the three-month period of JJA.
For Fall: NOAA again shows an eastern wet anomaly but it is smaller. JAMSTEC shows somewhat of a dry anomaly in that area. They agree more on the location of the dry anomaly but JAMSTEC favors the Great Plains to some extent while the NOAA dry anomaly is more south to north and the two focal points of the dry anomaly are substantially different. JAMSTEC shows a wetter Alaska and a dry Alaskan Panhandle.
For Winter: JAMSTEC shows the Southwest dry anomaly continuing but smaller in extent. Both show a Northern Tier wet anomaly but for NOAA it is focused on the North Central states and for JAMSTEC it is focused on the Northwest and the Northeast.

* It is important to keep in mind that NOAA reports probabilities of being warmer or cooler than Climatology and JAMSTEC reports the degrees of temperature and millimeters of precipitation variation from Climatology (Normal). So they are not exactly comparable. Also please keep in mind that NOAA is now using a redefinition of Climatology which is the mean of the most recent three decades of weather namely 1991 to 2020. We do not believe that JAMSTEC has updated their definition of Climatology since the date of their forecast is May 1 which is prior to the time that NOAA did their update and there has been no announcement from JAMSTEC that they have updated their Climate Normals. This makes the comparisons more difficult. Where appropriate, we comment on this when discussing the comparison. 

JAMSTEC World Forecasts

This month our comments for Summer and Fall (Northern Hemisphere Seasons) are taken directly from the JAMSTEC discussion. We do not have a JAMSTEC discussion for the June forecast.

June 2021

Temperature
http://www.jamstec.go.jp/aplinfo/sintexf/2017/forecast/temp2.glob.SON2020.1jul2020.F23DVAR.gif
Precipitation
http://www.jamstec.go.jp/aplinfo/sintexf/2017/forecast/temp2.glob.SON2020.1jul2020.F23DVAR.gif
We do not have a JAMSTEC interpretation of their June forecast except for Japan where they say “Monthly prediction suggests an active rainy season (Baiu) in June.”

Summer which is JJA 2021

Temperature
http://www.jamstec.go.jp/aplinfo/sintexf/2017/forecast/temp2.glob.SON2020.1jul2020.F23DVAR.gif
Precipitation
http://www.jamstec.go.jp/aplinfo/sintexf/2017/forecast/temp2.glob.SON2020.1jul2020.F23DVAR.gif
JAMSTEC says: “On a seasonal scale, the SINTEX-F predicts that most part of the globe will experience a hotter-than-normal condition in boreal summer (austral winter) except for northern part of the South American Continent and some parts of Northern Europe. As regards to the seasonally averaged rainfall in boreal summer (austral winter), a drier-than-normal condition is predicted for central/eastern U.S.A., southern part of the South American Continent, some parts of the Eurasian Continent, and Gabon. In contrast, Mexico, northern part of the South American Continent, Philippines, some parts of Indonesia, some parts of West Africa, northern part of the Eurasian Continent, some parts of the Indochina Peninsula, eastern China, and the Korean Peninsula will experience a wetter-than-normal condition. The model predicts most part of Japan will experience a hotter-than-normal condition in summer as a seasonal average. As regards to the seasonally averaged rainfall, most part of Japan will experience a slightly wetter-than-normal condition in summer as a seasonal average.

Fall which is SON 2021

http://www.jamstec.go.jp/aplinfo/sintexf/2017/forecast/temp2.glob.DJF2021.1jul2020.F23DVAR.gif
Precipitation
http://www.jamstec.go.jp/aplinfo/sintexf/2017/forecast/temp2.glob.DJF2021.1jul2020.F23DVAR.gif“
JAMSTEC says: “On a seasonal scale, the SINTEX-F predicts that In boreal autumn (austral spring), the model still predicts most part of the globe will experience a warmer-than-normal condition, except for northern part of the South American Continent, some parts of northern Africa, and Ukraine. As regards to the seasonally averaged rainfall,  in boreal autumn (austral spring), a wetter-than-normal condition is predicted for the South American Continent, central Africa, India, Philippines, and Indonesia. In contrast, most part of U.S.A., La Plata Basin, some parts of West Africa, and some parts of China will experience a drier-than-normal condition. The model predicts most part of Japan will experience a hotter-than-normal condition in autumn as a seasonal average. As regards to the seasonally averaged rainfall, most part of Japan will experience a slightly wetter-than-normal condition in autumn as a seasonal average.

And Winter 2021/2022 which is DJF

Temperature
http://www.jamstec.go.jp/aplinfo/sintexf/2017/forecast/temp2.glob.MAM2021.1jul2020.F23DVAR.gif
Precipitation
http://www.jamstec.go.jp/aplinfo/sintexf/2017/forecast/temp2.glob.MAM2021.1jul2020.F23DVAR.gif
JAMSTEC  does not comment on the third period in their discussion. We assume this represents the lower level of confidence that far out. But you can see what it shows on the maps. You can see that Europe and the Nothern Tier of Asia is warm as is Australia. The British Isles and Scandinavia are wet and much of South America is wet. The Mediterranean area is dry. 

Here is the JAMSTEC Discussion

We provided the full JAMSTEC Discussion in Part I. We repeat it here.

ENSO forecast:

As predicted earlier, observation shows that the La Niña Modoki-like state decayed from boreal spring. The SINTEX-F predicts that a neutral state will persist in this year.

Indian Ocean forecast:

Observation shows that the western tropical Indian Ocean is warmer-than-normal. The SINTEX-F predicts that the present state will persist in boreal summer and autumn. However, there is a large uncertainty in the prediction.

Regional forecast:

On a seasonal scale, the SINTEX-F predicts that most part of the globe will experience a hotter-than-normal condition in boreal summer (austral winter) except for northern part of the South American Continent and some parts of Northern Europe. In boreal autumn (austral spring), the model still predicts most part of the globe will experience a warmer-than-normal condition, except for northern part of the South American Continent, some parts of northern Africa, and Ukraine.

As regards to the seasonally averaged rainfall in boreal summer (austral winter), a drier-than-normal condition is predicted for central/eastern U.S.A., southern part of the South American Continent, some parts of the Eurasian Continent, and Gabon.

In contrast, Mexico, northern part of the South American Continent, Philippines, some parts of Indonesia, some parts of West Africa, northern part of the Eurasian Continent, some parts of the Indochina Peninsula, eastern China, and the Korean Peninsula will experience a wetter-than-normal condition. In boreal autumn (austral spring), a wetter-than-normal condition is predicted for the South American Continent, central Africa, India, Philippines, and Indonesia. In contrast, most part of U.S.A., La Plata Basin, some parts of West Africa, and some parts of China will experience a drier-than-normal condition.

The model predicts most part of Japan will experience a hotter-than-normal condition in summer and autumn as a seasonal average. As regards to the seasonally averaged rainfall, most part of Japan will experience a slightly wetter-than-normal condition in summer and autumn as a seasonal average. Monthly prediction suggests an active rainy season (Baiu) in June.

D. Conclusion

As usual, there is a disagreement between NOAA and JAMSTEC. The differences are substantial this month but perhaps less substantial than usual.

It is difficult to relate the differences in the forecast to differences in assumptions on ENSO. But JAMSTEC tends to consider other factors that may not be considered by NOAA. On the other hand, the new versions of the JAMSTEC model are early in their usage and may not have been fully calibrated. I do not think I have gone into it in detail but when it comes to models we need to recognize that there are limitations and NOAA and JAMSTEC use very different approaches which I have summarized in the below table.

 Shorter TermIntermediate-Term
NOAADeterministicStatistical
JAMSTECDeterministicDeterministic (may also use statistical methods)
AssessmentGenerally Considered to be reliable for 14 to 28 daysErrors build up in deterministic models and statistical models generally have insufficient historical data to be reliable

So it is kind of a pick your poison choice. But both agencies have great skill at employing approaches that have inherent limitations.

E. Additional Information

ENSO Phase

We showed some of this information in Part A on May 20, 2021. I am repeating it with some additions here.

Let us look at the NOAA recent ENSO Update. This happens every month on the second Thursday. I show this because it is the information that NOAA works from in producing the Four-Season Forecast.

Below is the probability analysis from mid-April and the probability analysis released on May 13, 2021

The probability distribution on the left is based on a survey of meteorologists and the probability on the right is based on model results. It is a pretty big change.

With respect to forecasts, this is interesting

It comes from the article written by Emily Becker and some may find that article very interesting. That forecast suggests a return of La Nina for next winter. This time of the year is not the best time to make predictions but the so-called Spring Prediction Barrier SPB applies more to predicting El Nino than predicting La Nina.

May 2021 ENSO update: bye for now, La Niña! Click to read

Here is the NOAA proprietary forecast which they rarely use.

CFSv2 spread and bias correct ENSO forecast

Again, I am allowing this model to update and it clearly indicates that we are not in a La Nina but may return to or close to La Nina conditions later this year.

 Here are the two JAMSTEC ENSO forecasts.

There is a lot of scatter but the ensemble mean is basically ENSO Neutral. I do not know what the F2si model is. The si might refer to the International System of Units. There is a lot of range in these estimates.

 When it differs from the Nino 3.4 forecast, the JAMSEC Modoki forecast becomes very important.

This is an Index for a  phenomenon that was first formally recognized by JAMSTEC. Early on in this just ended La Nina, this index was recording lower values than the Nino 3.4 Index. It still is. But I do not know what it means when the NINO 3.4 Index is Neutral and the Modoki Index is also Neutral but with a La Nina bias (negative but not -0.5C negative). They are showing a lot of different model runs in this graphic and I do not know what F2 si is. They did not mention this in their short discussion. I will try to find that out.

Sea Surface Temperature anomalies is probably the more important criteria for ENSO but the atmospheric response is also important and if the two do not agree, it is not possible to draw a conclusion that we are in an El Nino or La Nina state. After all, we are mostly interested in the atmosphere. Historically the Southern Oscillation Index has been what is relied on to measure the atmospheric response. Although it might not be the best index, the Australian SOI Index is what is generally most relied on. 

http://www.bom.gov.au/climate/enso/monitoring/soi30.png

The Southern Oscillation Index or SOI being above 7 combined with the Nino 3.4 Index under -0.5 would confirm that the Atmosphere is in tune with the Sea Surface Temperatures in the Pacific along the Equator. At least temporarily the SOI Index is (barely) in neutral territory and is not confirming a La Nina but is sort of confirming ENSO Neutral. This is another graphic that we have not frozen.

The above is the Australian Bureau of Meteorology SOI Index. Some believe this index is out of date since it was developed when it was convenient to measure things on land and the two measurement points in this index are on land and not directly on the Equator. NOAA has their own index that uses two points right on the Equator. Some studies show that the slope of the curve (first derivative) may be as important as the absolute value of the index.

Let us look at the part of the Pacific along the Equator from the surface down to 450 meters.

This is a NOAA graphic but not part of the release of information on May 13, 2021. My interpretation of this graphic is that we are NOT in La Nina right now. It is a cross-section of the Equatorial Pacific. What counts is the surface temperature and this only shows the Equator and the actual calculation is based on the temperature anomaly from 170W to 120W but inducing 5 degrees north and south of the Equator. I have a different graphic that shows that but this one is probably more accurate for the area shown. The water is anomalously cold east of 100W. But west of 120W it is certainly not as cold as -0.5C but the anomalies are negative but mostly not as large as -0.5C. But it is close.

Below is the graphic above but also one issued last month. (I believe these images are five-day averages centered on the date shown.)

Prior VersionUpdated Version

You can see the change.

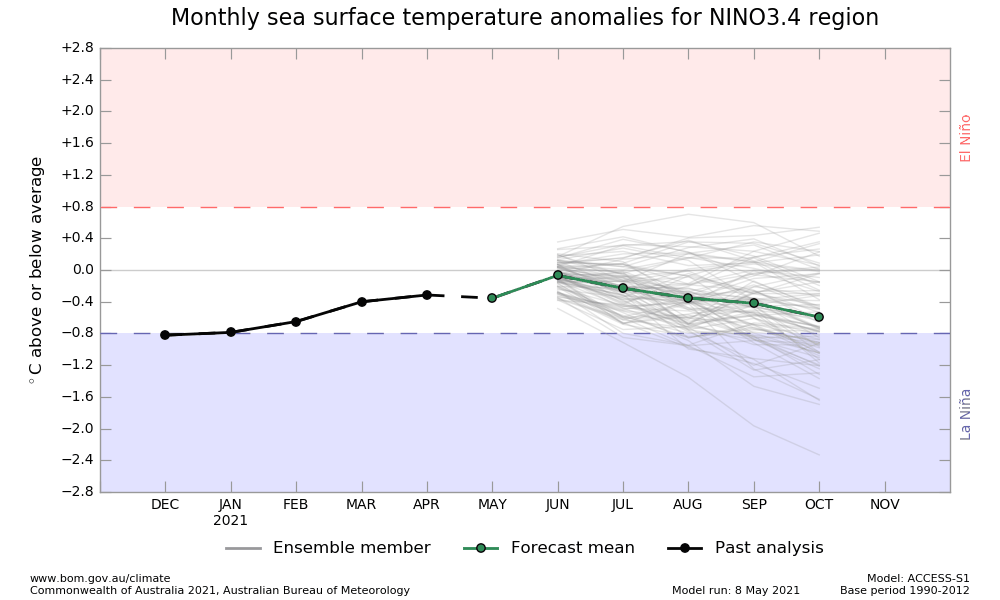
Here is the BOM Nino3.4 tracker.

BOM Nino 3.4

It shows we are not in a La Nina. I have not frozen this graphic so it will update in the article.

Here is the BOM current forecast and I will let this graphic auto-update also. But it only updates every two weeks. But today is two weeks since May 8 and given the difference in time zones I am surprised that this graphic has not yet updated. After it updates I will freeze it so that this article will make more sense if read sometime in the future.

NINO3.4 SST plume graphs from ACCESS-S forecasts, updated daily

Their criteria are stricter than what is used by NOAA. But even with the NOAA criteria, Australia would conclude that we were not now in a La Nina. But looking out to October it gets interesting.

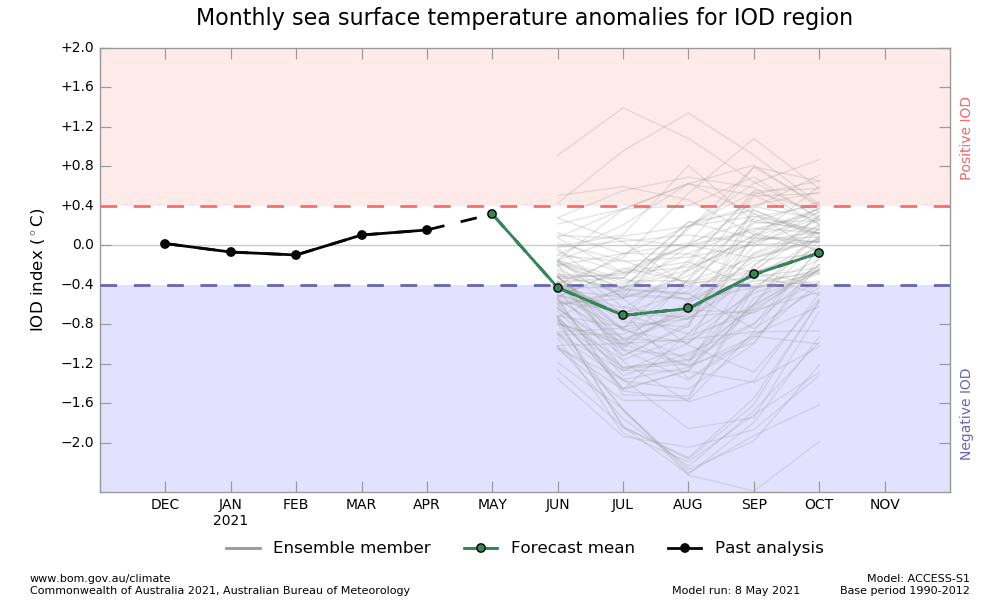
This is the IOD which is very important for the Indian Ocean. It is projected by JAMSTEC to be difficult to forecast through October.

I am not discussing the possible impact on nations bordering on the Indian Ocean because the Index is mostly Neutral.

Here is the BOM Forecast for the same Index.

IOD SST plume graphs from ACCESS-S forecasts, updated daily

Again I am allowing this index to update since it is scheduled to do so soon (as in yesterday). After it updates I will freeze it so that this article will make more sense if read in the future.
This model is suggesting a negative IOD for a few months and BOM so far seems to be saying to ignore it. It will be helpful when and if this graphic updates.

F. Postscript.

The coordination between NOAA and IRI/CPC sucks to use a word that is fully descriptive of the situation.

NOAA issues their Seasonal Outlook on May 20 at the crack of dawn and IRI/CPC issued their second report of the month the day before on May 19. It is clear (by reading the NOAA Discussion) that NOAA did not utilize the second report from IRI/CPC and the methodology of the second report is different from the methodology of the first report of the month. So one wonders what gives? Is IRI/CPC trying to discredit NOAA or create confusion? This has been an ongoing problem and probably someone needs to be fired.

It is not that what they publish is not of interest. It is of great interest. And here it is:

This strongly suggests that there will not be a return to La Nina conditions in 2021.

And also

This also suggests that there will not be a return to La Nina. The red, green and blue lines are of most interest. The blue line which reflects the CPC models is basically the fly in the ointment and the prior version of this graphic also showed it to be the outlier re predicting a return to La Nina. Some of the descriptive material is very confusing. To me, it does not look like sufficient care is being taken in the compilation of this information.


This one is clear that the most likely situation is ENSO Neutral. Both El Nino and La Nina are equally likely at what appears to be the 25% level. You put that together and you end up with 50% ENSO Neutral and 25% for each of La Nina and El Nino.

 We will know more on June 10, 2021 which is when we get the next formal NOAA ENSO Update. .

Previous Post

Seven Modern Philosophers To Help Us Build A Better World After The Pandemic

Next Post

Can ‘Vaccinated’ Breast Milk Protect Kids? The Science Is Hazy.

Related Posts

Scammers Steal $300K Using Fake Blur Airdrop Websites
Uncategorized

FBI Warns Investors Of Crypto-Stealing Play-to-Earn Games

by admin
Maersk Almost Completing Russia Exit After The Sale Of Logistics Sites
Uncategorized

Maersk Almost Completing Russia Exit After The Sale Of Logistics Sites

by admin
Why Is ‘Staking’ At The Center Of Crypto’s Latest Regulation Scuffle
Uncategorized

Why Is ‘Staking’ At The Center Of Crypto’s Latest Regulation Scuffle

by admin
Mexico's Pemex Dismantled Resources Worth $342M From Two Top Fields
Uncategorized

Mexico’s Pemex Dismantled Resources Worth $342M From Two Top Fields

by admin
Oil Giant Schlumberger Rebrands Itself As SLB For Low-Carbon Future
Uncategorized

Oil Giant Schlumberger Rebrands Itself As SLB For Low-Carbon Future

by admin
Next Post
Final August 2021 Michigan Consumer Sentiment Shows A Stunning Loss Of Confidence

Final August 2021 Michigan Consumer Sentiment Shows A Stunning Loss Of Confidence

답글 남기기 응답 취소

이메일 주소는 공개되지 않습니다. 필수 필드는 *로 표시됩니다

Browse by Category

  • Business
  • Econ Intersect News
  • Economics
  • Finance
  • Politics
  • Uncategorized

Browse by Tags

adoption altcoins bank banking banks Binance Bitcoin Bitcoin market blockchain BTC BTC price business China crypto crypto adoption cryptocurrency crypto exchange crypto market crypto regulation decentralized finance DeFi Elon Musk ETH Ethereum Europe Federal Reserve finance FTX inflation investment market analysis Metaverse NFT nonfungible tokens oil market price analysis recession regulation Russia stock market technology Tesla the UK the US Twitter

Categories

  • Business
  • Econ Intersect News
  • Economics
  • Finance
  • Politics
  • Uncategorized

© Copyright 2024 EconIntersect

No Result
View All Result
  • 토토사이트
    • 카지노사이트
    • 도박사이트
    • 룰렛 사이트
    • 라이브카지노
    • 바카라사이트
    • 안전카지노
  • 경제
  • 파이낸스
  • 정치
  • 투자

© Copyright 2024 EconIntersect