Written by Sig Silber
Updated at 2:30 a.m. EDT August 10, 2019 to reflect the Update Week 3 – 4 Forecast which may not be favorable for the corn and soybean crop.
Tonight, we focus on corn and soybeans, as these two very important crops are in trouble. It is not clear if the weather will cooperate over the next four weeks. As usual, there is a report on the U.S. Drought Monitor which establishes the current situation and we include the comparison of last week to this week. CONUS is slowly becoming a bit more dry in some areas while the Pacific Islands have dramatically improved.

Please share this article – Go to the very top of the page, right-hand side, for social media buttons. Please feel free to send this article to anyone who you think might benefit from reading it.
New Format: Each week our Thursday night article will cover the Drought Monitor Report issued by NOAA in conjunction with the University of Nebraska – Lincoln and a summary of U.S. crop conditions. It provides a link to the Severe Weather Report (this will take two clicks since that report gets republished each day and so you click here to get to the Directory and then click again on the version of the Severe Weather Report closest to the top of the list. Soon we will have a link to a full weather report, not just severe weather. Each week, this article will have a different special feature. We have not worked that out yet but most likely those features might be: A. a more detailed look at the prior month’s crop progress B. a review of the prior month’s weather C. a review of the prior month’s International Weather D. Current conditions of rivers and reservoirs. E. Economic Impacts other than crop-related F. Other. Tonight Weather Forecast as it applies to corn and soybeans. The goal is to reduce the time needed to read the article and provide information each week that changes each week and provide information that changes more slowly on a monthly basis. Please provide feedback by completing the survey below on how you feel about the new format and what would make this article more useful to you. |
NEWS
ENSO Alert System Status: Final El Niño Advisory
Synopsis: El Niño has transitioned to ENSO-neutral, which is most likely to continue through Northern Hemisphere winter 2019-20 (50-55% chance).
During July, ENSO-neutral conditions were reflected by the combination of below-average sea surface temperatures (SSTs) in the eastern equatorial Pacific Ocean and above-average SSTs in the central Pacific. The latest weekly ENSO indices were +1.0°C, +0.5°C, -0.2°C and -0.5°C in the Niño-4, Niño-3.4, Niño-3 and Niño-1+2 regions, respectively. Upper-ocean subsurface temperatures (averaged across 180°-100°W) were near average throughout the month, as anomalously cool waters prevailed in the eastern Pacific and anomalously warm waters continued in the central Pacific. Suppressed tropical convection continued over Indonesia, while near-average convection was observed near the Date Line. Low-level wind anomalies were near average over the tropical Pacific Ocean, and upper-level winds were easterly over the east-central Pacific. The traditional and equatorial Southern Oscillation Indices remained slightly negative. Overall, oceanic and atmospheric conditions were consistent with a transition to ENSO-neutral.
The latest IRI/CPC plume of forecasts of the Niño-3.4 index favors ENSO-neutral (Niño-3.4 index between -0.5°C and +0.5°C), with index values greater than zero from late Northern Hemisphere summer into fall, warming closer to the El Niño threshold by winter. Atypically, dynamical models forecast weaker positive SST anomalies than statistical models throughout most of the forecast period. As a result, while forecasters favor ENSO-neutral conditions, the odds of El Niño (~30%) are roughly twice that of La Niña for next winter. In summary, El Niño has transitioned to ENSO-neutral, which is most likely to continue through Northern Hemisphere winter 2019-20 (50-55% chance; click CPC/IRI consensus forecast for the chance of each outcome for each 3-month period).
This discussion is a consolidated effort of the National Oceanic and Atmospheric Administration (NOAA), NOAA’s National Weather Service, and their funded institutions. Oceanic and atmospheric conditions are updated weekly on the Climate Prediction Center web site (El Niño/La Niña Current Conditions and Expert Discussions). Forecasts are also updated monthly in the Forecast Forum of CPCs Climate Diagnostics Bulletin. Additional perspectives and analysis are also available in an ENSO blog. The next ENSO Diagnostics Discussion is scheduled for 12 September 2019.
Corn and Soybeans the Two Crops in Most Trouble.
Where are they grown?


There are many factors that have led to the current situation but one is the amount of sunshine other causes of temperature and it has been inadequate.

Side by Side
|
|
And the forecast
First Temperature
|
|
|
|


And then Precipitation
|
|
|


And here is the discussion released with the Week 3 – 4 forecast:
Week 3-4 Forecast Discussion Valid Sat Aug 24 2019-Fri Sep 06 2019
The final El Nino advisory was issued on August 8th, signaling the demise of the event that has lasted since boreal autumn. The current subseasonal state in the Pacific looks decidedly unlike El Nino, given an ongoing surge in the trade winds east of the antimeridian in association with the suppressed phase of an equatorial Rossby wave. This easterly surge also appears to be projecting onto the RMM index, yielding the appearance of the Madden-Julian Oscillation (MJO) being over the Maritime Continent, although there is no supporting evidence as such. In light of the lack of tropical variability to influence the forecast, dynamical model guidance is the primary basis of this Weeks 3 and 4 outlook, with some deference to decadal trends.
Despite expectations during boreal summer for modest 500-hPa anomalies, ensemble guidance features an amplified circulation highlighted by anomalous ridging over the Northeast Pacific. Other features of note are enhanced subtropical ridging across the Southeast and anomalous troughing in the vicinity of Hudson Bay. The outlier among ensemble guidance is the JMA model, with the Pacific ridging displaced westward while anomalous ridging is focused over the Great Lakes.
The resulting temperature outlook features increased odds for above-normal temperatures across the majority of the country, while below-normal temperatures are favored from the northern High Plains south-southeastward through the Central Plains. Above-normal temperature chances are greatest across Alaska (forecast ridging in the Pacific, anomalously warm adjacent sea surface temperatures, and robust decadal trends), West Coast (ridging in the Pacific), and much of the South in addition to up the Eastern Seaboard (enhanced subtropical ridge).
Above-median precipitation chances across the CONUS are increased from the northern High Plains southeastward through the Central Plains where a mean baroclinic zone and associated shortwave energy are implied. This area then extends northeastward through the Great Lakes and interior Northeast where the enhanced subtropical ridge would support further above-normal rains. Elevated below-normal precipitation chances are forecast across the Southeast, which is always tenuous as the peak of Atlantic Hurricane Season approaches, although the enhanced subtropical ridge would support this while dynamical model guidance shows widespread dryness across the Caribbean and main development region in the Atlantic. Below-normal precipitation odds are also elevated for the Pacific Northwest with the forecast ridging in the Pacific, with model guidance supporting a southeastward extension of this area through the Rio Grande. Climatologically arid areas, coupled with model guidance suggesting an active East Pacific in terms of tropical cyclone activity over the next several weeks that could help moisten up the Southwest, result in equal chances across much of California, Nevada, and Arizona. A precipitation dipole aligned with topography is favored across Alaska with above-normal rains for southern parts of the state and things drying out to the north.
Sea surface temperatures remain 1-2 degrees C above climatology around Hawaii supporting above-normal temperatures being favored across the islands. Continued above-normal temperatures being observed for Hawaii is further supported by all 78 members of the Subseasonal Experiment falling into the above-normal category, while observations show not a single 14 day period of below-normal temperatures being observed at any of the four stations during the past 90 days. Dynamical model guidance supports a likely gradient in precipitation chances across the islands, with slightly elevated odds for above-normal precipitation in the west tapering to weakly favoring below-normal further east.
Current Drought Conditions
Now we take a look at Thursday’s U.S. Drought Monitor Report.
The U.S. Drought Monitor is a comprehensive way of understanding the drought situation for the U.S. It is issued every Thursday and reflects the conditions as of the prior Tuesday. Drought is defined as a moisture deficit bad enough to have social, environmental or economic effects. Thus, more factors than recent precipitation are considered and more information on how it is done is found at the end of this report.

U.S. Affiliated Pacific Islands and the U.S. Virgin Islands.

Below is the map for just CONUS.
 |
 |
| Last Week | This Week |
| |

Some might find this animation of twelve weeks of change useful;

The graphic below shows the one-week change in drought intensity. Yellow is bad. Green is good.
|

Now we show the week to week change information by region. The yellow is where the drought has been upgraded. The green is where the level of drought has been downgraded.
 |
I again see five states with deterioration |
 |
| Again widespread deterioration. But it is mostly at the same latitude impacting Iowa, Illinois, Indiana, Ohio and Kentucky. |
 |
| Scattered small areas but we have not seen dry conditions here for a while. |
 |
| Significant deterioration in Texas and Oklahoma and some deterioration in Louisiana. |
 |
| Here is it mixed but more improvement than deterioration. |
 |
Deterioration in the Northwest but we also see dry conditions returning to New Mexico and a bit to Colorado. It will be worse next week or soon thereafter based on the forecast. |
Let’s not forget Alaska


Here is the Discussion that was issued with the Drought Report.
This Week’s Drought Summary
Heavy rain fell on large parts of Alaska this past week, bringing significant short-term relief, including an end to large fire development and expansion, at least for the time being. In contrast, dryness and drought expanded across broad sections of the contiguous 48 states, with relief restricted to parts of the Southeast. Most notably, hot and dry weather brought significant D0 expansion in the southern half of the Great Plains and across the Midwest and lower Ohio Valley. In the Northeast Climate Region, a few abnormally dry areas were introduced; this is only the fourth week since mid-January that dryness existed in any part of the Region. Meanwhile, heavy rain in eastern Puerto Rico improved conditions over eastern parts of the Commonwealth.
Northeast
A broken pattern of moderate to locally heavy rain (up to 3 inches) affected the region this week, primarily from southern New York through Pennsylvania and eastern West Virginia. Over the past month, rainfall totals were 2.0 to 3.5 inches below normal in a few scattered areas in western West Virginia, southwestern New England, upstate New York, and lower Maine, prompting D0 introduction in those areas. In southwestern New England, upstate New York, and part of southwestern West Virginia, totals are 2 to locally 6 inches below normal since early June.
Southeast
Precipitation varied markedly across the region, which is typical for summer. Generally, heavy rain fell around the periphery of the dry areas in Alabama, much of Georgia, and northern South Carolina, leading to some reduction in D0 to D2 coverage. D0 was removed entirely from southeasternmost Georgia and northeastern Florida. In contrast, areas that missed most of the rain experienced limited deterioration. Small-scale expansion of D0 and D1 was noted in south-central and eastern Georgia, and southern South Carolina. In most dry areas, the last 60 days brought 2 to locally over 6 fewer inches of rain than normal, and 50 to 75 percent of normal during the past month.
South
Another drier-than-normal week affected central and eastern sections of Texas and Oklahoma as well as the northern tier of Louisiana, where little or no rain was reported. Recent hot and dry weather there has spawned broad development of D0 and D1 conditions in the south-central Plains, with severe drought introduced in southwestern Oklahoma and adjacent Texas. Broad swaths of central and western Oklahoma, the Texas Panhandle, and southwestern Texas recorded only a few tenths of an inch of rain at best over the last 30 days, and about 25 to 60 percent of normal since early June.
Midwest
Generally 0.5 to 2.0 inches of rain fell last week on central and southern Wisconsin, but most of the region recorded only a few tenths of an inch, if any. The last 30 days brought only 10 to 50 percent of normal rainfall to most areas from central Iowa through east-central Illinois and part of western Indiana, with the largest deficits affecting a swath from east-central Iowa southeastward through central Illinois. Abnormal dryness was expanded extensively to cover this region, plus sections of southwestern Ohio, northeastern Kentucky, and southern Indiana, where rainfall has been slightly more generous. Since early June, 40 to 75 percent of normal rain has been recorded in central and eastern Iowa and adjacent Illinois. Farther north and west, patches of D0 persisted in and near the Upper Peninsula of Michigan, northeastern Minnesota, and southeastern Michigan. No drought exists in the region at this time, though aforementioned sections of Iowa and Illinois are approaching D1.
High Plains
It was a dry week in and near existing areas of dryness and drought. Broad expansion of abnormal dryness occurred across central and southern Kansas, where conditions have deteriorated quickly as in Oklahoma and Texas. Much of central and south-central Kansas received 0.5 inch or less of rainfall over the last 30 days. In the rest of the region, D0 and D1 conditions generally persisted, with very limited expansion brought into parts of northern North Dakota, east-central Nebraska, and southeastern Colorado.
West
Severe drought persisted in portions of northwestern Washington where only 40 to 75 percent of normal precipitation fell during the past six months. Light to locally moderate rain fell this week from central Arizona through central New Mexico, and across portions of southern and eastern Montana. Other areas recorded very little or none. Increasing moisture deficits induced moderate drought expansion into northwestern New Mexico while D0 expanded in southeastern Washington and across northern Montana. Conditions were unchanged in other areas. The past 60 days brought only 25 to 50 percent of normal rainfall to the new moderate drought area in northwestern New Mexico.
Alaska, Hawaii, and Puerto Rico
Heavy precipitation and cooler temperatures brought widespread improvement to central and northern Alaska, squelching wildfire expansion and sharply reducing the threat of new fire development, at least for the time being. Areas from the easternmost Seward Peninsula eastward through the central Yukon Valley recorded 2 to 5 inches of precipitation, with the heaviest amounts found along the northern tier of the Koyukuk National Wildlife Refuge and at an isolated site in the central Yukon Valley. Generally 0.5 to 2.0 inches of rain doused most other parts of the state’s western tier, and from the Yukon River through the northern Alaska Range. Most D0 and D1 areas improved in these regions, with moderate drought remaining over the Yukon Flats, where precipitation was less generous. Farther south, light precipitation left dryness and drought unchanged in southern Alaska.
Heavy rains in eastern Puerto Rico removed D0 from most areas, and trimmed areas of moderate drought there. Rainfall was closer to normal over the rest of the Commonwealth, leaving D0 to D2 areas essentially unchanged across central and southwestern areas.
Heavy precipitation brought an end to D0 and D1 conditions across central sections of the Big Island, but conditions were unchanged or deteriorated elsewhere. D0 expanded through the central Hawaiian Island, and parched areas in the extreme northern parts of the Big Island degraded to D3.
Pacific Islands
The weather pattern during this USDM week (7/31/19-8/6/19) was dominated by a monsoon trough across western to central Micronesia and trade-wind disturbances over eastern Micronesia. The monsoon flow and low-level convergence over western Micronesia were enhanced by tropical storms (09W/Francisco, 10W/Lekima) that developed north or northwest of the region, along with a circulation (Invest 95W) that developed over the Marianas late in the week; 95W became a tropical depression (11W) just as the week ended. The monsoon precipitation shifted to the north as the week progressed. In the east, a surface trough interacted with an upper-level trough over Kosrae State and the Marshall Islands (RMI). South of the equator, a surface trough stayed north of the Samoan Islands while a high pressure ridge dominated the weather over American Samoa.
Satellite-based estimates of 7-day precipitation (QPE) showed a large band of 4+ inches of precipitation stretching from west of the Marianas, across Guam and the Marianas, southeastward to Chuuk State, associated with tropical systems and the monsoon trough. Bands of 2+ inches of rain surrounded this area and stretched into Yap State and Palau on the west and Pohnpei State on the east. Areas of 2+ inches of rain could be seen on the QPE over Kosrae State and the RMI. South of the equator, a band of 1-4+ inches of rain was indicated north of the Samoan Islands, but little to no precipitation was seen on the QPE over American Samoa.
Drought free (D-Nothing) conditions persist this week in the Marianas since it was an extremely wet week with all three stations receiving over twice the monthly threshold of 4 inches to meet most water needs in just one week. Saipan had the most rainfall at 11.58 inches, followed by Guam at 10.89 inches and Rota at 10.37 inches.
Palau had 2.50 inches of rain this week, which is more than 2 inches weekly threshold to meet most water needs. Drought free (D-Nothing) conditions continue in Palau.
Most of the FSM had a wet week, with rainfall totals surpassing the 2 inches weekly minimum to meet most water needs. Fananu had the highest rainfall total at 8.93 inches, which is more than four times the weekly threshold. This week Fananu’s drought classification was changed from abnormally dry (D0-S) to drought free (D-Nothing) conditions. The rest of FSM was also drought free (D-Nothing). Yap was the only station that had less than the required 2-inches of rain to meet most water needs at 0.54 inch (with 3 days of missing data). However, since the previous week was a wet week, drought free conditions continue in Yap.
Four (Kwajalein, Majuro, Utirik and Wotje) of seven stations in the Marshalls had rainfall totals that surpassed the 2-inch weekly threshold. Wotje had the most rainfall amount at 5.03 inches, leading to a one-category drought improvement from severe drought (D2-SL) to moderate drought (D1-SL). Utirik’s drought was also improved, from extreme drought (D3-SL) to severe drought (D2-SL), as beneficial rains fell this week. Majuro’s weekly rainfall total of 4.02 inches helped bring reservoir levels to 78% of the maximum of 36 million gallons, which is close to the critical 80% threshold. For this reason, Majuro’s drought classification was also improved from moderate drought (D1-S) to abnormally dry (D0-S) conditions. Although Kwajalein had a wet week (2.34 inches), the last four weeks have been dry. For now, severe drought (D2-S) remains unchanged for Kwajalein. Jaluit (1.54 inches) and Mili (1.44 inches) had rainfall totals that were less than the 2-inches threshold. Their drought status remain unchanged as severe drought (D2-S) for Jaluit and drought free (D-Nothing) for Mili. Ailinglapalap had the least rainfall total at 1.15 inches. Abnormally dry conditions persist for Ailinglapalap.
Pago Pago had 1.28 inches of rain this week, which is 0.72 inch less than the weekly threshold of 2 inches to meet most water needs. The stations located in Siufaga Ridge and Toa Ridge were also dry reporting 0.78 inch and 0.42 inch, respectively. However, because last week was extremely wet for American Samoa, drought free conditions persist.
Virgin Islands
St. Thomas had a very wet week with rainfall totals at Cyril E. King airport at 6.78 inches. Most of that rain fell on July 31 when a total of 4.88 inches was reported at the airport, setting a new record for the highest daily rainfall for this location. The previous record was 1.43 inches set in 2016. Overall, the month of July had a total of 7.75 inches–the wettest July on record for Cyril E. King Airport, surpassing the previous record set in 1958 by 0.34 inches. The year-to-date rainfall total was 18.01 inches or 107.1% of normal precipitation. The SPI value for the 3, 6, and 9 months were 0.94, 0.26, -0.21, respectively, which is consistent with drought free conditions. The SPI value for the 12 months was -0.59 which is consistent with abnormally dry conditions. Drought classification for St. Thomas was improved by one category (from severe to moderate drought) this week due to the beneficial rains.
St. Croix, on the other hand, was dry with only 0.37 inch of rain for the week at the Henry E. Rohlsen. The year-to-date rainfall total was 12.8 inches, which is 73.7% of normal precipitation. SPI values for the 3 and 6 months were 0.08 and -0.17, respectively, consistent with drought free conditions. However, the 9 and 12 months SPI were -0.98 and -1.27, respectively, which is consistent with moderate drought. For this drought week, moderate drought (D1-L) conditions persist in St. Croix.
St. John had a wet week with a weekly rainfall total of 2.43 inches at Windswept Beach, according to data from a volunteer observer. The July rainfall total was 3.62 inches or 106% of normal. Meanwhile, the year-to-date (as of Aug 5) rainfall total was 16.48 inches or 65.5% of normal precipitation. The SPI values for the 6-month period was -0.95, consistent with moderate drought. St. John’s drought classification remained as moderate drought this week.
Looking Ahead
During the next 5 days (August 8 – 13, 2019) should bring heavy rains of 1 to locally 4 inches to portions of western New Mexico, a swath through the central Plains, and many locations across upstate New York and southern Maine. Most of the area from northern Idaho eastward through northern Montana are expecting 1 to 2 inches, as are most of the Dakotas and scattered patches across the Pacific Northwest. Other areas of dryness across the contiguous 48 states should get lesser amounts. Locally up to an inch is expected in the Southeast and southern New England, and little or none is anticipated in most of the new D0 area in the southern Plains from central Kansas through Oklahoma and Texas. Temperatures are forecast to be a few degrees above normal in the southern Plains and the Southeast while subnormal temperatures should extend from the northern half of the Plains to the Pacific Ocean.
The CPC 6-10 day outlook (August 14 -18, 2019) favors above-normal precipitation in east-central Alaska, the Pacific Northwest, the central and northern Plains, the lower Mississippi Valley, and the Southeast. Meanwhile, subnormal precipitation is expected in southern and southeast Alaska, the eastern Great Basin, the Four Corners States, most of Texas, and the Northeast. Temperatures should average below normal from the Intermountain West eastward through the Midwest and Northeast, and across east-central Alaska. Farther south, southern and southeastern Alaska have enhanced chances of warmer than normal weather, along with the Pacific Coast and a large swath from the Great Basin through the Four Corners States, central and southern High Plains, lower Mississippi Valley, and Southeast. The highest likelihood for hotter than normal weather are across most of Texas and the lower Southeast.
Some may find this way of looking at things useful and I hope these graphics are not too small to read. I did not make them so you could click on them individually but you can click on the whole graphic and it may enlarge. But I think you get the picture. It has been a rapid onset and demise. When you read these graphics, remember that the older graphics are not the drought conditions that existed then but the change from then until now.

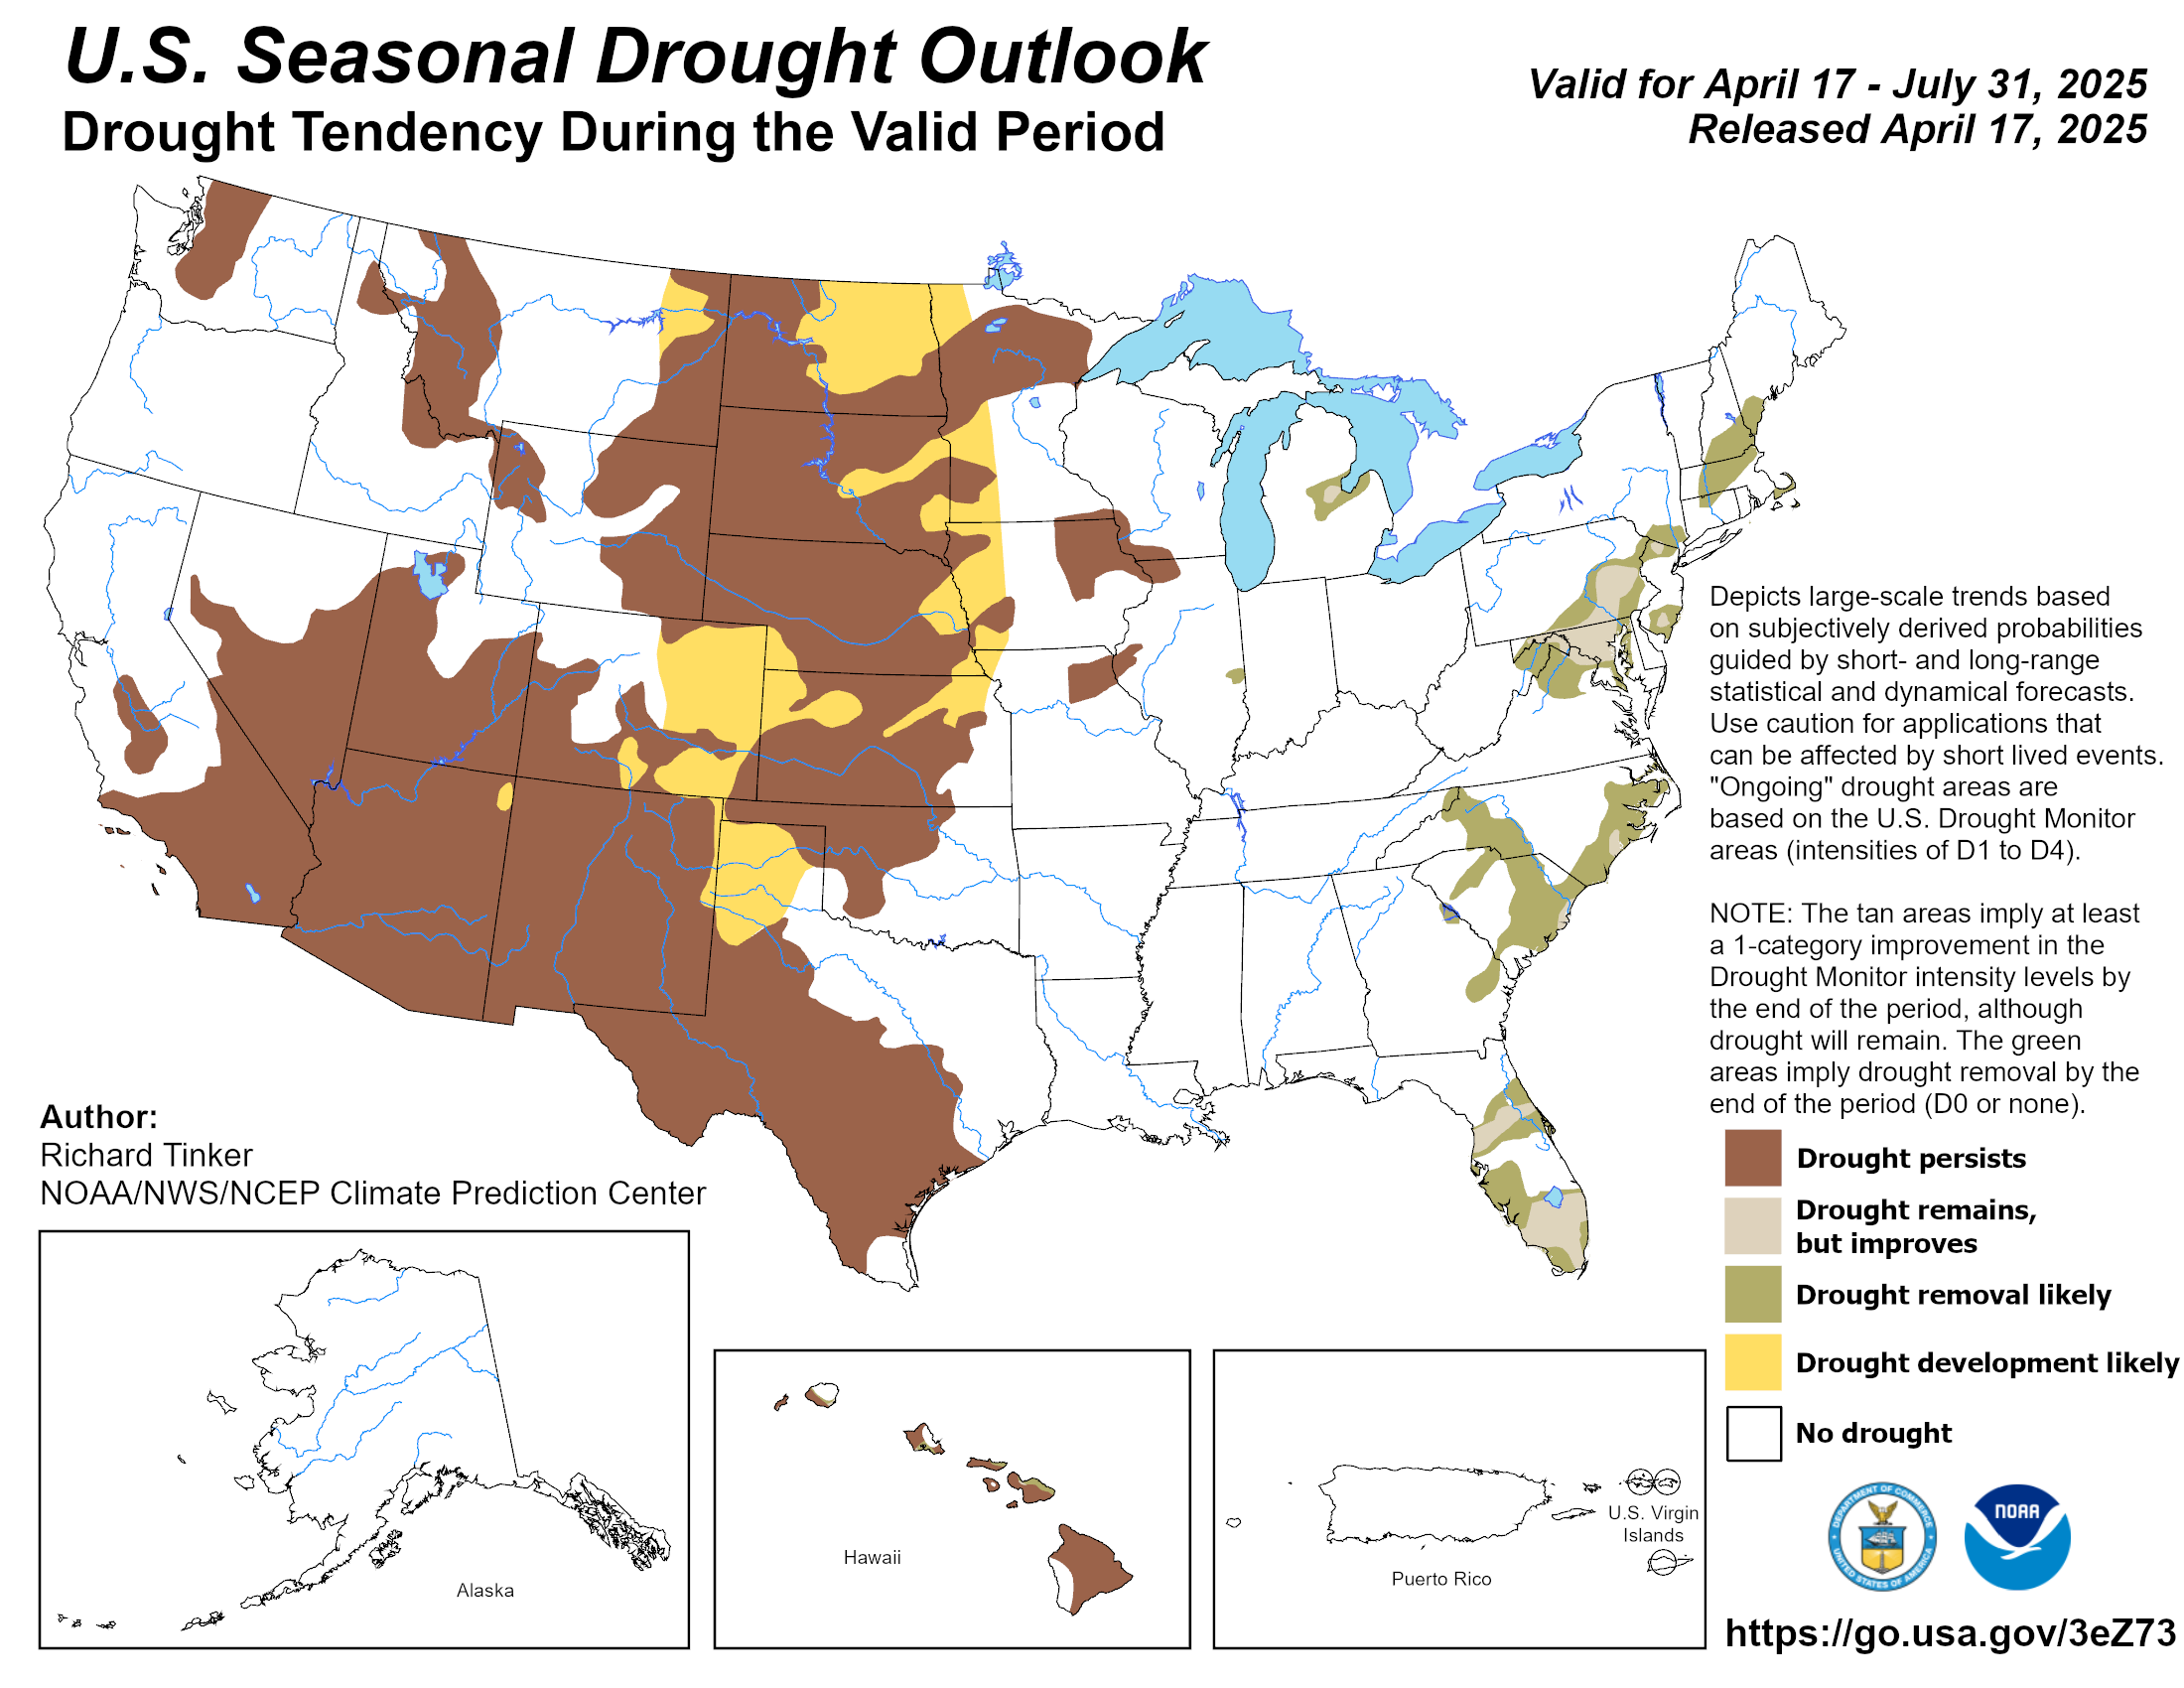
Drought Forecasts
First we show the forecast for the current month August which was updated on July 31, 2019 and then the forecast through October which was issued on July 18 (to be updated on August 15). These two forecasts are issued by the same agency but to obtain them you need to access two different links here and here.
Here is the Monthly Drought Outlook which was updated on July 31, 2019

Here is the Three-Month Forecast Issued on July 18 which will be updated on August 15, 2019
Floods remain a concern.

| Last Week | Current Week |
|
|

Let’s see if this animation works.

Active Major Fires

It is mostly about Alaska. But very recent rains has dramatically improved the situation.

Looking out another month.


Crop Progress
Last week we looked at the individual crop progress reports graphically from this source. Next week or so we will review this Executive Summary Report which provides projections of the ultimate harvest.
But for now we will look at the season to date information summary.

| Crop | Crop Progress | Crop Condition |
| Corn | Very Slow (Silking and Dough) | Very Bad |
| Soybeans | Very Slow (Blooming and Setting Pods) | Very Bad |
| Winter Wheat | Slow (Harvested) | Very Good |
| Spring Wheat | Very Slow (Harvested) | OK |
| Cotton | Good Squaring and OK Setting Bolls | Very Good |
| Sorghum | Very Slow Headed and Slightly Slow Coloring) | Very Good) |
| Rice | Very Slow (Headed) | OK |
| Oats | Very Slow (Harvested) | Slightly Bad |
| Barley | Very Slow (Harvested) | Slightly Bad |
| Peanuts | Ok(Pegging) | OK |
| Sugar Beets | Slow (Planted) but caught up. | NA |
| Sunflowers | Slow (Planted) but caught up. | NA |
The following table summarizes the situation. It has changed a bit since last week.
| Crop development not Late | OK | Crop Development Late | |
| Crop Condition Good | Winter Wheat Sorghum | ||
| Crop Condition OK | Peanuts Cotton | Spring Wheat Rice | |
| Crop Condition Bad | Corn Soybeans Oats Barley |
But the above is somewhat of a static analysis. Where things stand this week. Now we will take a look at how things have evolved this crop season and how this crop season compares to recent crop seasons.
International

A map helps and is not always available and fortunately, it was not available this week so this is last week’s map.

Major Sources of Information
In the box are shown the major resources we use. We will not be using them all each week but the reader is welcome to refer to these resources. .
Major Sources of Information Used in this Weekly Report
|
Background Information


The sequence of drought occurrence and impacts for commonly accepted drought types. All droughts originate from a deficiency of precipitation or meteorological drought but other types of drought and impacts cascade from this deficiency. (Source: NDMC)
Source: National Drought Mitigation Center, University of Nebraska-Lincoln


