Written by Sig Silber
U.S. and World Agriculture: Plus an Expanded Weather Forecast Section
Updated at 4 p.m. EDT June 21, 2019 to reflect the new Week 3 – 4 Forecast which on balance is not good for agriculture.
The focus has shifted from crop planting to emerging and various stages of development. It should not be a surprise that since planting was delayed, the subsequent stages would be delayed. The question now is what the impact will be on the final harvest numbers. We begin to address that question tonight but I note that for the moment, conditions are improving.

Please share this article – Go to the very top of the page, right-hand side, for social media buttons. Please feel free to send this article to anyone who you think might benefit from reading it. This edition is particularly important because of the economic implications and the guidelines for thinking about what these implications might be.
Today is June 21, 2019 If you are reading this article later than this date, there may or may not be a later version which you can access by clicking here and selecting the latest version of this article from the top of the Directory and clicking on that. Many of the graphics in this article will update continually. So many but not all of the graphics continue to update but the latest version of the article has my updated commentary and updated NOAA discussions when we update those which may be done on the day after the article is first published or later in the week depending on how fast conditions are changing. So if you have an older version, e.g. from an email you received yesterday, the graphics that auto-update are always current but if you want to be sure you have the most current discussions, click here and then click again to go to the most recently published version. It is our goal to provide the most current information and discussion practical. You do not need the most up-to-date version to have the most up-to-date forecast as that updates automatically but if you are interested in my comments or the NOAA discussion the text in this article is updated manually if we republish the article to keep it as current as possible. I hope this explanation is not too confusing.
It is important to understand that the impact of weather on economic activity varies from one place to another. In this article, we try to provide a broad view of the impacts focusing mostly on the U.S. but also to a lesser extent on the Rest of the World. |
Major Sources of Information Used in this Weekly Report
|
1. Special Reports and Highlights.
Thinking about the slow start of planting.
Here is what we see this week
| Crop | Percent Planted | Percent Emergence or Other Metric |
Corn Soybeans Winter Wheat Cotton Sorghum Rice Oats Barley Spring Wheat Peanuts Sunflowers | -8 -19 Fully Planted -6 -19 Fully Planted Fully PLanted Fully Planted Fully Planted -1 -13 | -18 -34 -17 Harvested -2 Squaring -3 headed -6 -4 -3 -2 +4 Pegging NA |
Focusing on the two most important crops.

and then Soybeans.

But does slow mean low? Will the final harvest be low? What are the chances of a recovery?
Le’ts take a look.

Now some more relevant data but not as recent as I would prefer.


Here is the source for the above three graphics: An Iowa State Agronomy Course.
Here is my own analysis of the situation .
| Factors Favorable for Crop Recovery | Factors which Could go Either Way |
| * Temperature high during growing Season rather than too high or too low * Precipitation dramatically reduced during the growing season * Too wet during harvest time or early frost. |
Where do we stand in the short-term re the above factors?
Flooding.

| Last Week | Current Week |
|
|


Agriculture Field Work
| Last Week | This Week |
|  |

We now have a new drought forecast for the next three months.

It came with a discussion
Latest Seasonal Assessment – Drought coverage remains extremely low nationwide, though it increased slightly since the last Seasonal Drought Outlook. Moderate drought expanded to cover northwestern Washington, and also spread into northwestern Oregon, the northern Idaho Panhandle, and adjacent areas. Moderate drought also expanded into a larger portion of the Southeast. Drought enveloped much of central and south Georgia, northern Florida, and the Carolina Coastline earlier in June, but heavy mid-month rainfall took some of these areas back out of drought. New regions of moderate drought were introduced in northern North Dakota and a few spots in southern Texas, but a vast majority of the contiguous U.S. remained drought-free. In fact, increased precipitation improved conditions in northern Wyoming and the Four Corners States, with drought now restricted to a stripe along the western New Mexico border.
Outside the contiguous states, drought expanded into much of central and southern Puerto Rico during the past month. Moisture deficits also increased in the leeward areas of Hawaii, and drought now covers most of that region. The drought in the southern Alaska Panhandle intensified, and severe to extreme drought has been introduced in part of that area. Across the rest of the nation, the only other area in extreme drought is a small spot in the southernmost Big Island in Hawaii. Most of the drought areas across the nation are moderate in severity. Severe drought is restricted to isolated patches in southern Alabama and Georgia, part of northern North Dakota, a few leeward areas in Hawaii, and southeastern Alaska.
By the end of September, drought coverage should still be limited, but many current areas are expected to persist or expand. Drought coverage is expected to increase in the Northwest, the northern Plains, south Texas, and Puerto Rico. Furthermore, conditions should remain unchanged at best in leeward portions of Hawaii, the southern Alaska Panhandle, and parts of the central Carolina Coastline; however, drought removal is forecast for most other parts of the Southeast by the end of September, and the Four Corners States should be cleared of drought as well.
2. Summary of Intermediate-Term Weather Forecast (helpful to predict drought and floods etc)
Here is the summary of the forecast for the next approximately twenty-five days. We provide this so that we can make our own assessment of the drought forecast. Here I provide the weather forecasts for different periods of time in which should allow the reader to assess the likelihood of this forecast working out as shown over the next three to four weeks. Since we publish this week on Thursday, we generally update the discussion for the Week 3 – 4 forecast when it is updated on Friday. This is important as the current Day 6 – 14 forecasts and the week-old week 3 – 4 forecast overlap to some extent.
Later we provide additional information relative to the weather forecast analysis but here is the summary.
First Temperature
|
|
|
|
The graphic above shows magnitude rather than the probability of being higher or lower than Normal and shows the middle day of the five day period. | Stagnant but deamplifying. Remember for this purpose, what NOAA calls Week – 1 is Days 6 -10 and Week – 2 is days 8 – 14. The transition from the 8 – 14 day forecast shown above to the week 3/4 forecast seems feasible. The week 3-4 graphic updated on June 21, 2019. It is not an ideal forecast since the area of recent flooding would benefit from warmer temperatures for a while at least. And South Texas would probably prefer to be less warm during Weeks 3 and 4. With a slow start to the Monsoon, the Southwest will be hot. | ||


And then Precipitation
|
|
| |
The five-day QPF is shown above. The units are different than the other maps i.e. in units of precipitation (inches) not probabilities of exceeding or being less than climatology. | Again fairly stagnant but perhaps with some east and northeast movement and also deamplifying. The transition from the 8 -14 day forecast shown above to the week 3/4 forecast seems feasible. The week 3-4 graphic updated on June 21, 2019. It is not an ideal forecast except perhaps for the Northwest. The Middle and Lower Mississippi would probably prefer less wet conditions and the Southwest for sure would welcome the North American Monsoon. | ||


Here is the discussion released with the updated week 3 – 4 Forecast. There is not a high level of confidence in the forecast.
Prognostic Discussion for Week 3-4 Temperature and Experimental Precipitation Outlooks NWS Climate Prediction Center College Park MD 300PM EDT Fri Jun 21 2019
Week 3-4 Forecast Discussion Valid Sat Jul 06 2019-Fri Jul 19 2019
Weak El Nino conditions persist over the Tropical Pacific. While the MJO signal has weakened, enhanced convection persists over the Maritime Continent. MJO was not a factor in the Week 3-4 Outlook with models indicating large uncertainty in the MJO signal over the next couple weeks. The impact of El Nino on the climate pattern over North America during the boreal summer is relatively weak for precipitation but consistent with greater probability of below normal temperatures over the central CONUS, which supports the Week 3-4 temperature outlook. The relationship of ENSO and decadal trends to the Week 3-4 outlook period forecast is described by a multiple linear regression (MLR) statistical model. In addition to statistical guidance, the Week 3-4 outlook is based primarily on dynamical model guidance from the CFS, ECMWF, and JMA ensemble prediction systems, as well as guidance from the Subseasonal Experiment (SubX), a multi-model ensemble (MME) of several experimental and operational ensemble prediction systems. Soil moisture conditions and a constructed analog based on these was also considered in the Week 3-4 outlook. Soil moisture is currently substantially above normal over much of the central CONUS.
The ECMWF and JMA models indicate a trough over the western Aleutians and ridging over northern Alaska, while the CFS model has a somewhat weaker but similar circulation pattern over this region. A consensus of the SubX MME predicts a similar pattern at high latitudes with greater positive 500-hPa height anomalies over much of Alaska. The CFS, ECMWF, and JMA models, as well as the SubX MME, all support weak troughing downstream near the Pacific coast of North America. The JMA model predicts a stronger negative anomaly over the northern central CONUS, compared to weak negative anomalies over the western CONUS in the ECMWF forecast, and weak positive anomalies and ridging over the central CONUS in the CFS forecast. The consensus SubX MME forecast indicates likely positive 500-hPa height anomalies over the western CONUS, along the Gulf Coast, and over the Eastern Seaboard. The SubX MME predicts weaker anomalies and relative troughing over the eastern central CONUS.
Despite uncertainty in the circulation pattern forecast for the Week 3-4 period, as indicated by the variations among model forecasts, there are some consistencies among the temperature and precipitation forecast tools. All models including the CFS, ECMWF, JMA and SubX indicate some areas of increased probabilities of below normal temperatures for parts of the Great Plains, partly associated with signals related to precipitation forecasts and wet soil moisture conditions. An equal weighted combination of the CFS, ECMWF and JMA forecasts indicates the greatest probabilities for below normal temperatures over parts of the central and southern Plains. The Week 3-4 outlook indicates enhanced probabilities of below normal temperatures for the Great Plains from South Dakota to northern Texas across the central Mississippi Valley into areas of the Midwest, as well as the Ohio and Tennessee Valleys. Above normal temperatures are most likely for Alaska, under predicted positive 500-hPa heights anomalies. Above normal temperatures are likely for much of the Northwest CONUS, parts of the Southwest, as well as along the Gulf and Atlantic Coasts, as indicated in the equally weighted probability forecasts of the CFS, ECMWF and JMA models, and the SubX MME probability forecast.
While there is considerable uncertainty in the Week 3-4 precipitation outlook, probability forecasts from the equally weighted CFS, ECMWF and JMA models show some consistency with the SubX MME probability forecast. These two tools were used as the primary guidance for the Week 3-4 precipitation outlook. The Week 3-4 outlook calls for enhanced probabilities for above median precipitation for southern areas of Alaska from the Aleutians to the Alaska Panhandle, ahead of predicted anomalous troughing. Above median precipitation is likely for the Pacific Northwest eastward into western areas of the Northern Plains, supported largely by the ECMWF model precipitation forecasts. Probabilities of above median precipitation are enhanced for parts of the Central Plains eastward across the central Mississippi Valley into parts of the Ohio and Tennessee Valleys, supported by anomaly forecasts of the SubX MME, and to some extent by the ECMWF precipitation forecast. Below median precipitation is likely for parts of the Southwest and Northeast CONUS, following guidance from the SubX MME and a blend of dynamical and statistical forecast tools.
Above normal sea surface temperatures and dynamical model guidance from the SubX MME support above normal temperatures during the Weeks 3-4 period across Hawaii. Above median precipitation is likely across Hawaii in the Week 3-4 period, as indicated by the SubX MME probability forecast.

Additional Information on the forecast is provided later.
3. Present Drought Conditions
The U.S. Drought Monitor is a comprehensive way of understanding the drought situation for the U.S. It is issued every Thursday and reflects the conditions as of the prior Tuesday. Drought is defined as a moisture deficit bad enough to have social, environmental or economic effects. Thus, more factors than recent precipitation are considered and more information on how it is done is found at the end of this report.

U.S. Affiliated Pacific Islands and the U.S. Virgin Islands.

Below is the map for just CONUS and with statistics and below that map I have provided a cut-out of the statistics which I think you can click on to enlarge. When you click on graphics that I have set up to enlarge, if that does not work, often if you right click with your mouse and then click on “view image” that will work.
 |
 |
| Last Week | This Week |
| |

The graphic below shows the one-week change in drought intensity. Yellow is bad. Green is good.
|

Now we show the week to week change information by region. The yellow is where the drought has been upgraded. The green is where the level of drought has been downgraded.
 |
Deterioration in North Dakota. Improvement in Wyoming which shows up in two graphics for some reason. |
 |
| Deterioration in Minnesota |
 |
| No Change |
 |
Mixed in Texas with deterioration in Tennessee. |
 |
| Improvement in all the Southeast states except Alabama |
 |
Deterioration in Washington, Idaho, and Montana with improvement in Wyoming. |
Some may find this way of looking at things useful and I hope these graphics are not too small to read. I did not make them so you could click on them individually but you can click on the whole graphic and it may enlarge. But I think you get the picture. It has been a rapid onset and demise. When you read these graphics, remember that the older graphics are not the drought conditions that existed then but the change from then until now.

Some might find this animation of twelve weeks of change useful;

Here is the discussion which was issued with the Drought Monitor today.
This Week’s Drought Summary
A stationary front was a focus for frequent showers and thunderstorms with locally heavy rainfall from eastern South Carolina south to the Big Bend of Florida from June 11 to 14. The heavier rainfall resulted in short-term rainfall surpluses and drought elimination to parts of the Coastal Plain of Georgia and South Carolina. Another cold front progressed slowly south and east across the Great Plains, Corn Belt, and Mississippi Valley from June 14 to 16 before becoming stationary. Locally heavy rain (more than 2 inches) and hundreds of severe weather reports were common across the central and southern Great Plains, middle to upper Mississippi Valley, and Ohio Valley during mid-June. Excessively wet conditions continue to slow the emergence of corn and soybeans across the Corn Belt. Meanwhile, drought intensified across northern North Dakota due to a lack of rainfall since April. A strong ridge of high pressure resulted in dry weather and record high temperatures (June 11 and 12) across the Pacific Northwest where drought is also intensifying. Suppressed rainfall continues to affect parts of Puerto Rico.
Northeast
Scattered showers and thundershowers fell throughout much of the Northeast during early to mid-June with the heaviest 7-day totals (more than 2 inches) across the northern mid-Atlantic and western to central Pennsylvania. 30-day precipitation has averaged at or above normal for most of this region although a small pocket of below average precipitation is located in the lower Hudson River Valley and southern New England. 28-day streamflows remain normal to much above normal throughout the Northeast with this region completely free of abnormal dryness since mid-April.
Southeast
Very heavy rainfall (5 to 11 inches) during the preceding week prompted a 2-category improvement from moderate drought (D1) to an absence of abnormal dryness from Charleston, SC southwest to Savannah, GA. Since June 1, rainfall amounts have totaled 16.72 inches near Bluffton, SC. This 2-cateory improvement coincides with where 30 to 90-day precipitation surpluses are now observed and there is no longer support for abnormal short-term dryness. Despite these improvements, it should be noted that hot temperatures earlier in the month damaged corn in the reproductive stage. Moderate drought (D1) persists across southeast North Carolina along with the Pee Dee region of northeast South Carolina where field corn was rolled up and pasture conditions were poor. Recent, heavier rainfall also led to improvements across parts of southern Georgia and northern Florida. A small area of severe drought (D2) remains centered over Ware County in southeast Georgia. The 28-day streamflow along the Satilla River near Waycross, Georgia is at the 9th percentile. Drought severity was degraded to severe (D2) in parts of southeast Alabama due to large precipitation deficits from 30 to 180 days along with low streamflows. The 28-day streamflow along the Choctawhatchee River in Dale County of southeast Alabama is below the 8th percentile. The D2 area is generally consistent with where 180-day precipitation deficits range from 8 to 12 inches. As of June 18, moderate drought (D1) remains centered over Leon County in northern Florida with a year-to-date precipitation deficit of 10.26 inches.
South
7-day rainfall anomalies (June 11 to 17) varied across the southern Great Plains, lower Mississippi Valley, and Tennessee Valley which is typical for this time of year. The heaviest rainfall (2 to 4 inches, locally more) was observed across scattered areas of Oklahoma, eastern Texas, and the Texas Gulf Coast. Less than an inch of rainfall was generally observed across most of Arkansas and adjacent areas of northwest Mississippi and western Tennessee. The Vegetation Drought Response Index (VegDRI) continues to reflect moist conditions throughout much of this region. Soil moisture remains above the 99th percentile across most of Oklahoma and northern Texas. According to the Oklahoma Mesonet, the northeast quarter of Oklahoma has received 12 to 18 inches of rainfall during the past 30 days. Abnormal dryness was expanded slightly across parts of the Tennessee Valley in areas where 60-day precipitation averages 50 to 75 percent of normal. However, much of this region remains drought-free since 28-day streamflows and soil moisture do not support a drought designation at this time. A slight expansion of abnormal dryness (D0) and moderate drought (D1) was necessary across Deep South Texas due to increasing short-term rainfall deficits and periods of above normal temperatures during the past month.
Midwest
A majority of the Midwest remains excessively wet with precipitation averaging 150 to 200 percent of normal dating back 180 days. Due to the wet winter and spring, soil moisture remains above the 99th percentile across much of the Corn Belt. According to the USDA Weekly Weather and Crop Bulletin (valid on June 16), 79 percent of the nation’s corn had emerged which is 18 percentage points behind last year and the average. Only 55 percent of the soybeans had emerged which is 34 percentage points behind last year and 29 points behind the average. Moderate flooding continues along the middle Mississippi and Illinois Rivers. Farther to the north, a slight expansion of abnormal dryness (D0) was depicted for parts of northern Minnesota due to increasing short-term precipitation deficits.
High Plains
Late May through mid-June is typically a wetter time of year across the northern Great Plains. However, during the past 60 days, parts of northwest North Dakota have received less than 50 percent of their normal rainfall. Given the lack of rainfall since the snow melt in early April, multiple adverse impacts to agriculture and livestock are being reported across the northern tier of counties in North Dakota. These reports include: lack of forage production on pastures, culling of cattle herds, and delayed crop growth. Based on the increasing short-term deficits, soil moisture conditions, and reported impacts, severe drought (D2) is warranted for parts of northern North Dakota. A lack of late spring rainfall also continues to result in an expansion of abnormal dryness (D0) and moderate drought (D1) across the northern half of North Dakota. In contrast to the worsening conditions across North Dakota, abnormal dryness was removed from the Big Horn Mountains of Wyoming based on a continuation of a favorably wet pattern through May and June.
West
The month of May tied for the 9th warmest for Washington dating back to 1895 and statewide March thru May tied for the 13th driest period on record Based on 90-day precipitation deficits of more than 8 inches along with 28-day streamflows and soil moisture below the 10th percentile, severe drought (D2) was expanded across western Washington. Levels along Rimrock Lake are extremely low with adverse impacts to boating docks. Record high temperatures during early June also played a role in the intensification of drought across western parts of Washington and Oregon. On June 12, a daily-record high of 95 degrees F was set in Seattle. In Oregon, daily-record highs on June 12 included: 98F at Portland, 99F at Medford, and 101F at Roseburg. The expansion this week of D0 and D1 across Oregon and Washington is generally reflective of the current 28-day streamflows. Long-term D0 remains in parts of southern California due to the multi-year drought. Elsewhere across California and the Great Basin, many reservoirs are full and 28-day streamflows remain high after the onset of the snowmelt season.
Alaska, Hawaii, and Puerto Rico
The southern Alaska Panhandle had its driest June 2018 through May 2019 period on record, which supports the ongoing extreme drought (D3). Based on low 28-day streamflows along the Yukon River in eastern mainland Alaska and below average precipitation from March through May 2019, abnormal dryness (D0) was introduced to eastern mainland Alaska. 90-day precipitation has averaged less than 50 percent of normal across southwest and south-central Puerto Rico. Also, as of June 18 the year-to-date precipitation deficit at San Juan, Puerto Rico is 8.57 inches. Based on these increasing precipitation deficits, moderate drought (D1) was expanded to include more of southern Puerto Rico and the San Juan area. No changes were made this week to the drought status in the Hawaiian Islands.
Pacific Islands
The weather pattern during this USDM week (6/12/19-6/18/19) consisted of Inter-Tropical Convergence Zone (ITCZ) convection across southern Micronesia while a dry trade-wind pattern dominated across the north. The ITCZ convection was triggered by trade-wind convergence, surface troughs, and tropical disturbances, including a circulation of interest labeled Invest 94W over western Yap State and Palau. An upper-level low northeast of the Marianas teased the islands with showers which mostly kept offshore. A warm, humid, and unstable air mass brought rain to American Samoa early in the week, but drier and more stable air dominated the weather for most of the week.
Satellite-based estimates of 7-day precipitation (QPE) showed a broad band of precipitation across southern Micronesia, with an inch or more from roughly 7 degrees North latitude to the equator. Four inches or more of rainfall was indicated over the west south of about 6 degrees N, in the vicinity of 94W, and south of 4 degrees N over central and eastern Micronesia in the areas of most intense ITCZ convection. Little to no rainfall was indicated on the QPE over northern areas of Micronesia. A band of 4+ inches of rain was indicated on the QPE south of the Samoan Islands, with a thumb of 2-4 inches extending northward near American Samoa.
Showers were observed in the Mariana Islands this week, although rainfall totals were well below the 1-inch weekly minimum needed to meet most water needs. Saipan saw 0.66 inch of rain and Rota recorded 0.08 inch so both islands remain in extreme drought (D3). Guam picked up only 0.20 inch of rain this week. After a few weeks of rain at the end of May and beginning of June, conditions on Guam were improved to severe drought (D2-S). But with dry conditions again the last two weeks, Guam deteriorated to D3-S again this week.
Palau recorded 2.26 inches of rain this week bringing the June total to 10.20 inches already. Due to dry conditions in February through May, Palau remains in moderate drought (D1-S) with dryness having lasted less than 6 months.
It has been a relatively wet June so far for a portion of the Federated States of Micronesia. Woleai saw 3.69 inches of rain this week (2 days missing) bringing the June total to 13.74 inches. With all the precipitation the last few weeks, moderate drought (D1-S) improved to abnormal dryness (D0-S) this week with dryness having lasted less than 6 months. Chuuk Lagoon recorded 5.41 inches this week (1 day missing) which follows the 2.94 inches that fell last week and the 3.73 inches that fell during the week of May 28. Severe drought (D2-S) was improved to moderate drought (D1-S). Lukunor saw 2.31 inches of rain this week (1 day missing) and has seen 11.63 inches of rain in June already, so drought-free conditions remain. Precipitation this week at Nukuoro (2.59 inches; 1 day missing), Kapingamarangi (5.80 inches; 1 day missing), Pohnpei (6.32 inches), Pingelap (5.40 inches), and Kosrae (4.34 inches) all exceeded the 2-inch weekly minimum needed to meet most water needs, so each location remains free of drought and dryness. In contrast, dry conditions were found on Yap (0.99 inch; 2 days missing) and Fananu (1.02 inches; 2 days missing) this week, so severe drought (D2-S) remains on both islands.
Much needed rain fell on Utirik this week (2.25 inches), but exceptional drought with dryness on short- and long-term time scales (D4-SL) remains since one week of adequate rain is not enough to improve drought conditions. Wotje remained very dry with no rain this week (1 day missing) and so remains in exceptional drought (D4-SL). Kwajalein saw its third dry week in a row (0.62 inch) and remains in moderate drought (D1-S). Meanwhile, Jaluit recorded 1.26 inches of precipitation this week marking the fourth week in a row below the 2-inch weekly minimum. Because precipitation in April and May also failed to meet the 8-inch monthly minimum, abnormal dryness (D0-S) was degraded to moderate drought (D1-S) on Jaluit this week. Majuro saw 1.21 inches of rain this week (1 day missing) and remains abnormally dry (D0-S). Mili recorded only 0.75 inch this week (1 day missing) but has already seen 9.53 inches of rain in June and so remains drought-free. Ailinglapalap was the only location to receive abundant rain this week (3.58 inches), but remains abnormally dry (D0-S) since drier conditions were observed in previous weeks.
Pago Pago recorded 1.79 inches of rain this week and remains drought-free since previous months saw adequate rainfall.
Virgin Islands
Stable and somewhat dry conditions were present over the U.S. Virgin Islands (USVI) region at the beginning of this U.S. Drought Monitor (USDM) week (June 12-13) leading to primarily fair weather conditions. Beginning Friday and continuing through Monday, two weak tropical waves passed over the area causing an increase in low-level moisture and some showers. Organized convection, however, was not present due to the lack of upper-level forcing, and observed rainfall at each station was less than 0.20 inch. On Monday and into Tuesday, surface high pressure over the Atlantic brought easterly to southeasterly winds to the area and drier, more stable conditions causing a reduction in shower activity.
On St. Croix, Rohlsen Airport saw 0.14 inch of rain this week with trace amounts of precipitation recorded on four other days. June precipitation has totaled 0.16 inch so far compared to the 1.42-inch normal (11% of normal) and is on track to be the fifth driest June on record (since 1951). However, the Rohlsen Airport May precipitation total was 151% of normal (10th wettest on record) and the March-May spring total was near the median value of the period of record. Fort Christiansted saw only 0.09 inch of rain this week, but because 1.20 inches of precipitation fell on June 3, the monthly precipitation total through June 17 is 1.34 inches, or 79% of normal. One- and 3-month SPI values at Rohlsen Airport (0.43 and 0.11, respectively) still indicate no drought, while the 6-month SPI value of -0.83 indicates moderate drought (D1) and 9- and 12-month SPI values (-1.47 and -1.37, respectively) indicate severe drought (D2). St. Croix remains abnormally dry this week with lingering impacts from drier conditions on time scales longer than six months (D0-L).
St. Thomas’s King Airport recorded 0.15 inch of rain this week with trace amounts of precipitation on a couple of additional days. The monthly sum of precipitation through June 18 is 0.44 inch compared to the 1.32-inch normal (33% of normal). As of now, June 2019 is on pace to be approximately the 14th driest (since 1953, but with data gaps some years). If it were to not rain again the entire month, it would be the eighth driest June on record. May precipitation was near the median value while April was the 10th driest. The March-May precipitation total was the 16th driest. A CoCoRaHS station near Anna’s Retreat saw 0.04 inch of rain through June 15. The 1-month SPI value at King Airport (0.47) indicates drought-free conditions, but the 3-, 6-, 9- and 12-month SPI values (-0.95, -1.01, -1.07, and -0.99, respectively) all indicate moderate drought (D1). Abnormal dryness continues for St. Thomas with drier conditions on a longer-term scale (D0-L).
With the lack of precipitation data from the island, St. John was not analyzed this week.
Looking Ahead
During the next 5 days (June 20-24, 2019), a couple of cold fronts are forecast to progress east across the northern half of the central and eastern U.S. On June 20, locally heavy rain (more than 1 inch) is expected to accompany a cold front as it crosses the Northeast and northern mid-Atlantic. A second frontal system is likely to trigger severe thunderstorms with heavy rainfall across the central U.S. The NWS WPC 5-day quantitative precipitation forecast (QPF) calls for widespread amounts of 1 to 3 inches, locally more, from eastern portions of the central and southern Great Plains east to the Midwest and Ohio Valley. Dry weather is likely to persist across southern Texas and the Pacific Northwest. The most anomalous warmth is expected across the Gulf Coast States. Overall suppressed rainfall is expected to continue for Puerto Rico through late June.
The CPC 6-10 day outlook (June 25-29, 2019) favors above-normal temperatures across much of the central and eastern U.S. with below-normal temperatures lingering over the western U.S. Enhanced odds for above-normal precipitation are forecast for much of the eastern U.S., Ohio and Tennessee Valleys, middle to lower Mississippi Valley, and southern Great Plains. A slight tilt in the odds for below-normal precipitation is forecast for southern areas of Florida and Texas, the High Plains, and central to southern Rockies. A relatively warm and dry pattern is most likely to persist across Alaska.
Western Water Situation
Here is part of the explanation for the overall situation in the West. Looking at the information from the network of SNOTEL sites. These are mainly in remote locations often at high elevations. they report by telecommunications hence their name.
First the last seven days.

Then we look at the Water Year.

Then we look at how much snow there is to melt when it is warmer.


Comparing this week to last week.
| Last Week | This Week |
|
|

Wildfires are becoming more of a problem as we move into summer.
Current Situation

11 of the 19 Large Incidents are in Alaska. Updates can be found here.
Now the forecasts


4. Recent Weather
Here is the SWE water content of the snow.
| Last Week | This Week |
|
|


Updates can be obtained here.
Last Seven Days
For reference purposes here is the precipitation information for the prior seven days. It is not the same as what is shown in the USDA Crop Report since the crop week covers the Sunday to Saturday period which corresponds to the crop reports. To avoid confusion, I have not included in this article the weather graphics that correspond to the crop week. But it is important to understand that the crop reports cut off on a Saturday, are reported on the following Tuesday, and the Drought Monitor is issued on Thursday so here are different lags for different sets of information presented.
Below is the current seven-day period and updates in this article automatically every day. It is a better tool for making forecasts.


Current Month to Date.

And then temperature

You can generate a wide variety of different graphics here.
5. Current Forecast for Precipitation and Drought.
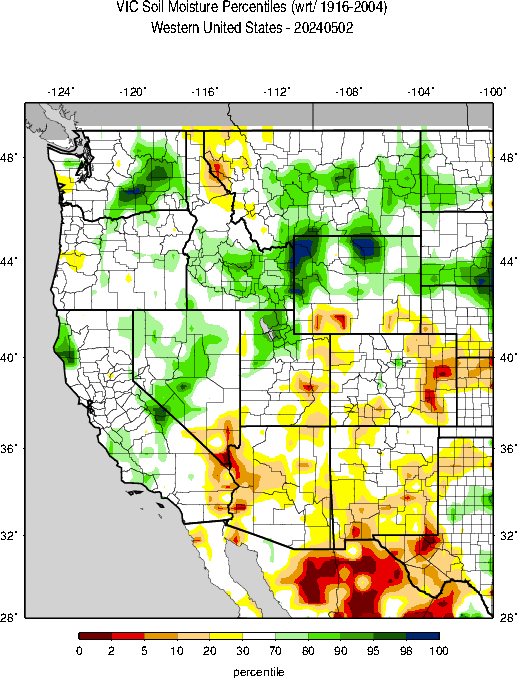
Here is the Seasonal Forecast through September 30, 2019 which was issued on June 20, 2019 with the full Seasonal Outlook.

Here is the June one-month drought forecast which was issued on May 31, 2019.

These two forecasts are issued by the same agency but to obtain them you need to access two different links here and here. The three-month Seasonal Drought Outlook will be updated on May 16, 2019.
Additional Information Relative to the Intermediate-Term Forecast
We provided the summary approximately 25 Day Forecast earlier. Here is additional information that relates to this forecast.
First, the weather hazards forecast.


Additional information can be obtained here. We also now publish a Live Severe Weather article. The link to our Severe Weather Events article changes every Sunday night and the current version of our Severe Events article
can always be found in the Directory which can be accessed here.
And floods remain a concern which we also discussed in Section I.
| Last Week | Current Week |
|
|
Let’s see if this animation works.

Here are additional useful graphics from my weekly report which update automatically. The forecast maps were shown in the Introduction.
First the Day 3 Mid-Atmosphere pattern.


The below is of interest.

6. Soil Conditions and Crop Reports


We will now start reporting on evaporation

| Topsoil | Subsoil |
 |  |
Soil Conditions
|

Here is another way to look at it based on model results.
| Last Week | This Week |
|  |

| And looking at the West. |
|

| Corn | Very Bad | Rice | Bad |
| Soybeans | Very Bad | Oats | Bad |
| Winter Wheat | Bad to Very Bad | Barley | Bad |
| Cotton | Bad | Spring Wheat | Bad |
| Sorghum | Very Bad | Peanuts | OK |
| Sugarbeet | Bad | ||
| Sunflowers | Very Bad |


7. International

A map helps and is not always available but it is available this week

8. Background Information


The sequence of drought occurrence and impacts for commonly accepted drought types. All droughts originate from a deficiency of precipitation or meteorological drought but other types of drought and impacts cascade from this deficiency. (Source: NDMC)
Source: National Drought Mitigation Center, University of Nebraska-Lincoln


