
Written by Sig Silber
This report is based on the U.S. Drought Monitor which was issued yesterday May 31, 2018. But since the June Update was also published yesterday we decided to report on that last night and report on the Drought and Agriculture Report tonight which also allows us to have the latest Week 3 – 4 forecast. The overall picture improved in May but is very grim in the short term. But there are some signs of early Monsoon-like activity due to the MJO and the evolving El Nino.

Please share this article – Go to very top of page, right hand side for social media buttons.
Summary
Here is what happened with precipitation during the most recent week.

This then is the result as reported yesterday May 31, 2018 by NOAA in conjunction with University of Nebraska – Lincoln.

This graphic shows the one week change in drought intensity.

And here is the forecast.
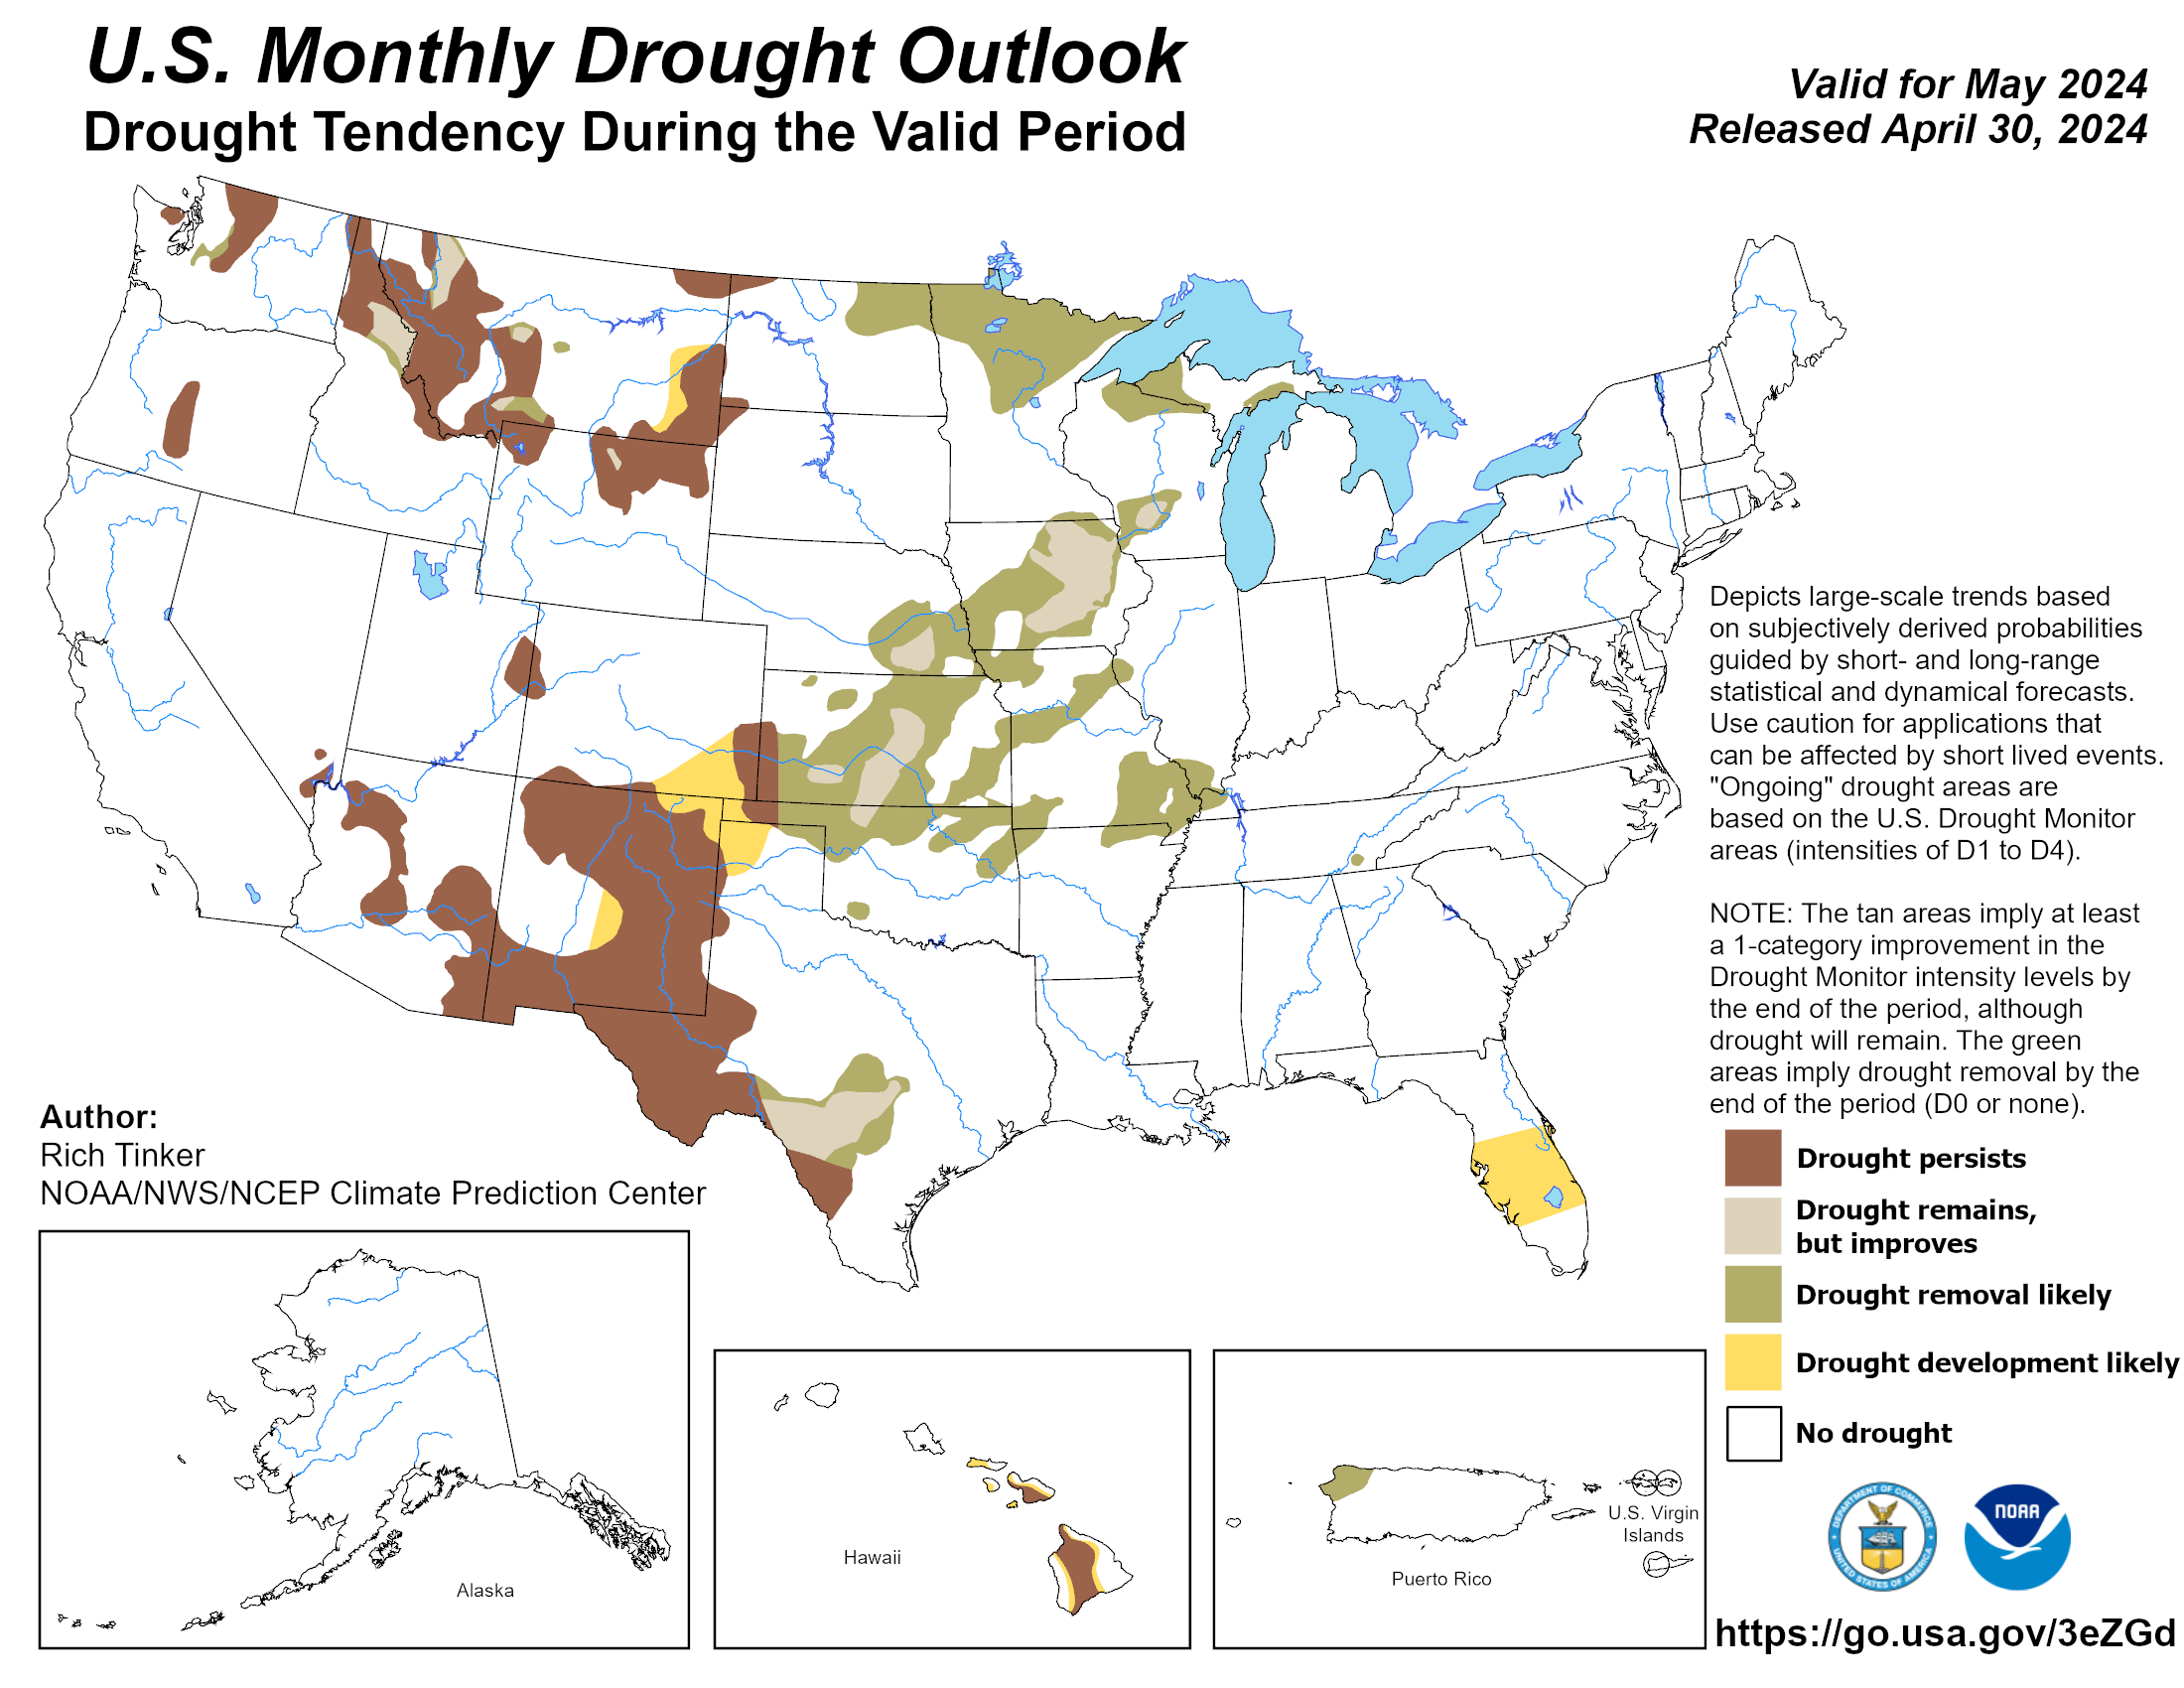
Later I provide the weather forecasts for different periods of time in June which should allow the reader to assess the likelihood of this forecast working out as shown.
Here is our Full Weekly Report.
This report is organized into three parts plus additional reference Information at the end of the report:
- The U.S. Drought Monitor (full report can be accessed here)
- Selected parts of our Weekly Weather and Climate Report (Monday’s full report can be accessed here) which has forecasts for the next 25 days and which auto-updates
- Selections from the Tuesday USDA Weather and Crop Bulletin (full report can be accessed here) supplemented by related information.
1. U.S. Drought Monitor
The U.S. Drought Monitor is a comprehensive way of understanding the drought situation for the U.S. It is issued every Thursday and reflects the conditions as of the prior Tuesday. Drought is defined as a moisture deficit bad enough to have social, environmental or economic effects. Thus, more factors than recent precipitation are considered and more information on how it is done is found at the end of this report.
Below is the same map with statistics and below that map I have provided a cut-out of the statistics which I think you can click on to enlarge.


The below map (which I also presented in the introduction) shows the changes. Yellow is bad. Green is good. Later we show the same information by region.
| Last Week | This Week |
 | |
 |
| Mixed but mostly deterioration in the north. |
 |
| Mixed |
 |
| No problem in Northeast. Not much change. |
 |
| Improvement to the west which was needed. Some deterioration in Central Texas. |
 |
| it has been wet in this area and projected to continue to be wet. Perhaps too wet. |
 |
| Surprisingly little change. Some places a little better others a little worse. AND THERE IS NO D5 CATEGORY TO APPLY. Many of the areas which are the most dry are not getting the rain. Arizona is really dry but again there is not D5 Category. In some places, the pattern has been long intervals of low or zero precipitation followed by a fairly decent precipitation event. I included the pan evaporation graphic to show that with an early Summer, it takes a lot of precipitation to keep up with high rates of evaporation. So it is not that easy to break a drought involving D3 and D4 designations. |
This pair of maps might make it easier to get a general idea of what is happening in the worst part of the drought area.
| Last Week | This Week |
 |  |
Animation of twelve weeks of change

Here is the discussion which was issued with the Drought Monitor today.
This Week’s Drought Summary
Hot weather (daytime high temperatures in the 90’s) stretched from Arizona eastward to Louisiana early in the drought week, before spreading rapidly northward over the Great Plains and much of the Mississippi Valley. Some locations reported triple-digit heat during the week, associated with an amplifying ridge in the middle troposphere over the central contiguous U.S. Though the observed weekly precipitation pattern was largely convective in nature, both AHPS and ACIS depict the heavier precipitation amounts (over an inch) generally across the Southeast, the central Gulf Coast area, and the northern and central High Plains. These areas of heavier rainfall were associated with Subtropical Storm Alberto and baroclinic activity. Alberto developed early in the drought week over the western Caribbean Sea and tracked north over the eastern Gulf of Mexico. By early Monday evening (May 28th, Memorial Day), the center of Alberto crossed the Florida panhandle near Panama City. Preliminary wind reports indicated 40 mph sustained winds at Panama City, with a gust to 59 mph. Near and along Alberto’s path northward, rainfall amounts of 3-8 inches were generally received, with locally heavier amounts.
Northeast
No changes were made to the drought depiction this week. The southwest part of coastal Maine has been relatively dry during the past few weeks, with AHPS Departure from Normal Precipitation (DNP) values ranging from 3-4 inches below normal during the past 30 days. This area in particular will be reassessed next week for the possible introduction of abnormal dryness (D0).
Southeast
Heavy rain (generally 3-8 inches) associated with Subtropical Storm Alberto resulted in the removal of abnormal dryness across Florida, South Carolina, and nearly all of Georgia. In Alabama, moderate drought (D1) was removed, in addition to a significant amount of D0. The rainfall distribution pattern associated with the subtropical storm is quite asymmetrical, with a large portion of the rain falling west of the center.
South
Abnormal dryness was erased from southern Mississippi this week, thanks to Alberto’s rains. In contrast, recent heat and dryness promoted the expansion of D0 across northwest Louisiana and western Arkansas. The 30-day ACIS SPI has values of -1 to -2 in general across the Arklatex region. A major overhaul of the drought depiction in Texas was rendered this week, with some areas showing improvement and others showing deterioration. Recent rain in parts of western Oklahoma favored small-scale improvements in the core drought region, while the lack of significant rain in parts of eastern Oklahoma warranted one-category deterioration.
Midwest
In north-central Minnesota, with streamflow indicators now closer to normal and with improved lake levels, moderate drought (D1) was removed. In western Missouri, where 2-4 inches of rain were reported this week, a one-category improvement was rendered to the depiction. In the northwest part of the state, a one-category deterioration (from D1 to D2) was made to the counties of DeKalb, Clinton, and Caldwell. Dryness and moderate drought across northern Missouri have resulted in a wide array of impacts. These include, but are not restricted to, the implementation of community water restrictions, very short hay carryover supplies from the recent long cold winter (and in some cases, the need to purchase hay in early spring to sustain livestock), and short pastures. Other concerns include low to very low pond levels, low subsoil moisture levels, and some reports of corn starting to roll up to protect itself from the heat and drought. In southwestern Indiana, acute (30-day) rainfall deficits, the 30-day SPI map, and weekly daytime temperatures in the 80’s and low 90’s reveal a rapid drying out of conditions. An area of abnormal dryness (D0) was therefore introduced to the depiction in this region, and the rapidity of this drying out warrants careful reassessment of conditions next week.
High Plains
In south-central and southeastern Nebraska, recent triple-digit heat and dryness has been an issue, especially for pastures and alfalfa. Where 90-day SPIs were less than -1.5, moderate drought (D1) was introduced. This included a small area south of Omaha, which was linked to the D1 area in nearby Iowa. Moderate drought (D1) was also expanded across northern Fillmore and northwest Saline counties. Incidentally, Omaha matched or set four days of high temperature records during the long Memorial Day weekend (Friday through Monday). The highs ranged between 97 and 101 degrees F. Across northwest Kansas, widespread heavy rain (3 inches or greater, with some isolated CoCoRaHS totals of about 9 inches) warranted a one-category improvement in the depiction. Next week, once the rainwater has a chance to either percolate into the soil or run off into streams, additional alteration of the Kansas depiction may be needed. Across the Dakotas, D0, D1, and D2 categorical areas were generally expanded in coverage, due mostly to recent precipitation deficits. There was one area of improvement (D0 was removed) in the Black Hills of South Dakota due to rainfall this past week.
West
Recent rain warranted a one-category improvement in drought conditions (D1 to D0) across northeast Montana, and the two areas of abnormal dryness in this region were consolidated into one. For now, despite recent heat and dryness, it was decided to hold off on introducing any D0 into extreme northwest Montana. Continuing snowmelt runoff and above average river and stream flows provide plenty of water in that area for irrigation. In addition, in nearby Idaho, some areas are coming out of their worst flooding in years. Bonner County continues to experience flooding, and farmers in adjacent Boundary County will be struggling with crop loss from the saturated soils in that region. In Colorado, some improvement in the drought depiction was made from approximately the Front Range just west of Denver eastward through Kit Carson and Cheyenne Counties near the Kansas border. Relatively small adjustments were made in New Mexico this week as well, especially in central and east-central portions of the state.
Alaska, Hawaii, and Puerto Rico
Much of Hawaii had a wet spring so far, especially northeast-facing, windward slopes. The leeward areas of some of the islands have started to dry out a bit. Accordingly, abnormal dryness (D0) was introduced to leeward portions of Oahu, Molokai, Maui, and the Big Island this week. No changes were made to either the Alaska or Puerto Rico depictions.
Looking Ahead
For the ensuing 5-day period (May 31-June 4, 2018), most predicted heavy rain areas (1.5-3.0 inches or greater) are expected to be east of the Mississippi River, where little dryness and drought currently exist. West of the Mississippi River, smaller-scale heavy rain areas of a convective nature are forecast over North Dakota, Nebraska, and southwestern Missouri. For the subsequent 5-day period (June 5-9, 2018), CPC predicts elevated odds of near to below normal precipitation for most of the Lower 48 states. Exceptions include in and around the Florida Panhandle, Minnesota and parts of adjacent states, and much of Arizona and New Mexico, where odds favor above normal precipitation.
Current Forecast for Precipitation (Since we published this week on Friday there was no need to do an update re the Week 3 – 4 forecast as it is issued on Fridays). Normally, this would be important as the current Day 6 – 14 forecasts and the week old week 3 – 4 forecast overlap to some extent.
| The five day QPF is shown to the right. The units are different than the other maps i.e. in units of precipitation (inches) not probabilities of exceeding or being less than climatology. |  | It is difficult to compare this with the other maps as some places are naturally more wet than others. But it is generally consistent with the 6 – 10 day forecast as one can see how the 6 -10 day might follow the 1 – 5 day. | |
 | Transitioning from the 6 to 10 day outlook on the left to the 8 to 14 day outlook on the right. → |  | |
| The Southern Plains looks really bad. The wet area shown for Arizona and New Mexico is questionable and needs to be interpreted in terms of this being a time of the year when any precipitation is considered to be above normal. . | |||
To the right is the week 3 and 4 Experimental Forecast which was updated on June 1 and which we used when we went to press. → |  | ↑ ← In generally it would seem that the Week 3 -4 Forecast is feasible. The updated forecast released on June 1 is not a major change but confirms that a large part of the drought area that is most impacted is forecast to remain dry for an extended period of time. . | |
| To the right is the full month Precipitation forecast for June |  | The full month forecast may not fully reflect the Week 3 – 4 Forecast which was issued a day later than the full-month forecast. | |
| Added the Full Month of June Temperature forecast since this drought where it is centered is very impacted by temperature. |  | The temperature forecast may not fully reflect the new Week 3 – 4 Forecast. But relative to the current drought, that is not critical as the Week 3 – 4 forecast did not affect the areas most impacted. | |
The reader may be able to update some of the reports shown in previous weeks at this link where you can access both the current and archived information. The current version released today can be accessed at this link.
One can generate an infinite number of graphics. I did not want to clutter this report with graphics that were not selected by NOAA to be in the Drought Report issued Thursday or the Weather and Crop Bulletin issued on Tuesday. But I have provided readers with the link above that will allow you to view as much data as you want.
But this graphic was interesting.

3. Selections from the Tuesday USDA Weather and Crop Bulletin (full report can be accessed here) supplemented by related information.
The Summary for the U.S.

Below are more details and there is more information this week as the planting season advances.
This summarizes the situation which is not very much different than the report last week. In some cases there is slight improvement and this is best seen in the detailed tables below.
| Worse than last year and or 5-Yr average | Better than last year or 5-Yr average | In line with recent conditions for this time of year or 5 – Yr Average |
| Oats, Barley, Winter Wheat, Spring Wheat, Pasture and Range Conditions | Soybeans, Sorghum, Rice | Corn, Sunflowers, Peanuts, cotton |
The information in the table below is summarized in the above discussion but in the table below, it is broken down by State.


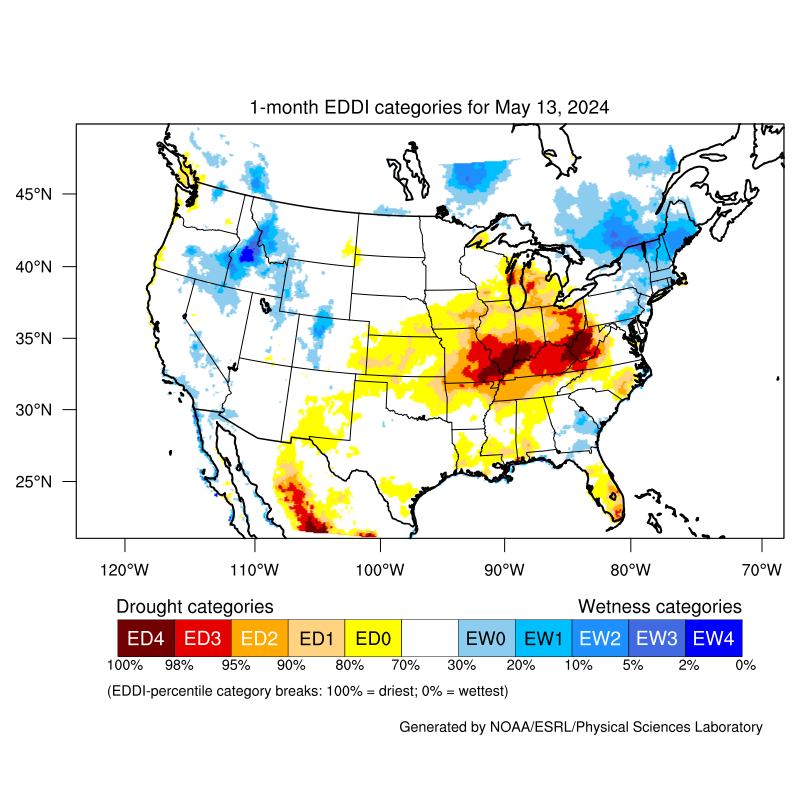
And here is a graphic that pulls a lot of information together. Image provided by the NOAA/ESRL Physical Sciences Division, Boulder, Colorado see website. It shows the demands of the atmosphere for moisture from the ground and is based on temperature, wind, relative humidity and solar radiation. It tells you nothing about how much precipitation you will get but how much you need to retain the same level of soil moisture.

Here is another way of looking at things.


Soil Moisture is a very important part of understanding drought.
| Surface | Subsurface |
 |  |
| The numbers in parentheses show the changes by state. The number of states with surface deficiencies has increased by 3 and the number of states with subsurface deficiencies has increased by 1. | |
 |  |
| There has been a small decrease in the number of states with a surplus. It is not always easy to know how to relate to a moisture surplus. Is it a positive moisture reserve or is it too wet to work the ground? | |
I do not normally present this graphic


Sometimes a map can be helpful to make text come alive.

I am now routinely including the precipitation report for Mexico since storms do not respect borders.

Additional Reference Information
A more complete description of


Source: National Drought Mitigation Center, University of Nebraska-Lincoln, U


