


Written by Gary
Opening Market Commentary For 10-17-2014
Premarkets were up +1% this morning Mostly as a relief to oversold conditions. Markets opened at the +1 percentage level and started to melt fractionally lower unsettling investors that desperately want to see the markets turn around.
Reporting just before 10 am, the University of Michigan Confidence was 84.6, expected 84.0 and reported at 86.4, the highest level in 7 years and the averages DID NOTHING and the volume was falling. That in itself is not a good omen for a return of confidence in the stock market.

The reversal spinning top Doji from yesterday appears to be on the path of confirming an up session, but then we still have the rest of the day to go. What happens next is anyone’s guess, but I suspect we will see the markets enjoy a few days in the sun before turning around and finally making a bottom.
Today is NOT the day to go long, wait for the ‘signal’, stay tuned, I’ll help.
Our medium term indicators are leaning towards sell portfolio of non-performers at the opening and the short-term market direction meter is bullish. We remain mostly, at best, negative and conservatively bullish. The important DMA’s, volume and a host of other studies have now turned and may be enough for some to start shorting. Right now now I am getting very concerned the current downtrend will get more aggressive in the short-term and volatility may promote sudden reversals. The SP500 MACD has turned down, but remains below zero at -29.04. I would advise caution in taking any position during this uncertain period and I hope you have returned your ‘dogs’ to the pound. Having some cash on hand now is not a bad strategy.
Looking at the weekly charts it appears we have another 4% to 5% more to go before we hit the up-trend line from 2009. Just a couple of serious down session would mark a good point for a reversal.
Investing.com members’ sentiments are 39 % Bearish (falling from 70%) and it seems to be a good sign for being bearish. The ‘Sheeples’ always seem to get it wrong.
Investors Intelligence sets the breath at 37.6 % bullish with the status at Bear Confirmed. (Chart Here ) I expect a market reversal at or before ~25.0.
StockChart.com NYSE Bullish Percent Index ($BPNYA) is at 39.16. (Chart Here) Below support zone and apparently going further down. Next stop was ~57 and now it is ~44, below that is where we will most likely see the markets crash. We are seriously below 44 and need a reversal pronto as it looks like there is nothing to stop the fall until 25 and taking the markets with it.
StockChart.com S&P 500 Bullish Percent Index ($BPSPX) is at 41.20. (Chart Here) In support zone and falling – doesn’t look good. ~62, ~57, ~45 at which the markets are in a full-blown correction. The next stop now is ~37.00.
StockChart.com 10 Year Treasury Note Yield Index ($TNX) is at 22.13. (Chart Here) Treasury Yield Curve Approaches Flattest Since 2009.
StockChart.com Overbought / Oversold Index ($NYMO) is at -9.67. (Chart Here) But anything below -30 / -40 is a concern of going deeper. Oversold conditions on the NYSE McClellan Oscillator usually bounce back at anything over -50 and reverse after reaching +40 oversold. Today’s reading indicates we are ripe for another dip.
StockChart.com Consumer Discretionary ETF (XLY) is at 64.05. (Chart Here)
Chris Ciovacco says, “As long as the consumer discretionary ETF (NYSEARCA:XLY) holds above [66.88], all things being equal, it is a good sign for stocks and the U.S. economy.” This chart clearly shows that dropping below 65.00 / 62.75 (and staying there) should be of a great concern to bullish investors.
This $NYA200R chart below is the percentage of stocks above the 200 DMA and is always a good statistic to follow. It can depict a trend of declining equities which is always troubling, especially when it drops below 60% – 55%. Dropping below 40%-35% signals serious continuing weakness and falling averages.
Today it represents the lowest levels seen since the beginning of the October, 2011 rally. Eric Parnell says, ‘ If nothing else, given that relatively fewer stocks are trading above their 200-day moving average at a time when the market is just off of its all-time highs suggests that an increasingly narrowing group of stocks is driving the rally at this stage, which does not bode well for the future sustainability of the uptrend.” It also strongly suggests there has been a ‘stealth bear market’ underway in recent months.
StockChart.com NYSE % of stocks above 200 DMA Index ($NYA200R) is at 32.01 %. (Chart Here) Unless this downward trend reverses itself soon, we are going to see further downside. The next support is ~37.00, ~25.00 and ~15.00 below that. December, 20012 was the last time we saw numbers this low.
The Most Important Chart On Wall Street (NYA)
The arrows in the chart below show levels that have acted as support and resistance since 2006. The two blue lines intersect near 10,301. As long as 10,301 holds, the odds of a rally taking place will be higher. If 10,301 fails to attract support from buyers, then the bullish push higher in early 2014 could be classified as a “failed breakout”, which would increase the odds of bad things happening in the weeks ahead.
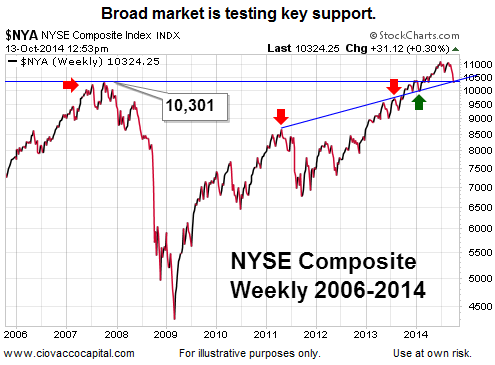
StockChart.com NYSE Composite (Liquidity) Index ($NYA) is at 10234. (Chart Here) Next stop is 9750, then 9250, and 8500.
Eric Parnell, in his timely article below points out the obvious and we may very well see the starting of it right now.
The Slow And Perilous Death Of Bull Markets
Summary
A primary worry among many stock investors today is that the long running bull market may soon come to an end.
At the heart of their concern is the worry that the subsequent decline into the next bear market could quickly become swift and severe.
History has shown that the transition from a bull market to a bear market is a process filled with rallies and correction that plays out over an extended period of time.
Bull markets die long slow deaths, and it is this prolonged dying process that causes so many investors to find themselves unwittingly trapped in the next bear market.
A primary worry among many stock investors today is that the long running bull market may soon come to an end. At the heart of their concern is exactly what lies beyond the bull market peak, as many worry that the subsequent decline into the next bear market could quickly become swift and severe.
But history has shown that the transition from a bull market to a bear market is often a gradual and drawn out process filled with rallies and correction that plays out over an extended period of time. In short, bull markets die long slow deaths, and it is this prolonged dying process that causes so many investors to find themselves unwittingly trapped in the next bear market long before they even realize it.
It is still possible that Mr. Market is not through playing with the averages and even newer historical highs are a distinct possibility. Historically, accordingly to Eric Parnell, “major bull markets have almost never reached their final peak in a sideways grinding pattern. Instead, they have almost always peaked with flourish including one final crescendo toward a new all-time high before finally rolling over and succumbing to the forces of the new bear market”.
The longer 6 month outlook is now 30–70 sell (probably should be 20-80 sell) and will remain bearish until we can see what the effects are in the Fed’s game plan. Sooner or later brighter skies will return over the market. Until then, investors should employ the first thing one learns while in a foxhole; keep their head down.
The DOW at 10:15 is at 16338 up 222 or 1.38%.
The SP500 is at 1889 up 26 or 1.40%.
SPY is at 188.85 up 3 or 1.38%.
The $RUT is at 1097 up 11 or 0.99%.
NASDAQ is at 4279 up 61 or 1.45%.
NASDAQ 100 is at 3823 up 59 or 1.58%.
How the Popular ‘VIX’ Gauge Works
$VIX ‘Fear Index’ is at 20.76 down 4.44 or -17.62%. Bullish Movement
(Follow Real Time Market Averages at end of this article)
The longer trend is up, the past months trend is negative, the past 5 sessions have been net negative and the current bias is positive.
Saudi Arabia has reportedly been telling oil-market investors and analysts that it is ready to accept oil prices below $90 per barrel, and even as low as $80, for up to a year or two. If true, it would represent a major change in policy for Riyadh, which may be looking to slow the expansion of rivals such as the U.S.
WTI oil is trading between 84.42 (resistance) and 82.53 (support) today. The session bias is elevated, trending down and is currently trading down at 83.17. (Chart Here)
Brent Crude is trading between 87.19 (resistance) and 85.49 (support) today. The session bias is elevated, trending down and is currently trading down at 86.00. (Chart Here)
Why Gold Will Rise When The Dollar Falls
– and –
The general consensus is that gold prices will actually fall in the next twelve months (Sept to Aug. 2015). Goldman Sachs estimates that gold will fall to $1,050 an ounce, a drop of nearly 19%.
Gold fell from 1242.16 earlier to 1233.12 and is currently trading down at 1234.20. The current intra-session trend is negative. (Chart Here)
Currency Corruption Weighs on Copper
Dr. Copper is at 2.998 rising from 2.951 earlier. (Chart Here)
The US dollar is trading between 85.31 and 84.85 and is currently trading down at 85.27, the bias is currently positive. (Chart Here) Resistance made in Aug., 2013 (~85.00) has been broken and now is support. Support has been tested several times and has held.
The markets are still susceptible to climbing on ‘Bernankellen’ vapor, use caution!
“Investors should remember that excitement and expenses are their enemies. And if they insist on trying to time their participation inequities, they should try to be fearful when others are greedy and greedy only when others are fearful.” – Warren Buffett
If you would like to get advanced buy/sell tweets, sign-up in the column to the right of this post by clicking on the ‘Follow‘ button. Write me with suggestions and I promise not to bite.
Real Time Market Numbers
To contact me with questions, comments or constructive criticism is always encouraged and appreciated:
Written by Gary


