Money Morning Article of the Week
by Peter Krauth, Money Morning
While gold price trends mostly stem from changes in supply and demand, that’s not the full story. Sometimes the value of the U.S. dollar changes the gold price – and this can cause a misleading view of the true value of gold…

You see, most of us track gold priced in U.S. dollars. As the dollar gains strength, it takes fewer of them to buy the same quantity of gold. The opposite is true when the dollar weakens.
Part of the reason gold prices move up or down is they reflect this change in U.S. dollar value. So higher gold prices do not always mean higher demand.
But if gold prices rise not just in U.S. dollars, but in other major currencies, you know that higher demand is a factor.
Determining how much a change in the gold price is caused by U.S. dollar fluctuations helps to measure the true value of gold. And there’s a tool that does just that.
Here’s how it works…
Gold Price Trends: Using the KGX
Kitco, a Canadian gold dealer, has a great website that tracks all things gold.
They’ve developed the Kitco Gold Index (KGX). KGX provides the price of gold measured in the U.S. Dollar Index.
The U.S. Dollar Index is a basket of major currencies weighted as follows: 57.6% euro, 13.6% Japanese yen, 11.9% U.K. pound, 9.1% Canadian dollar, 4.2% Swedish krona, and 3.6% Swiss franc.
Essential Reading: Gold continues to be the best crisis hedge investment – but only if you know how to avoid buying fakes. Gold counterfeiters are busier than ever looking for their next victim. Here are the seven best ways to tell if your gold is the real deal.
That means the Kitco Gold Index measures the price of gold in terms of six major global currencies – not just the U.S. dollar.
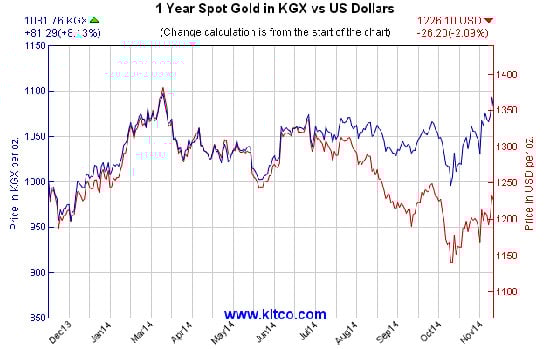
As you can see from the chart below, as of mid-December, gold had remained relatively steady, and even gained so far last year, when measured in the basket of major currencies detailed above.
KGX also includes a table near the top of the page, which looks like this:
| Gold price change due to weakening of USD | +3.90 |
| Gold price change due to predominant buyers | +44.60 |
| Gold price total change | +48.70 |
This table separates the effects of a strengthening or weakening U.S. dollar on movement of the gold price. The balance of the movement comes from either net buying or selling pressure.
The numbers shown in the table above are a snapshot from Dec. 1, the day immediately following the Swiss gold referendum I discussed in early December.
Gold dropped down close to $1,140 on the evening of Sunday, Nov. 30, after the Swiss referendum. But then it climbed steadily throughout the next day all the way up to $1,220, for an $80 swing.
The table captures some of that gain at one point on Dec. 1.
As you can see from the numbers, the major bounce in the gold price that day, despite a weaker dollar, was overwhelmingly due to increased buying activity.
This was likely because of bargain hunting at the temporarily low price.
This index is extremely helpful when looking at gold price trends in 2015. Today it shows how gold is up $5.70 so far. The gold price would actually be up $7.50 as a result of increased demand. But strengthening of the U.S. dollar is lowering the price by $1.80. This brings us to a total price increase of $5.70.


