


by Salil Mehta, Statistical Ideas
From Berkshire Hathaway’s recent 2013 Annual Report:
“Charlie Munger, Berkshire’s vice chairman and my partner, and I believe both Berkshire’s book value and intrinsic value will outperform the S&P in years when the market is down or moderately up. We expect to fall short, though, in years when the market is strong – as we did in 2013. We have underperformed in ten of our 49 years, with all but one of our shortfalls occurring when the S&P gain exceeded 15%.”

On one hand, Warren Buffett has had some incredible performance for 49 years. On the other hand, his probabilistic comments concerning performance falls short of expectations. Is a S&P gain exceeding 15% (>15%) considered “strongly up”? If Buffett underperformed nearly 1/5 of the time, then we might think a “strongly up” market is a threshold only achieved in about 10 of the past 49 years. But in fact, a S&P rise >15% is far more commonplace, occurring in 24 of the past 49 years (nearly half the years). So the quote above has the same absurd utility as a politician stating he or she doesn’t always lie, but when he or she does it mostly happens in the even numbered years (e.g., 2008, 2010, 2012, etc.) And then you have to fret over which year that politician made the statement…
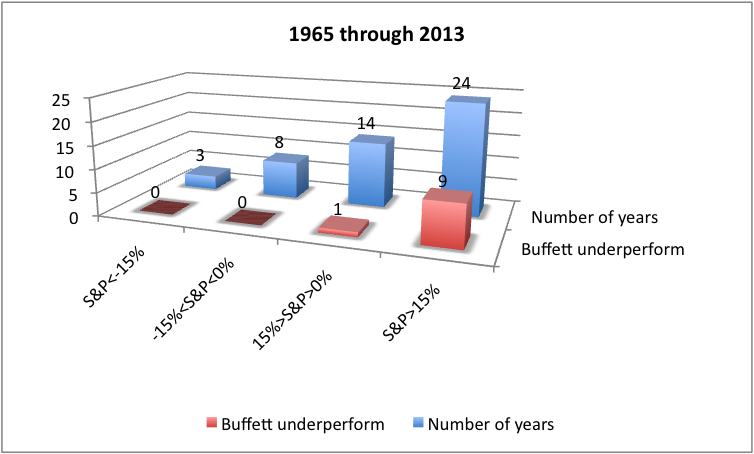
See the descriptive chart above for the annual frequency count of S&P performance, and the frequency count for Buffett’s underperforming years. Now some can be thinking, among other things, that underperformance in those 24 years was only 9 times (so just 38% of the time).
The issue with this line of thinking is that it implies there is homogeneity in this underperformance relative to the S&P’s >15% annual performance. Here too, the underlying statistics fall apart. Let’s decompose this chart above and isolate Buffett’s performance during the past 5 years. We see in the chart below that 4 of the 9 years that Buffett has underperformed, during “strongly up” years, were in just the past 5 years. And there were 4 “strongly up” years in the past 5, so Buffett didn’t underperform 38% of the time then, but 100% of this time (4 of 4).
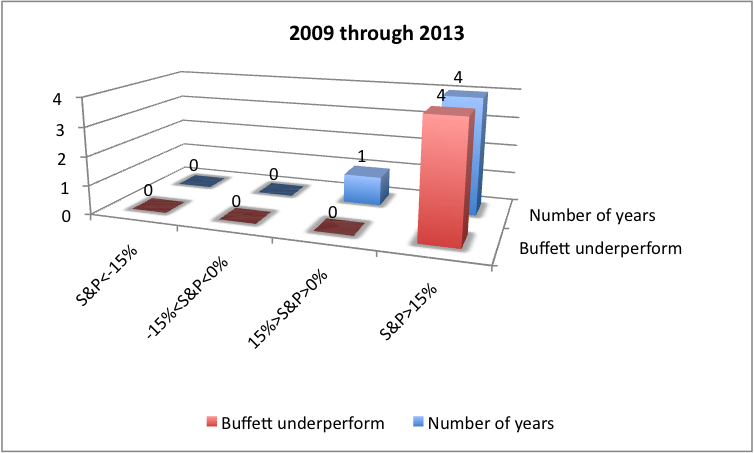
More broadly, nearly half of this “strongly up” deterioration, in Buffett’s 49 year investment history, has happened in just the past 5 years (4 of 9). See the green triangle data, in the lower-left of the chart here. Certainly that should have been part of the quote above.
And, could this performance have something to do with the strong run in the S&P during the past five years? Once again this is false. We also show below the segmentation of the top chart, with two other five-year timeframes. In the charts below we see in 1995 through 1999, only 1 of 5 “strongly up” years did Buffett underperform (so down to 20%, from 100%). And further back in time, from 1984 through 1988, none of 3 “strongly up” years did Buffett underperform (so now down to 0% of these times).


So if we see anything, from the time frame decomposition, it is that Buffett’s underpeformance has simply taken some lumps along with everyone else with such a lengthy investment career. His performance is great, but the quote above in the annual report is poor. An analyst should interpret the biased quote as misleading statistics.
Beyond this, if statistical mean-reversion has anything to say about market patterns, then Buffett should experience continued underperformance at the same good rate (10 of 49 is slightly higher than we’re used to from Buffett, but it’s still great overall) in the future. This would be true even if the annual up-streaks in the market dissolve back to a more normal, efficient market pattern.
Also from the Berkshire Hathaway’s report:
“If you instead focus on the prospective price change of a contemplated purchase, you are speculating. There is nothing improper about that. I know, however, that I am unable to speculate successfully, and I am skeptical of those who claim sustained success at doing so. Half of all coin-flippers will win their first toss; none of those winners has an expectation of profit if he continues to play the game.“
This is problematic as Buffett is reducing all speculators (though sheltering active investors from this characterization) to 50/50 flippers of fair coins. And even still, there are gambling strategies to convert various random walk (e.g., a jagged pattern of walking in either direction, similar to the sequence of outcomes from coin flips) into profitable trading strategies. See this publication ( here, and here), which is in two leading academic research databases (one in science, and one in economics).
Additional notes: In terms of these coin tossing probabilities, we can give Buffett the benefit of the doubt and suggest his overall performance is similar to that from an unfair coin that lands on heads 80% of the time (reflecting the ratio of Buffett’s 39 out of 49 years of outperformance). The probability of such an unfair coin landing on heads at least 39 times out of 49 flips is 61%. This is simply the combination of choosing n=39 from 49 (or 49C39), multiplied by 80%n, multiplied by (100%-80%)49-n. Then we sum this for n=39, to 49. For more on combinatorial probabilities, one can optionally see these notes (here, and here)
So now the chance of seeing the 5-year “abberative” streak, of at least 4 losses in 5 years (either at the start or the conclusion of a 49-year pattern) would come to roughly 3%. This can be solved at least two general ways, using both a combinatorial mathematics estimate and another with a difference in means estimate (or a t-distribution test). The bottom line is that we can best explain the pattern with an unfair coin analogy, and even then it is rare to see such a dichotomous drop-off at one end to be simply a normal (non-significant) continuation of the other 44-trials period.
There are also multiple other ways to look at this, and some are not so meaningful. What would lose statistical credibility, for example, is if one were to go above and beyond these paragraphs, and suggesting there is one pattern completely flanked by a different pattern.


