


Econintersect Weather and Climate Forecast Update, 02 June 2014
Written by Sig Silber
Let’s talk more about El Nino

Supposedly one is coming. Of course that is a probability situation but at this point quite likely. What is less clear is how strong it will be. What is the difference between a strong and weak El Nino and what difference does it make? That is topic of this week’s Weather Forecast and Climate Report which discusses new research findings. This week’s report also contains the updated June Outlook from NOAA.
I am not sure that I made it clear that the paper on the Albuquerque National Weather Service web site which can be found here is new research. The connection of the North American Monsoon with ENSO has long been debated with lack of agreement on the connection if any. This report appears to clarify the situation.
Obviously the North American Monsoon is of great interest to those living in the Southwest but in the weeks ahead I hope to be able to link it to the summer conditions on the Great Plains and the impact on our major grain crops.
Monsoons like many weather patterns are influenced by the location and strength of certain semi-permanent high and low pressure areas. I am not a meteorologist but from the literature I conclude that with respect to the North American Monsoon, the major features are:
A. The Azures High usually in the U.S. referred to as the Bermuda High
B. A Low Pressure area in Northern Mexico caused by the differential between land and ocean temperatures in the summer being higher thus essentially sucking in moisture from the Pacific and to a lesser extent the Gulf of Mexico
C. What sometimes is called the Monsoonal Ridge which really is a High Pressure area sometimes called the Four Corners High as it is frequently located in the vicinity of where Utah, Colorado, Arizona and New Mexico meet.
D. A Low Pressure Area over the Pacific Northwest.
Remembering that high-pressure areas have clockwise movement and disperse air at ground level away from the high while low-pressure areas have counter-clockwise movement of air and tend to draw in air (and moisture) at ground level and all wind movements in the Northern Hemisphere tend to bend to the right due to the Coriolis Effect, one can see that the position and strength of these four features determines who gets most wet especially north of Mexico where the Monsoon is actually established and is called the Mexican Monsoon or the Sonoran Monsoon. In the above graphics the features are shown at a certain point in time, I believe mid-Monsoon, but it is not a static situation and the features move around in some cases (e.g. the Bermuda High) have a fairly well defined and predictable seasonal route. Plus you have the occasional tropical disturbances coming in from east or west enhancing the moisture supply to the process. So it is a very dynamic situation.
What is interesting in the Albuquerque Weather Service new report on the Monsoon is that they have identified the difference in this pattern between strong Monsoons and weak to moderate Monsoons. This provides some guidance as to how the various strength Monsoons might differentially impact New Mexico versus Arizona and by extension some other states further north. The report also takes a look at what combination of sea surface temperatures are most likely to be associated with strong versus weak to moderate El Ninos. The full report is linked above and again here but to me this set of graphics is most interesting.

Click here for a larger Image.
I prefer that you read the report but you can see from these graphics that the relative benefit re precipitation for New Mexico as compared to Arizona and other nearby states may be more complicated than commonly understood and even described in the literature. One other relevant comment that always applies when discussing weather is that the atmosphere has three dimensions and most graphics only show two dimensions. It is very important with respect to the Monsoon as I believe the Gulf of Mexico moisture has to come in at high elevations and circle around to really enter the process due to the mountain ranges in Mexico. Terrain is a key controller of this process and the mechanism for generating much of the precipitation and the pattern of precipitation throughout the day which varies based on where one is located.
This new understanding also sets the stage for addressing the question of the impact of Anthropogenic Climate Change on the Monsoon. Here is an older analysis of that issue:
f. Paleoclimate studies
The focus of this review is on the modern NA monsoon, but a number of studies utilizing proxy data include description of summer paleoclimate in the southwestern United States (e.g., Wells 1979; van Devender and Spaulding 1979; Davis and Shafer 1992). Briefly, paleoenvironmental conditions consistent with a circulation similar to the modern NA monsoon were present about 10,000 to 8,000 BP, or roughly 10,000 yr after the last glacial maximum (van Devender and Spaulding 1979; Davis and Shafer 1992). Prior to this time, the presence of the Laurentide ice sheet over eastern North America delayed the development of the Bermuda high and associated summer rains west of the Continental Divide (van Devender and Spaulding 1979). The period since the establishment of a monsoon-like circulation has included intervals considerably wetter and drier than those found in the instrumental record (Davis 1994; Petersen 1994). In general, the atmospheric controls on the paleomonsoon are assumed to be fundamentally the same as those for the modern monsoon (i.e., position and strength of subtropical highs and associated latitudinal position of the westerlies), with changes in their relative location and intensity causing the observed long-term variability.
As we begin to address the impact of Anthropogenic Climate Change on the North American Monsoon, one might expect focus on the reduction in Arctic Ice. I have noticed what appears to me to be more of an impact of the Arctic Oscillation (AO) and North American Oscillation (NAO) on Rocky Mountain lee-side cold fronts which in New Mexico appear to be back-door cold fronts as they approach from the northeast rather than from the west. The possible impacts on wind patterns coming off the Pacific would appear to be other factors that we are likely to be hearing more about over time.
New Outlook for June
Just Issued on Saturday.
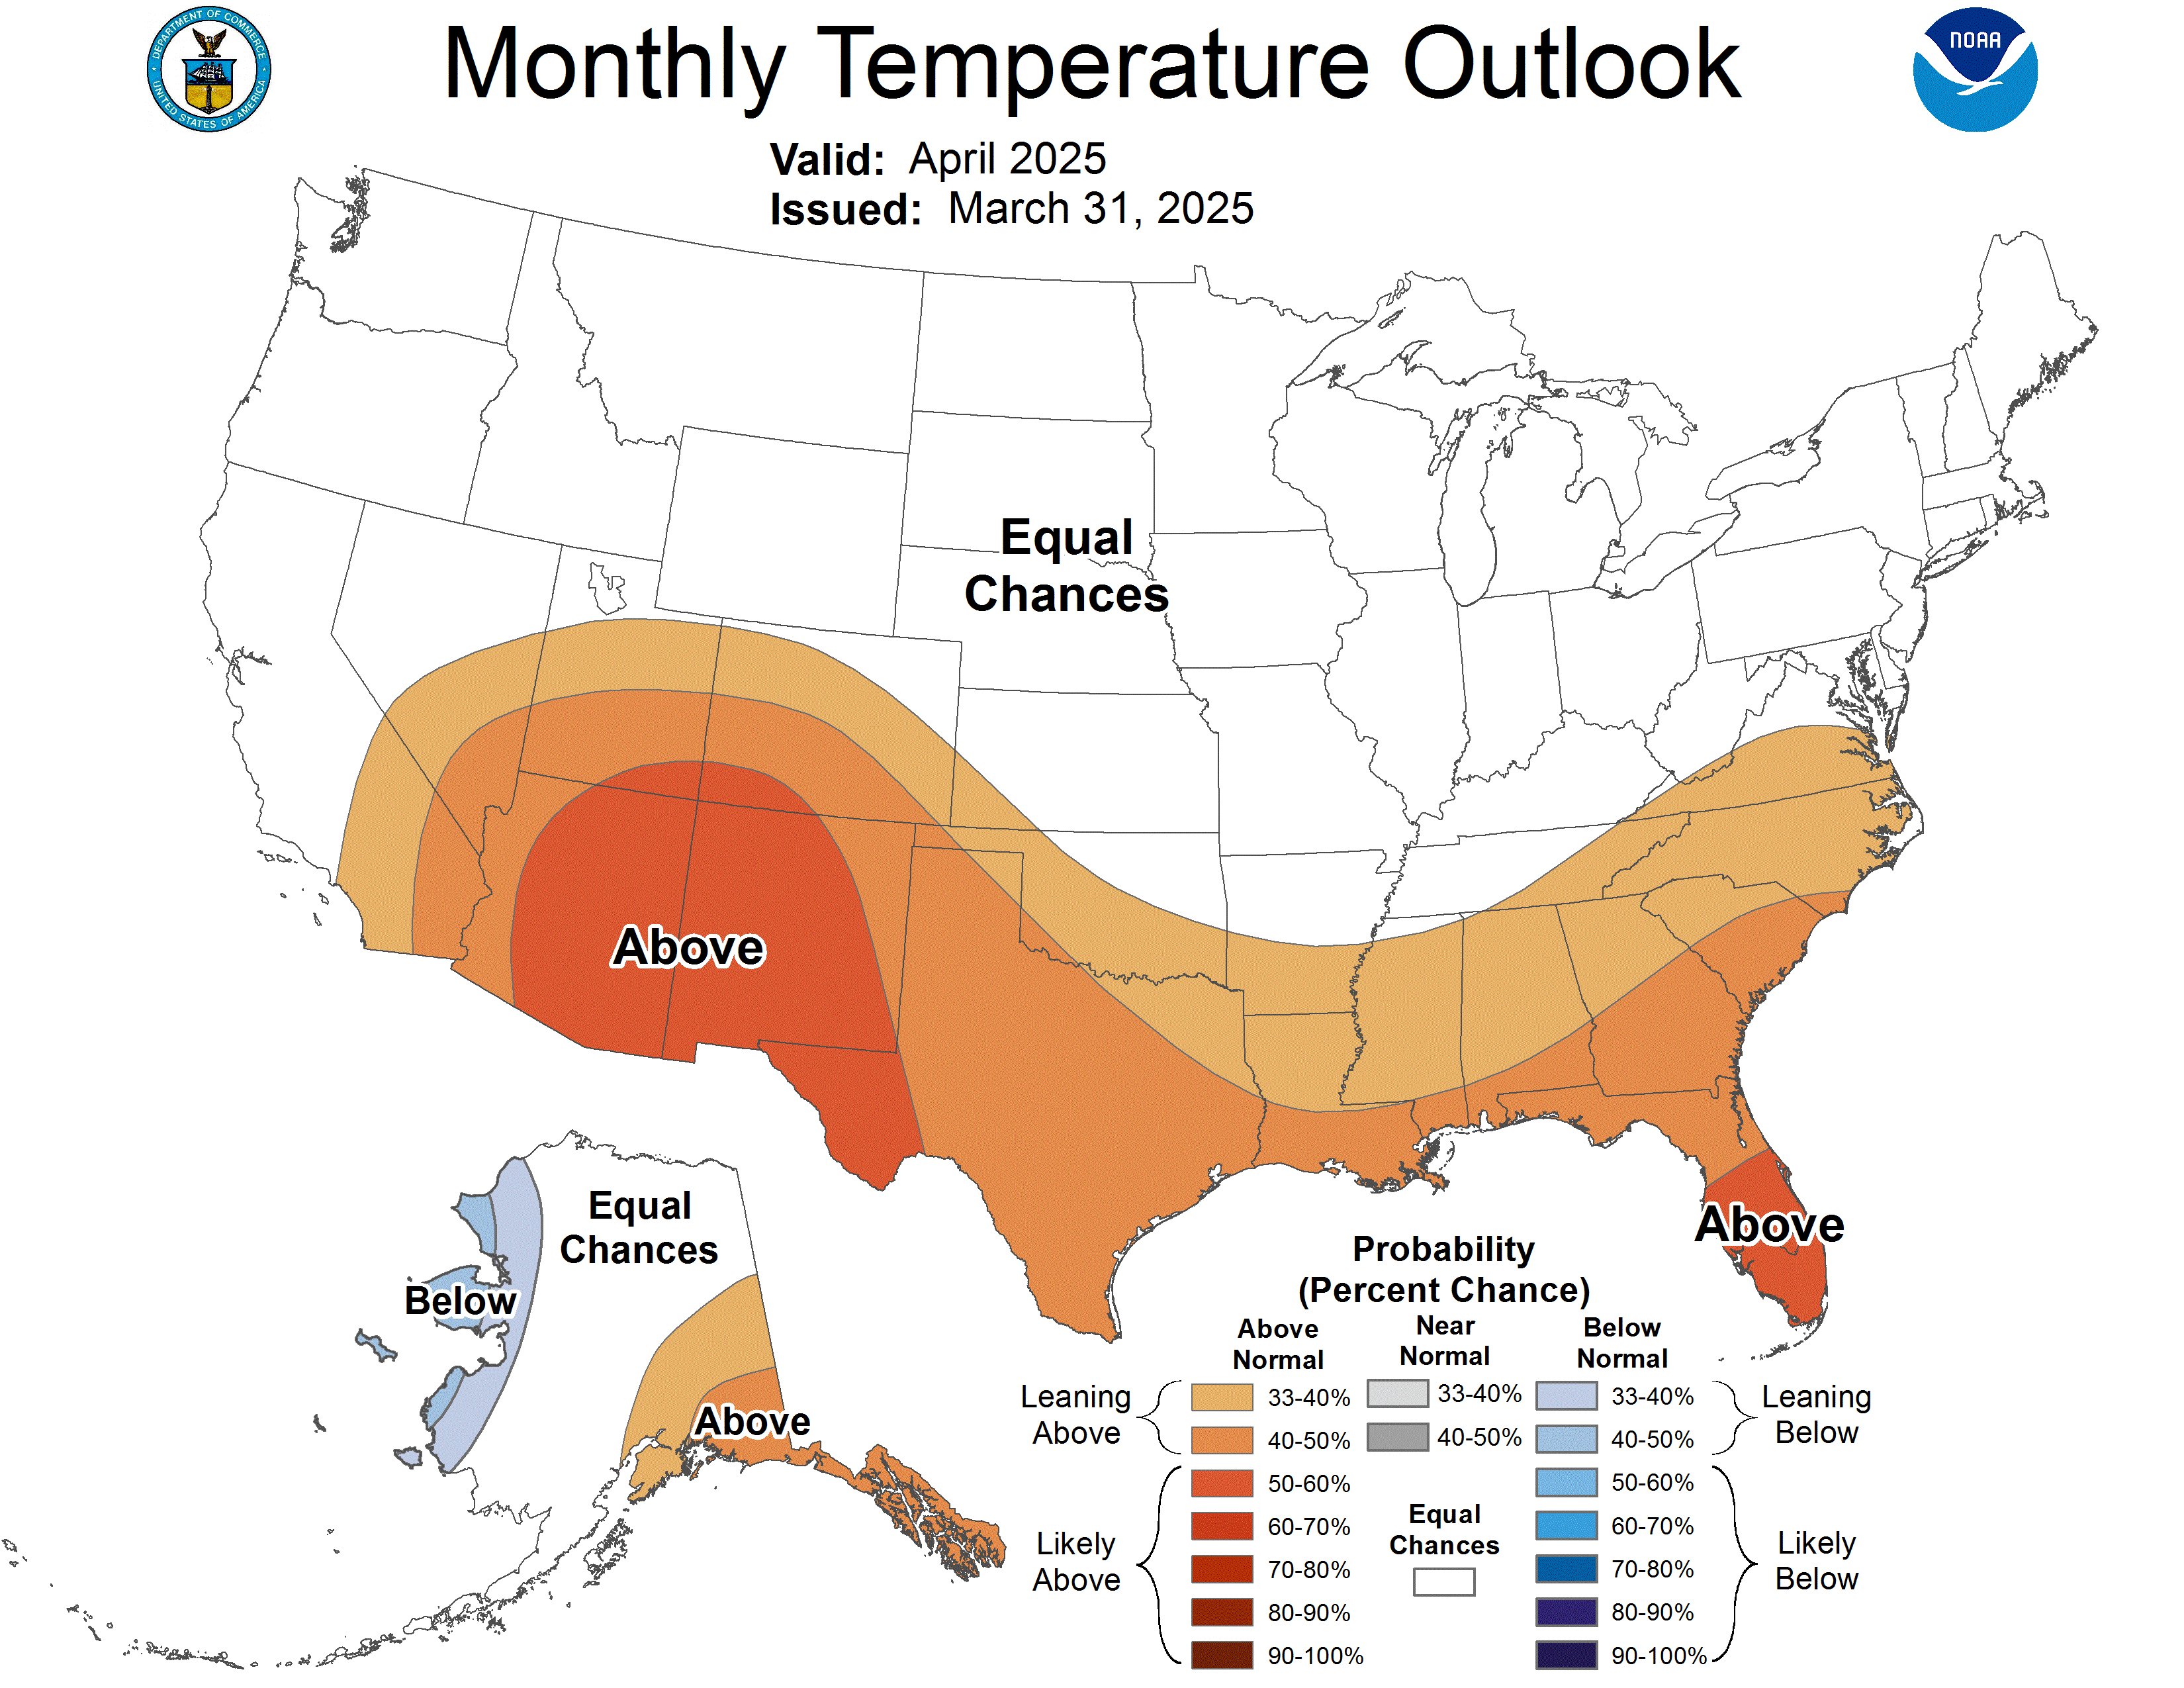
Here is the old temperature outlook:

And here is the new
Here is the old precipitation outlook:

And here is the new
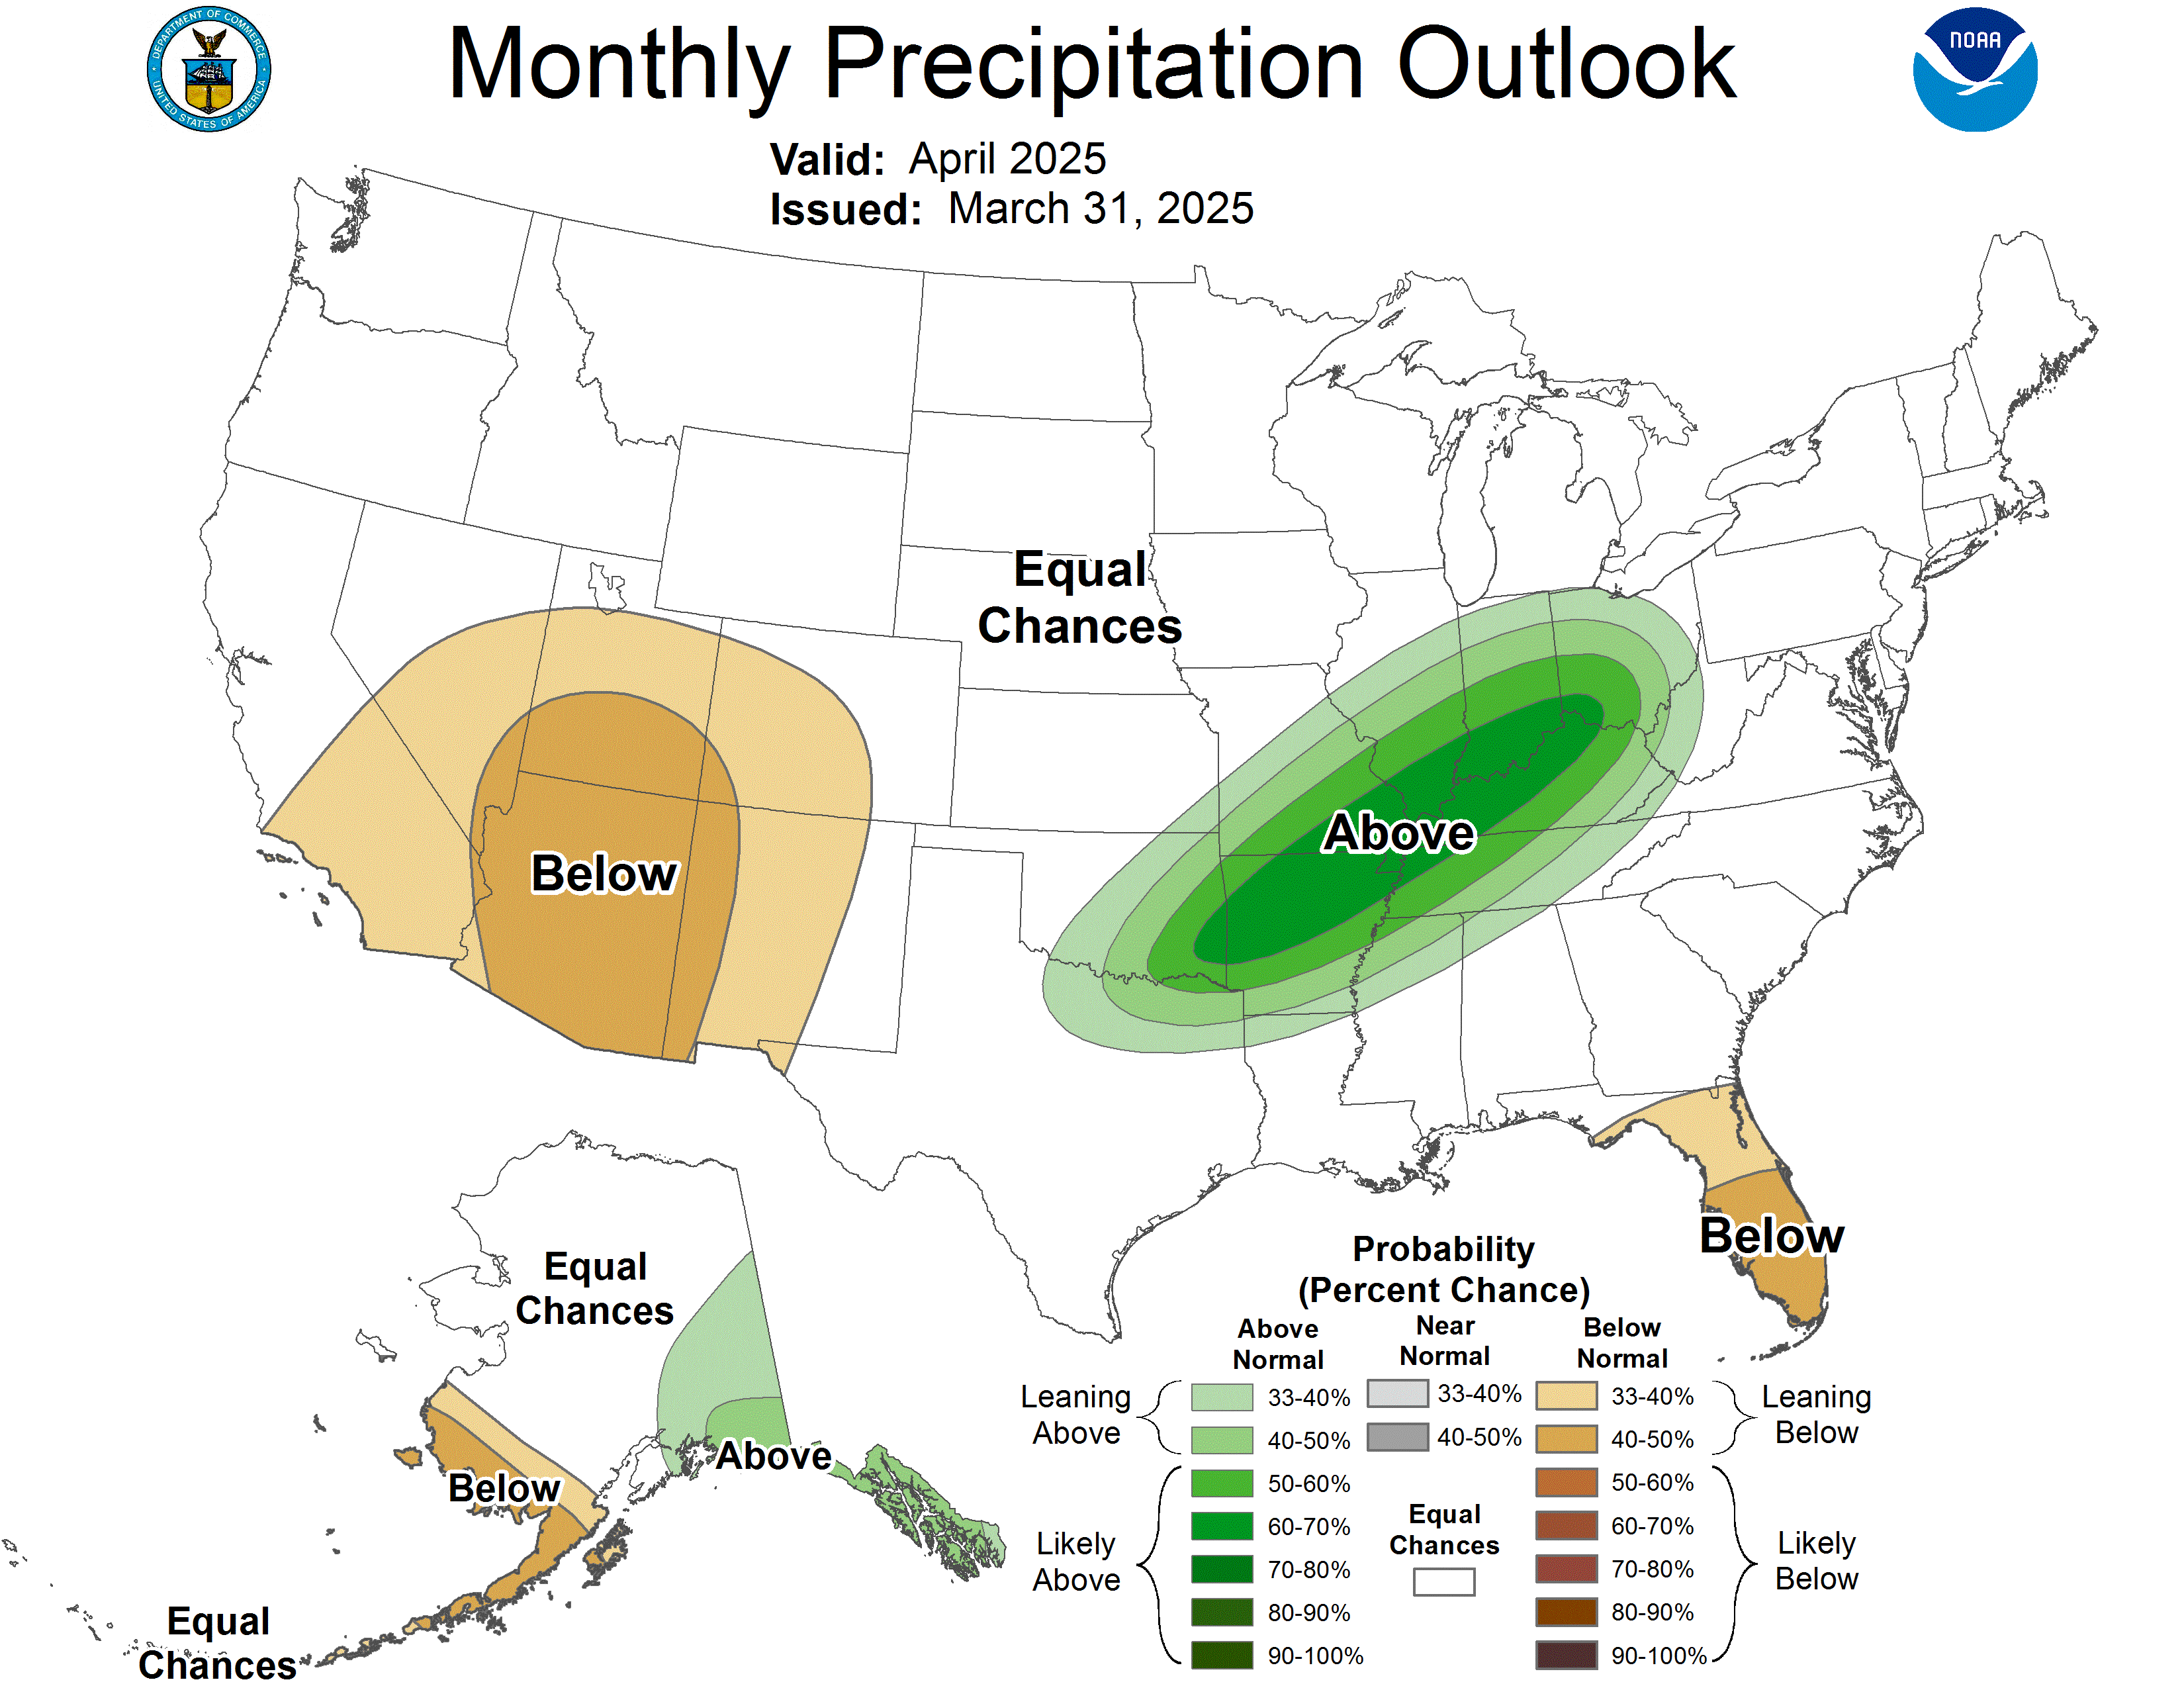
There has been almost no change in the forecast for June since it was issued on May 15. Are these NOAA folks good or what? You can see the same assessment for the first half of the month in the 6 – 14 forecast that you can find if you proceed to go to the below link. There are some differences but they are minor and mainly impact the temperature outlook for the southern part of the Conterminous U.S. (CONUS).
Click here for the latest data from NOAA (National Oceanic and Atmospheric Administration) and other sources on the Econintersect Weather and Climate page.


