
by Menzie Chinn, Econbrowser.com
Appeared originally at Econbrowser 07 January 2015
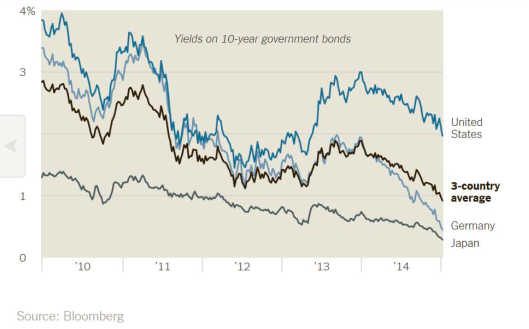
In today’s NY Times, Peter Eavis writes about the message in “soaring bond prices”:
…a huge bond market with a strong track record for predicting economic problems is flashing a warning sign right now. … The prices of Treasury bonds are rallying fiercely.

Source: Peter Eavis, “Soaring Bond Prices May Sound an Economic Warning,” NY Times, 7 January 2015.
Over the longer term, the nominal yield should match the nominal GDP growth rate; however, in terms of indicators of recessions, the term premium is more typically examined. And here, there is some indication of a slowing. Figure 1 shows spreads for 10 year-3 month Treasurys and 10 year-2 year Treasurys.
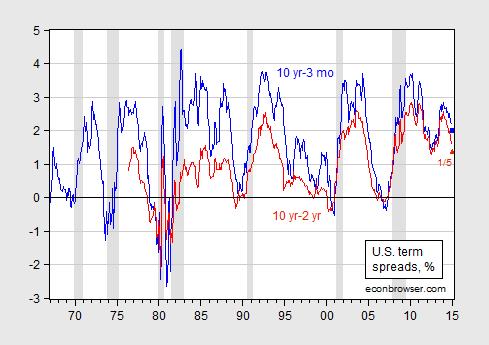
Figure 1: Ten year minus three month Treasury yields (blue), and ten year minus two year Treasury yields (red). Observation for January is for 1/5/2015. NBER defined recession dates shaded gray. Source: Federal Reserve Board via FRED, NBER, and author’s calculations.
Both the 10yr/3mo and 10yr/2yr spreads remain positive.
Of course, one problem is that we’ve hit the zero lower bound, so that it might be the case that the relationships that obtained before don’t anymore; in particular, the flattening of the yield curve might not signal incipient Fed tightening (as much as in the past).
One could appeal to real yield spreads (see Figure 2), but we don’t have enough of a track record to be able to infer much about future growth.
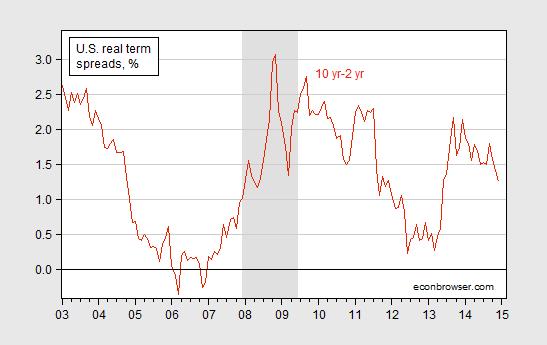
Figure 2: Ten year TIPS minus two year Treasury yields minus Cleveland Fed expected inflation measure (dark red). NBER defined recession dates shaded gray. Source: Federal Reserve Board via FRED, Cleveland Fed, NBER, and author’s calculations.
The absence of such a track record with the real yield curve suggests appealing to the standard (nominal) yield curve. Chinn and Kucko (2014) provide a series of probit estimates of the link between the spread and recession (using NBER indicators). Using the estimates for the 1998-2013 period (Table 9), the values as of 1/5/2015 indicate an 11% probability of recession in the next 12 months. However, the adjusted R2 is only 0.19.
Based on the 1/5 values, the point estimate for growth in industrial production over the next 12 months is around 2% (Table 3).
Note that aside from the ZLB constraint, another problem with interpreting the outlook based upon historical correlations is other things that might have expected the behavior of the yield curve. If the expectations hypothesis of the term structure is not the only determinant of long term rates, and some version of the preferred habitat model obtains, then it could be that long term rates are depressed due to excess savings from abroad. That is a theme that we’ve been discussing for a long time, [1] [2] but now it’s exacerbated by the flight to safety.
Ten year-three month term premia in Japan and Germany remain (just barely) positive.
Update: Using the Xia-Wu shadow Fed funds rate instead of the standard Fed funds rate results in a much steeper yield curve, as shown in Figure 3.
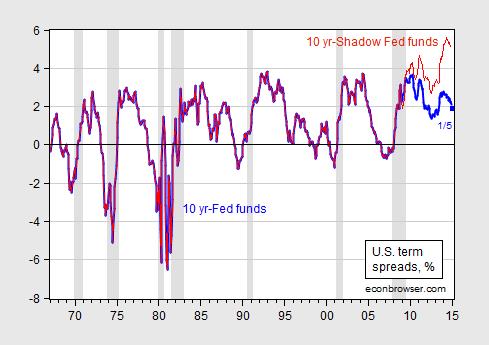
Figure 3: Ten year yield minus effective Fed funds rate (blue), and ten year minus Xia-Wu shadow Fed funds rate (red). Observation for January is for 1/5/2015. NBER defined recession dates shaded gray. Source: Federal Reserve Board via FRED, NBER, Xia-Wu, and author’s calculations.


