Written by Steven Hansen
This past week we released our economic forecast for August which is indicating the weakest growth since 2010. There are forces working against economic expansion on Main Street.

Also this past week, there was a major decline in the Conference Board Consumer Confidence index. What caused this decline? Consider that Main Street does not react to what is going on in Greece – it reacts to changes in costs and income – or its perception of items which could effect income or spending.
Income Ratio to Spending
The consumer is still consuming although the consumer’s spending relative to income has been elevated since Jan 2013. There has been only four periods in history where the ratio of spending to income has exceeded 0.92 (April 1987, the months surrounding the 2001 recession, from September 2004 to the beginning of the 2007 Great Recession, and for some occasions since late 2013). A high ratio of spending to income acts as a constraint to any major expansion in consumer spending.
Seasonally Adjusted Spending’s Ratio to Income (a increasing ratio means Consumer is spending more of Income)

Econintersect views this chart as a major obstacle for economic expansion. Currently both income and expenditures are growing at approximately the same rate – and income must grow much faster to reverse this headwind. Further, consider that consumer credit is growing faster than GDP and consumer income. This erodes the ability of consumers to spend more in the future.
Relationship of Retail Sales to Employment
The beginning of an economic expansion sees the growth rate of retail sales improving faster than the growth rate of employment. This is logical as consumption drives employment. At the end of an expansion cycle – consumption growth slows relative to employment.
What is the current relationship between the year-over-year growth rate of non-farm private employment and the year-over-year real growth rate of retail sales? This index is currently negative. When retail sales grow faster than the rate of employment gains, this ratio will be above zero (on the below graph).
Growth Relationship Between Retail Sales and Non-Farm Private Employment – Above zero suggests economic expansion
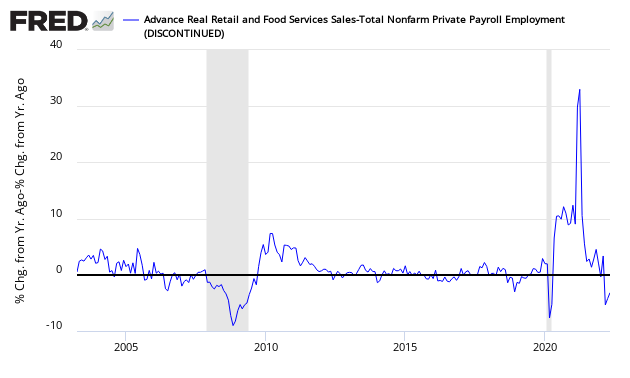
The above chart is indicating the USA is in the later phase of an expansion cycle. Does this mean a recession is eminent? – no, a recession can be years away. But it does indicate a weakening phase in the economic cycle.
Our Take-Away
We are not seeing any fundamental which suggests the USA is near a recession but are not seeing any dynamic which suggests economic activity will improve either.
Other Economic News this Week
The Econintersect Economic Index for August 2015 declined to the lowest level since April 2010. The tracked sectors of the economy remain relatively soft with most expanding at the lower end of the range seen since the end of the Great Recession. This economic index has been in a long term decline since late 2014.
The ECRI WLI growth index is now in positive territory but still indicates the economy will have little growth 6 months from today.
Current ECRI WLI Growth Index

The market was expecting the weekly initial unemployment claims at 270,000 to 275,000 (consensus 272,000) vs the 267,000 reported. The more important (because of the volatility in the weekly reported claims and seasonality errors in adjusting the data) 4 week moving average moved from 278,500 (reported last week as 278,500) to 274,750. The rolling averages generally have been equal to or under 300,000 since August 2014.
Weekly Initial Unemployment Claims – 4 Week Average – Seasonally Adjusted – 2011 (red line), 2012 (green line), 2013 (blue line), 2014 (orange line), 2015 (violet line)

/images/z unemployment.PNG
Bankruptcies this Week: Privately-held Relativity Media


