


Written by Steven Hansen
 The ISM Manufacturing survey for March 2014 indicated marginal manufacturing growth expansion. The New Orders sub-index which historically correlates to the economy also improved.
The ISM Manufacturing survey index (PMI) improved marginally from 53.2 to 53.7 (50 separates manufacturing contraction and expansion). This was within expectations which were 51.5 to 54.7 (consensus 54.0).
This index had been in a general downtrend since mid 2011. This is the tenth month of expansion. The regional Fed manufacturing surveys were mostly indicating growth in March, and now the ISM indicates manufacturing shows expansion in March.

Relatively deep penetration of this index below 50 has normally resulted in a recession.
The noisy Backlog of Orders improved from 52.0 to 57.5 – showing growth. Backlog growth is an indicator of improving conditions; a number below 50 indicates contraction. Backlog accuracy does not have a high correlation against actual data.
Economic activity in the manufacturing sector expanded in March for the 10th consecutive month, and the overall economy grew for the 58th consecutive month, say the nation’s supply executives in the latest Manufacturing ISM® Report On Business®.
“The March PMI® registered 53.7 percent, an increase of 0.5 percentage point from February’s reading of 53.2 percent, indicating expansion in manufacturing for the 10th consecutive month. The New Orders Index registered 55.1 percent, an increase of 0.6 percentage point from February’s reading of 54.5 percent. The Production Index registered 55.9 percent, a substantial increase of 7.7 percentage points compared to February’s reading of 48.2 percent. Employment grew for the ninth consecutive month, but at a lower rate by 1.2 percentage points, registering 51.1 percent compared to February’s reading of 52.3 percent. Several comments from the panel reflect favorable demand and good business conditions, with some lingering concerns about the particularly adverse weather conditions across the country.”
Of the 18 manufacturing industries, 14 are reporting growth in March in the following order: Petroleum & Coal Products; Transportation Equipment; Furniture & Related Products; Paper Products; Printing & Related Support Activities; Plastics & Rubber Products; Fabricated Metal Products; Machinery; Textile Mills; Computer & Electronic Products; Nonmetallic Mineral Products; Food, Beverage & Tobacco Products; Chemical Products; and Primary Metals. The four industries reporting contraction in March are: Apparel, Leather & Allied Products; Wood Products; Electrical Equipment, Appliances & Components; and Miscellaneous Manufacturing.

It is interesting to note that ISM Manufacturing represents less than 10% of USA employment, and approximately 20% of the business economy. Historically, it could be argued that the production portion of ISM Manufacturing leads the Fed’s Industrial Production index – however the correlation is not strong when looking at trends.
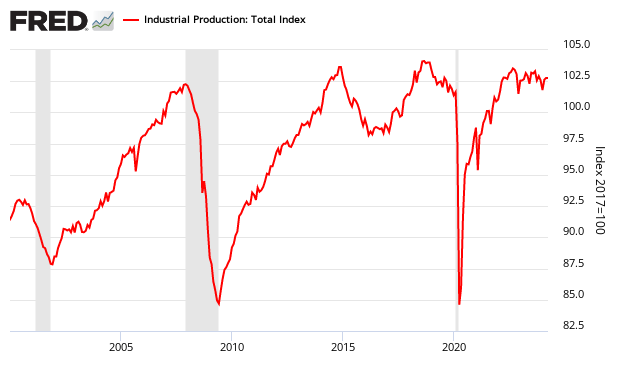
New orders have direct economic consequences. Expanding new orders is a relatively reliable sign a recession is NOT imminent. However, New Orders contraction have given false recession warnings twice since 2000.

However, holding this and other survey’s Econintersect follows accountable for their predictions, the following graph compares the hard data from Industrial Products manufacturing subindex (blue bar) and US Census manufacturing shipments (red bar) to the ISM Manufacturing Survey (purple bar).
Comparing Surveys to Hard Data


/images/z survey1.png
Caveats on the use of ISM Manufacturing Index:
This is a survey, a quantification of opinion – not facts and data. However, as pointed out above, certain elements of this survey have good to excellent correlation to the economy. Surveys lead hard data by weeks to months, and can provide early insight into changing conditions.
Many use ISM manufacturing for guidance in estimating manufacturing employment growth. Econintersect has run correlation coefficients for the ISM manufacturing employment and the BLS manufacturing employment data series above going back to 1988, using quarterly data. The coincident correlations are actually negative, but poor (r = -0.2 to -0.4 for various time periods examined). See here for definitions.
Before 2000 the ISM employment data had a weak positive correlation to the BLS data 4 to 7 quarters later (r values above 0.6). Since 2000 the correlations for ISM manufacturing employment as a leading indicator for the BLS manufacturing employment have been between 0 and 0.3 for r (correlation coefficient). These values define correlations as none to poor.
In other words, ISM employment index is not useful in understanding manufacturing jobsgrowth. The graph below shows BLS manufacturing employment month-over-month gains against the ISM Manufacturing employment index.
Indexed to Jan 2000 – Comparison of the ISM Manufacturing Employment Subindex (blue line) to BLS Manufacturing Employment (red line) – all data seasonally adjusted
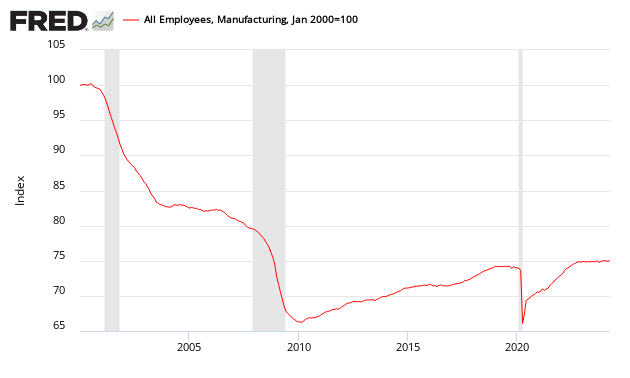
The ISM employment index appears useful in predicting turning points which can lead the BLS data up to one year.
Related Posts:
Old Analysis Blog | New Analysis Blog |
| Institute of Supply Management Surveys | Institute of Supply Management Surveys |


