
Written by Sig Silber
Not much to report prior to the update of the March Forecast which will be released Saturday with an updated drought forecast for March. It may not be favorable for the states along the Gulf of Mexico. We do have a state by state agriculture summary (and later in the report a similar analysis focused specifically on crops). We have also provided a report on a webinar about the Apalachicola-Chattahoochee-Flint River Basin, a drought-prone region which fortunately is in fairly good shape right now. Of course, we have our full set of regular weekly reports (including some recent crop reports) and, since we are now publishing on Fridays, our intermediate-term weather forecast covers 28 days. The first 14 days of the forecast updates automatically daily – so you can check it each day.

Please share this article – Go to the very top of the page, right-hand side, for social media buttons. Please feel free to send this article to anyone who you think might benefit from reading it.
Directory
Readers can scan through this article or jump to where they want to go via the links to the right. Directory links are under construction. Check back for completion. |
|
Special Topics for this Week
ACF Webinary Report (get full report here)


February State Agricultural Summaries
 |
 |
 |
 |
 |
 |
 |

It has been dry in the Sierra Nevada


Current Drought Conditions
Now we take a look at Thursday’s U.S. Drought Monitor Report.
The U.S. Drought Monitor is a comprehensive way of understanding the drought situation for the U.S. It is issued every Thursday and reflects the conditions as of the prior Tuesday. Drought is defined as a moisture deficit bad enough to have social, environmental or economic effects. Thus, more factors than recent precipitation are considered and more information on how it is done is found at the end of this report.
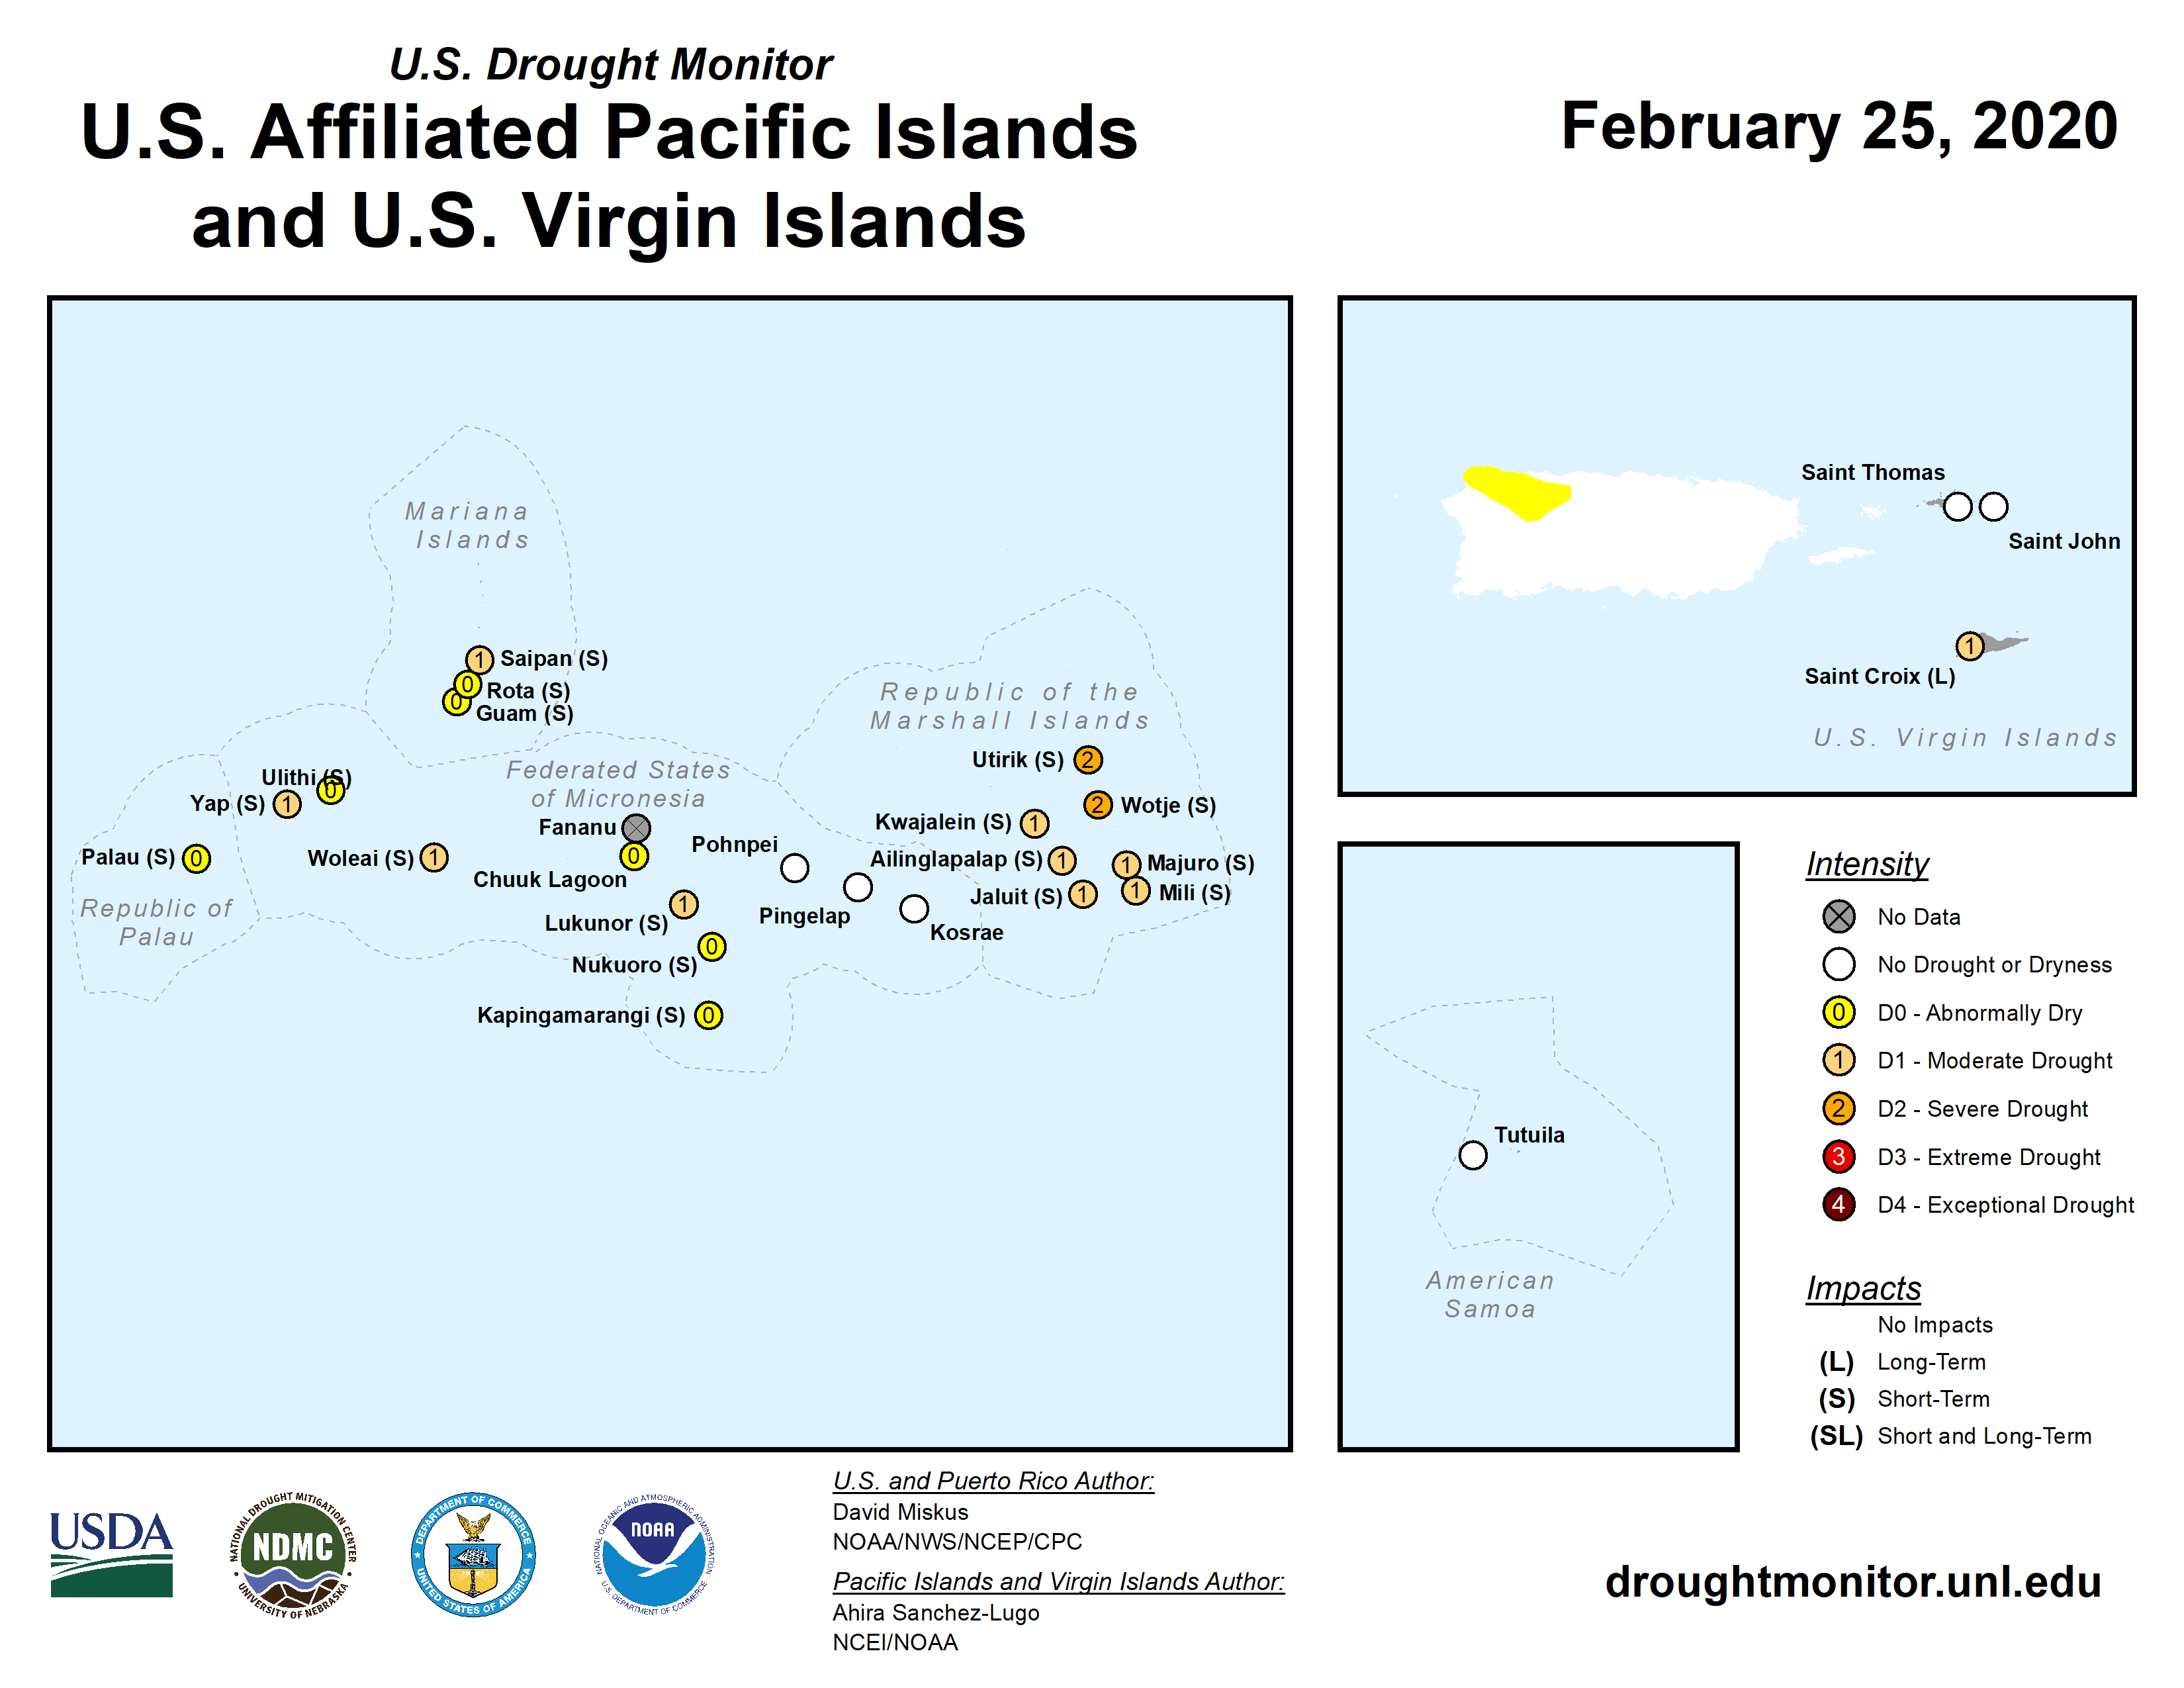
U.S. Affiliated Pacific Islands and the U.S. Virgin Islands.
And this shows the U.S. including Alaska, Puerto Rico, and Hawaii.
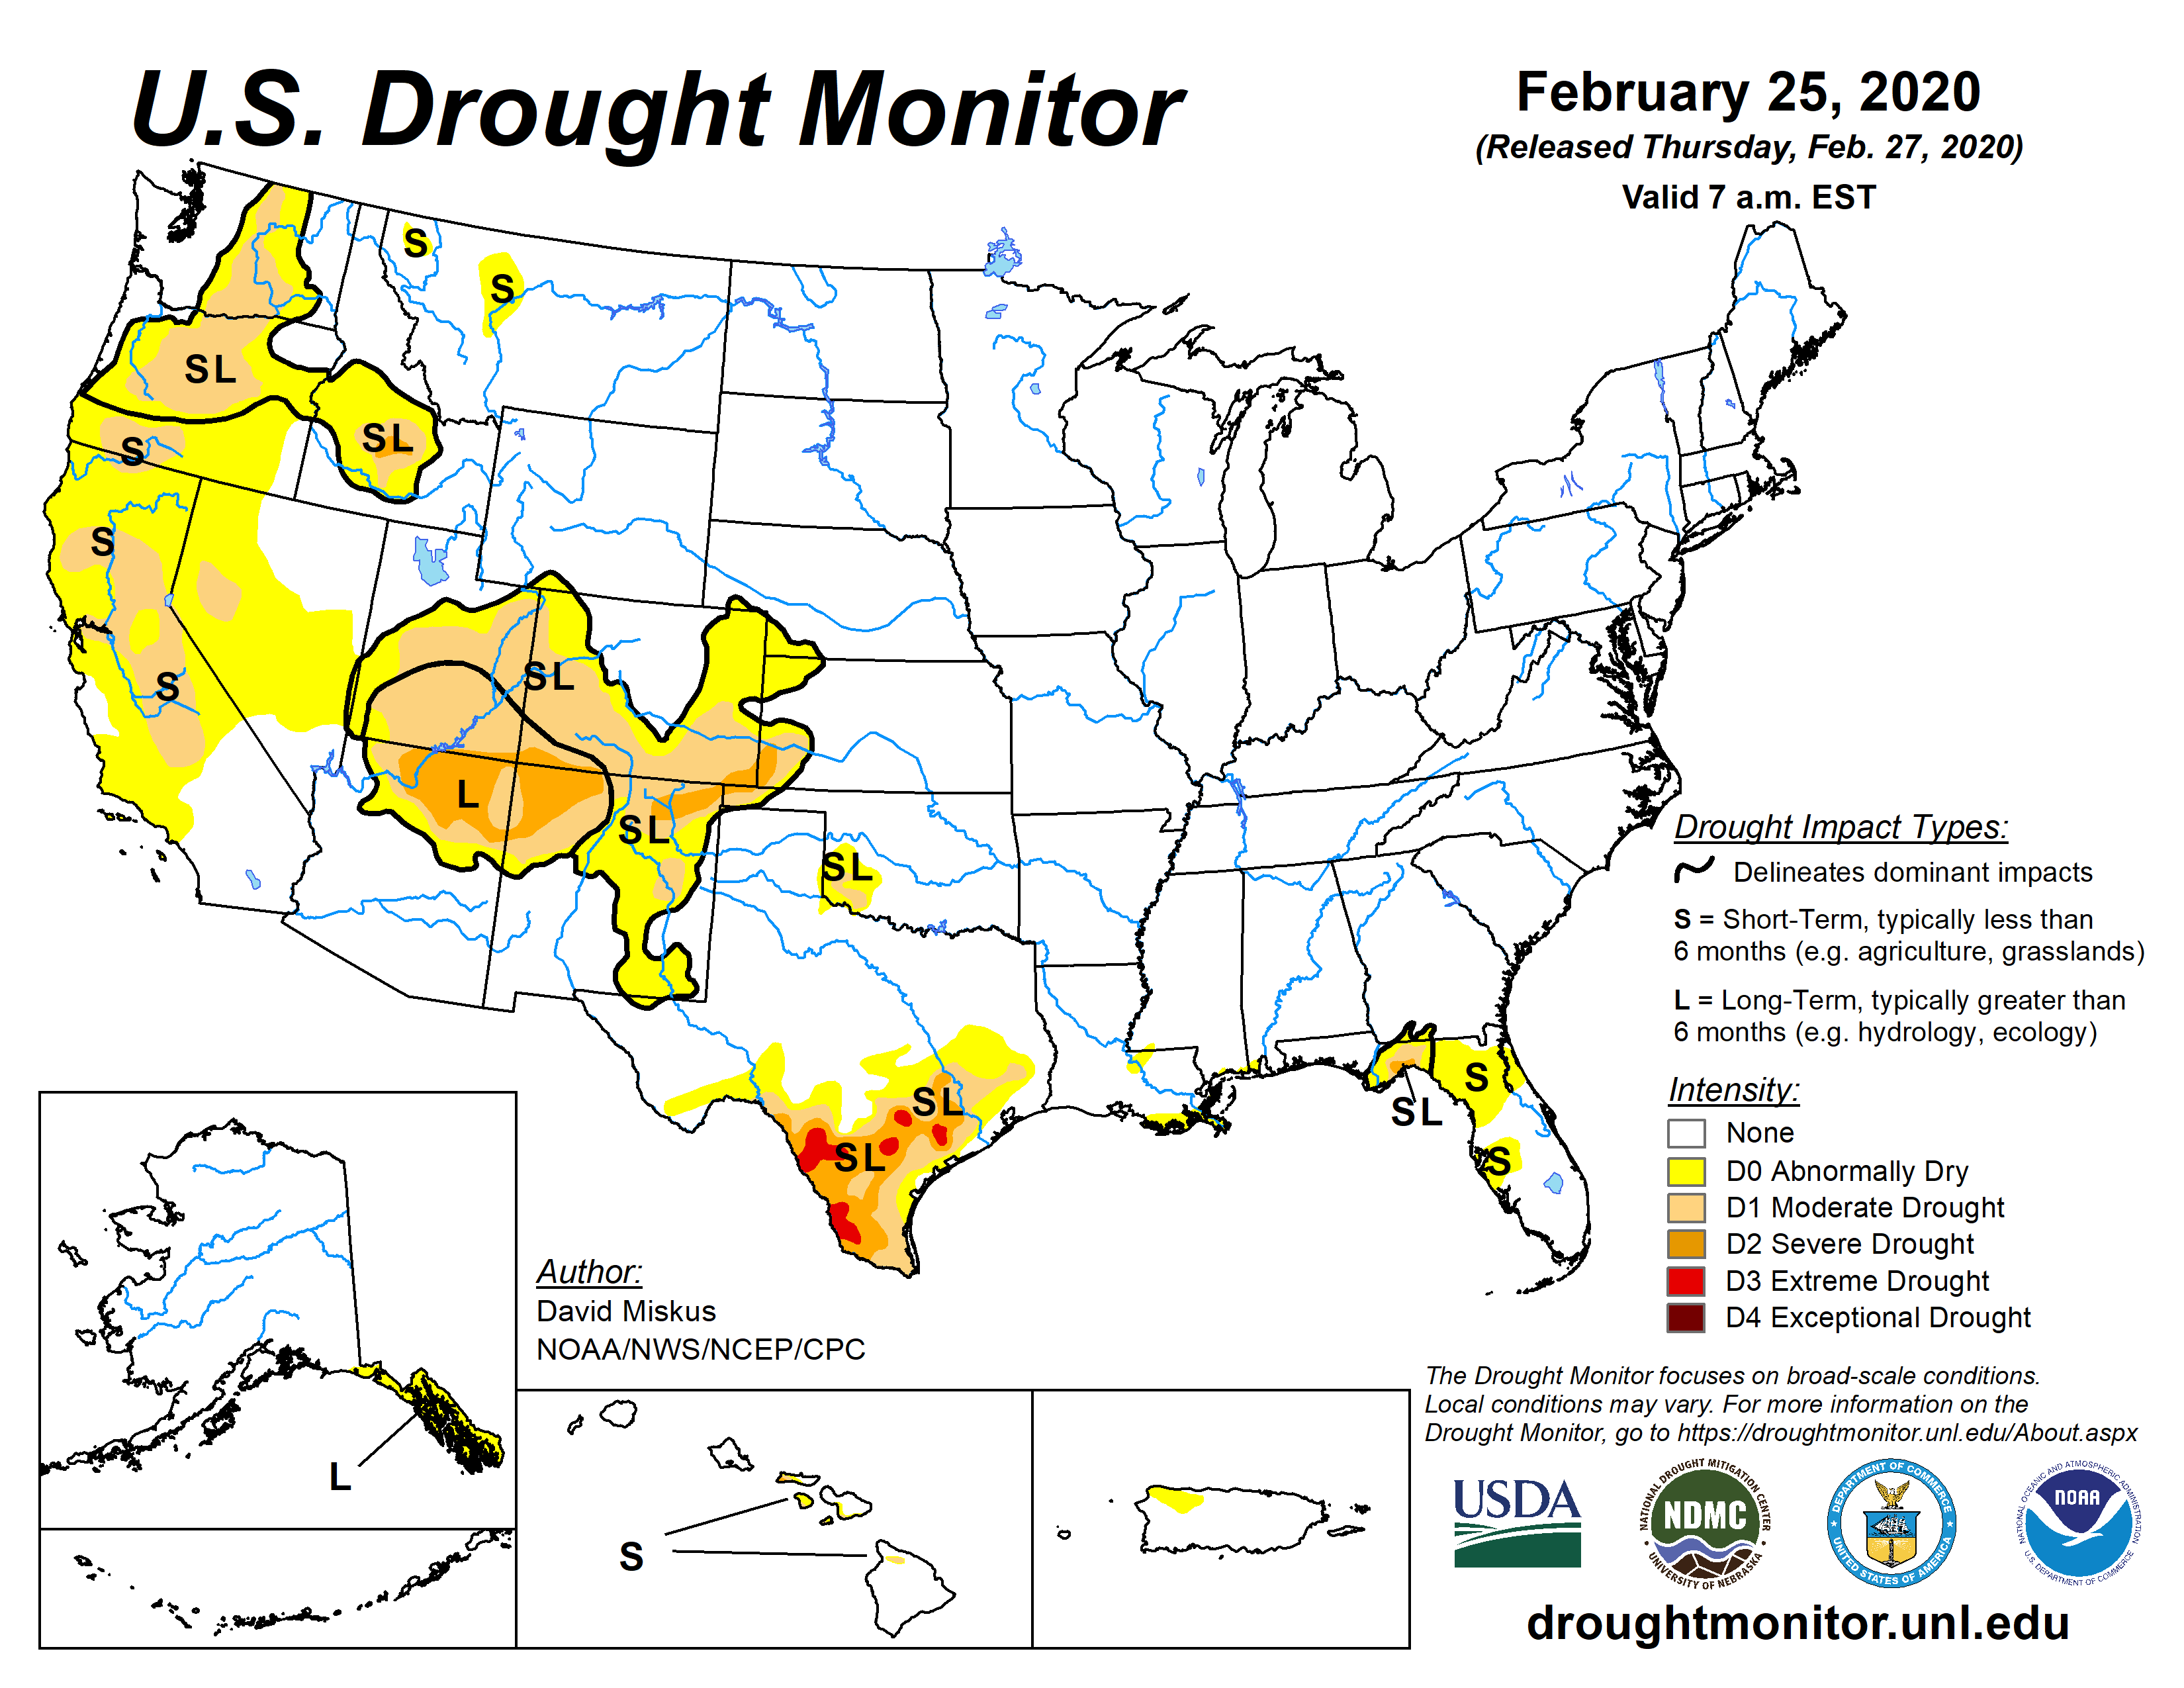
Below is the map for just CONUS.
 |
 |
| Last Week | This Week |
| |

Some might find this animation of twelve weeks of change useful;

The graphic below shows the one-week change in drought intensity. Yellow is bad. Green is good.
|

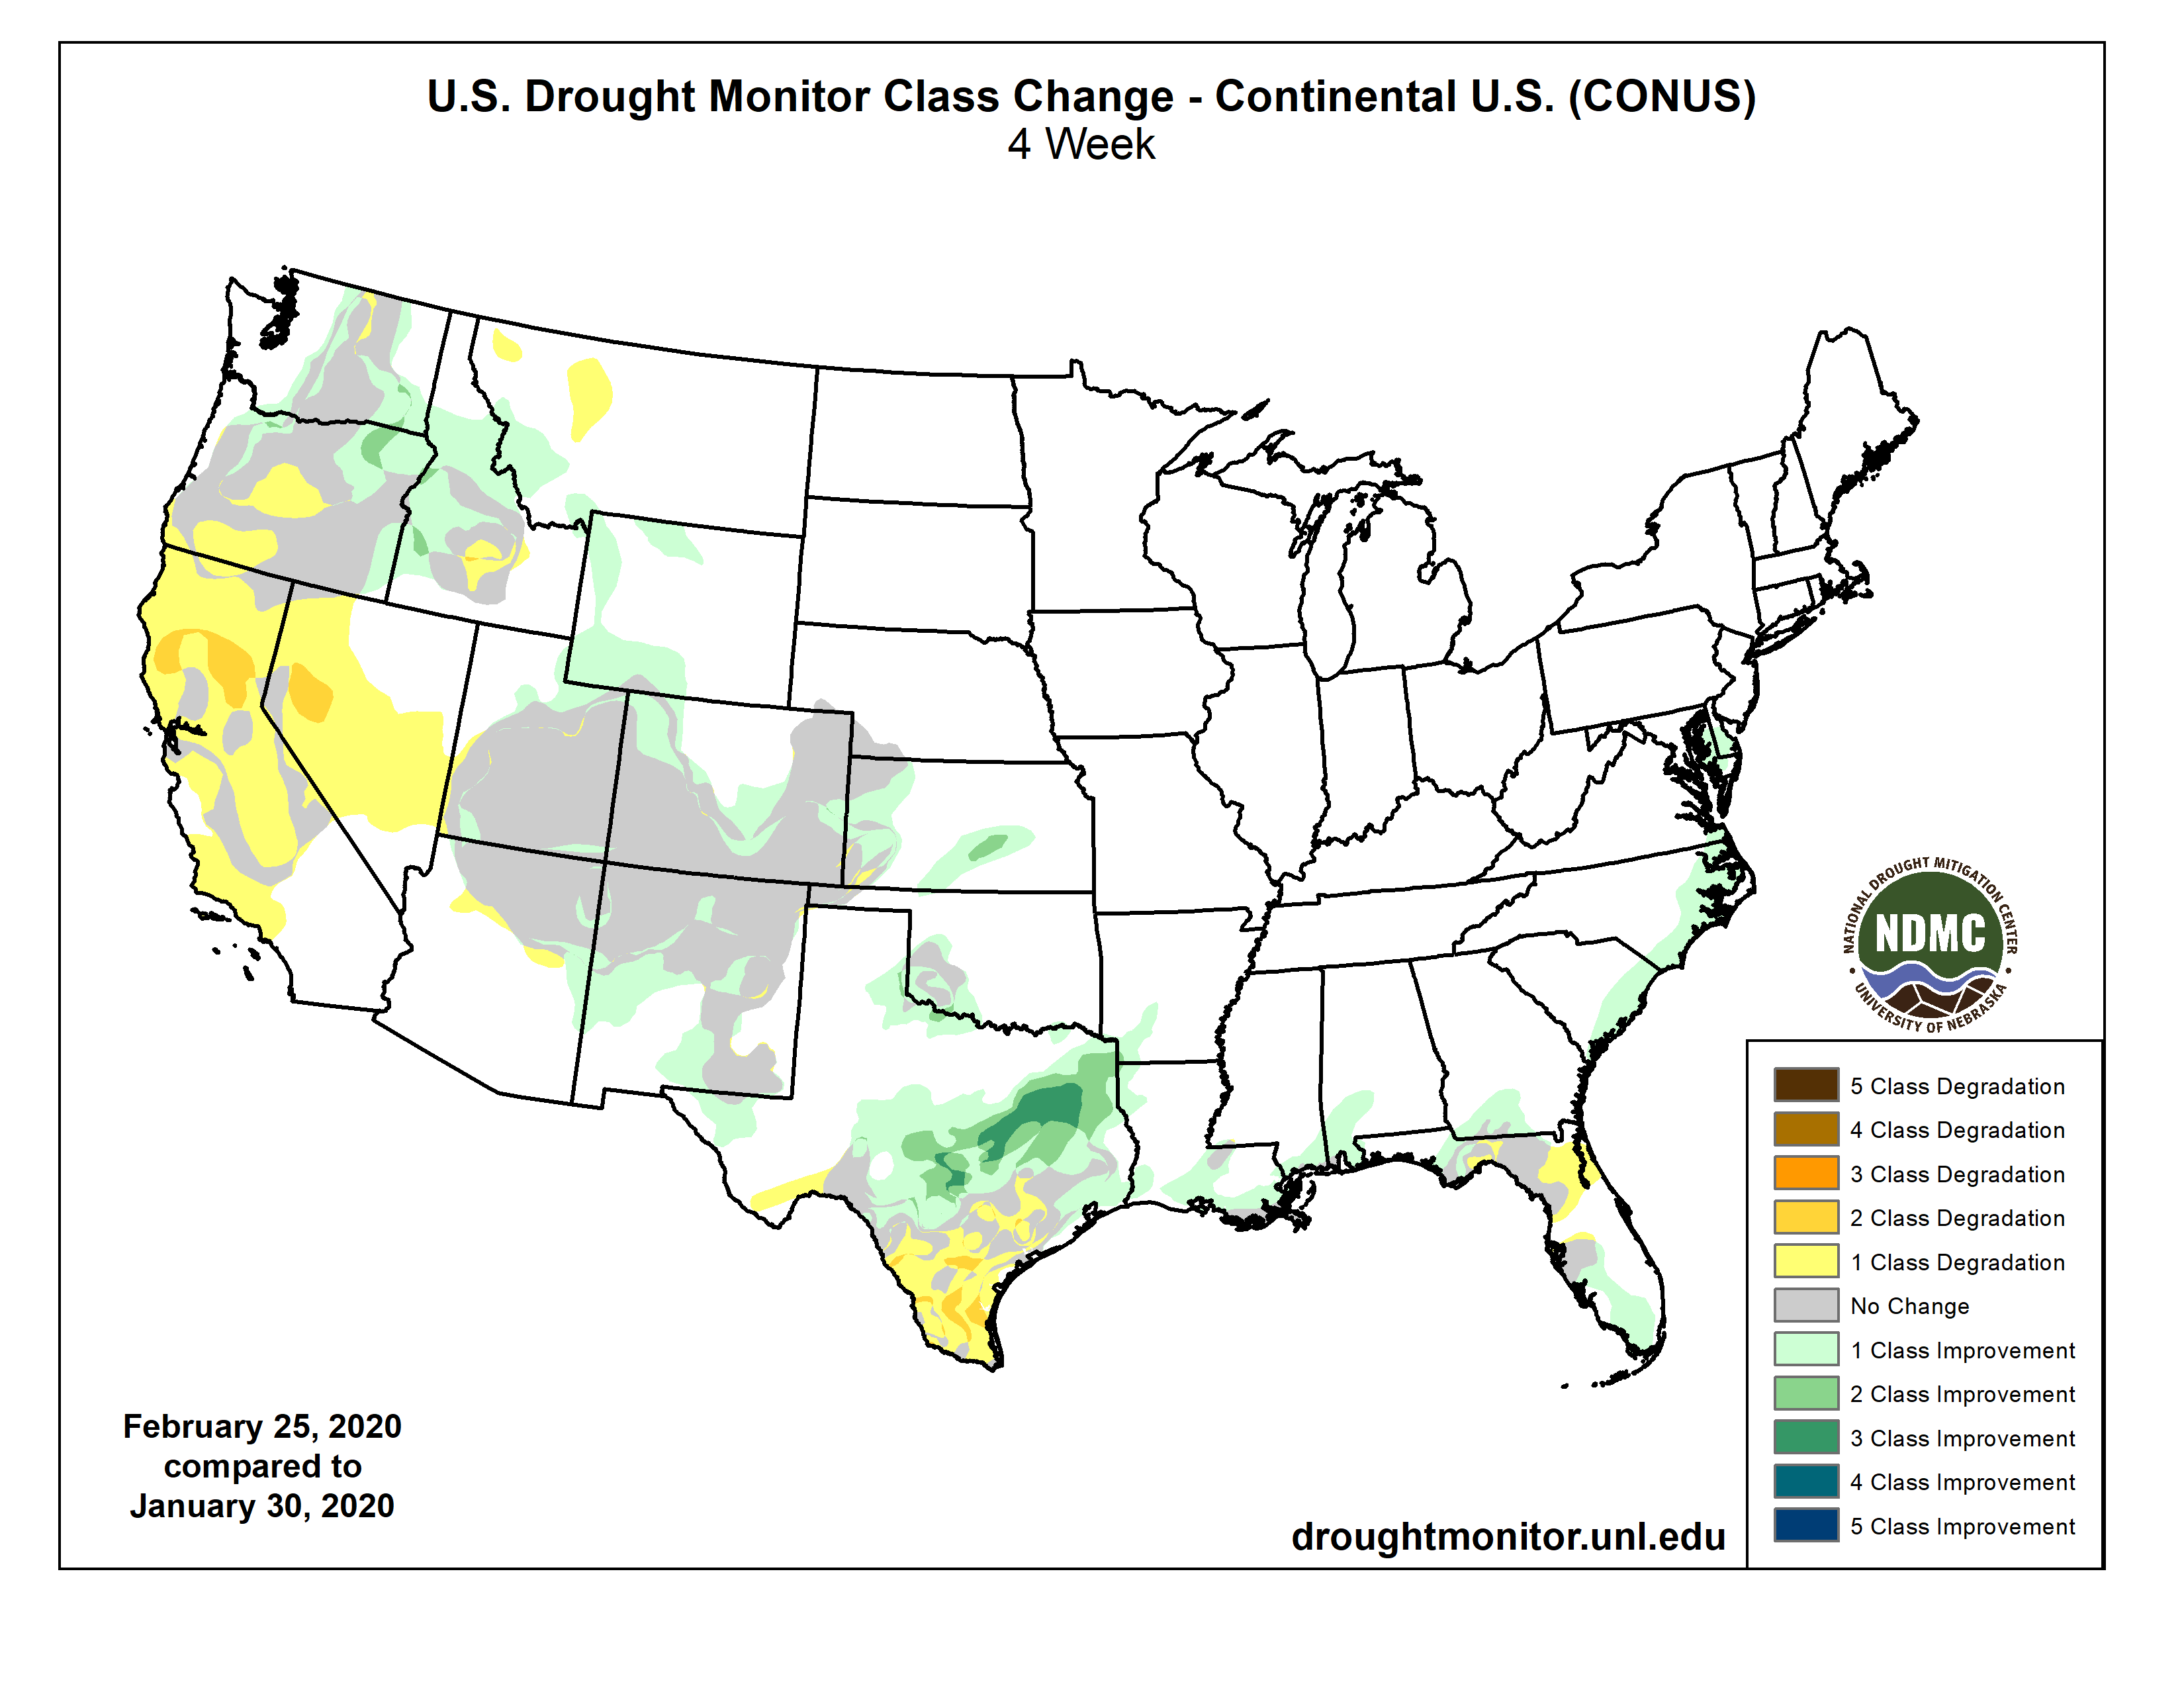
Now we show the week to week change information by region. The yellow is where the level of drought has been raised. The green is where the level of drought has been lowered.
 |
Improvement in Kansas and a bit in Wyoming. |
 |
| No Change |
 |
No Change |
 |
Improvement in Texas and Louisiana all at about the same latitude. |
 |
| Almost all the change is in Florida and it is mixed but more degradation than improvement. |
 |
| Degradation in Northern California, Nevada and Southern Oregon and a few other small areas with small areas of improvement in Utah, Colorado, Arizona, and New Mexico. |
Here is the Discussion that was issued with the Drought Report. The Regional Headings can be clicked on to obtain maps and statistics.
This Week’s Drought Summary
This Week’s Drought Summary
High pressure continued to persist over the eastern Pacific Ocean, forcing a split in the normal west to east upper-air flow for Pacific storm systems. As a result, storms bypassed the central West (e.g. California and the Great Basin), instead tracking northward into the Pacific Northwest and British Columbia, and southward across Baja California and the Southwest. This pattern has produced a very dry January and February in California, normally the two wettest months of the year, resulting in an expansion of short-term D0 and D1 that are impacting non-irrigated land and non-managed rivers. Fortunately, the statewide reservoir storage stood at 104% of average for this time of year. Farther to the east, once these systems reached the Plains, Gulf moisture was entrained into them, generating widespread precipitation across the South and Southeast and mixed or frozen precipitation in more northern locations. The week’s greatest precipitation (1-4 inches) fell on the northern Cascades, parts of the Southwest (mostly Arizona), the central Plains (mainly Kansas), and from central Texas eastward across the lower Mississippi, Tennessee, and Ohio Valleys, the Southeast, and southern Appalachians. Little or no precipitation, however, fell on most of California, the Great Basin, and Intermountain West, northern Plains and upper Midwest, parts of the southern Plains, most of Florida, and the mid-Atlantic. Weekly temperatures averaged below normal in southwestern Alaska, the Northwest, Rockies, Plains, upper Midwest, Southeast, and New England. In contrast, above-normal readings were observed in eastern and southern Alaska, the Southwest, eastern Great Lakes region, mid-Atlantic, and along the eastern Gulf and southern Atlantic Coasts.
Northeast
With much of the region observing little or light precipitation (0.5 inches or less) except for eastern Maine and West Virginia (0.5-1.5 inches), and temperatures seasonable (slightly below-normal in New England, slightly above-normal in the mid-Atlantic), lingering pockets of short-term dryness were found in eastern New England at 60-days, and the mid-Atlantic at 90- and 180-days. USGS average stream flows are near normal at 14- and 28-days, although shorter time periods (7-days and less) began to show flows in the lower 24th percentile in eastern sections of Maryland, New Jersey, Connecticut, and Rhode Island. But with this being the non-growing season (no evapotranspiration and low temperatures), snow cover across the northern half of the Northeast, adequate stream flows, and no obvious impacts, no D0 development was made this week.
Southeast
Additional heavy rains (2-6 inches) fell on already-saturated ground across the northern two-thirds of Alabama and Georgia and western South Carolina, leading to USGS near- to record high stream flows at the instantaneous to 28-day average values. Unfortunately, rainfall totals decreased toward the Gulf of Mexico, and little or no rain fell on much of central and southern Florida. As a result, D0 was expanded across northeastern and west-central Florida as 60- to 90-day precipitation shortages reached 3-6 inches. In contrast, moderate to heavy rain (1.5-3.5 inches) fell along the northern edges of the D0-D2 in the northern Florida Panhandle, trimming away some of the northern D0-D2 areas. Although Tallahassee, FL, received 2.33 inches on Feb. 24-25, pushing them above-normal for February, large long-term deficits still remained, hence the lingering D1(SL) there. In extreme southwestern Alabama, although 0.5-1 inch fell this week, D0 remained intact as 60-, 90-, and 120-day departures lingered between 2-4 inches. No D0 or drought was drawn in the remaining Southeastern states (VA, NC, SC) as recent conditions remained normal to excessively wet.
South
Similar to last week, another storm system dropped moderate to heavy rain (1-4 inches, locally to 7) from central Texas eastward across northern Louisiana, central Mississippi, and into central Alabama and Georgia. Decent totals (0.5-2 inches) also fell on southwestern and northern Oklahoma, central and eastern Texas, and much of Arkansas, Louisiana, Tennessee, and Mississippi. Little or no precipitation was reported in far western and southern Texas, the eastern half of Oklahoma, and extreme northwestern Arkansas. And like last week, 1- and a few 2-category improvements were made in central and southeastern Texas, while most of the D0 in southern Louisiana was alleviated. USGS stream flows have responded, with 7-day averaged values in the 75th to 90th percentiles in eastern Texas eastward. In contrast, where weekly totals were lower (less than 1.5 inches) and decent 60- to 90-day deficits remained, D0 was left. This included southeastern Louisiana and extreme southern Mississippi. A small portion of the D0 was removed in southwestern Oklahoma where 1-1.5 inches fell. Status-quo was decided for southern Texas even though it was mostly dry since major degradations were made last week there. The only change was the removal (downgrade) of a small D1area (to D2) in southwestern Starr County. USGS stream flows have also responded here, but the opposite way as 7-day averages were in the 10th to 25th percentiles. If it remains dry this week with low humidity and gusty winds (red flag warnings), potential deterioration is possible next week as reported impacts were on the rise.
Midwest
The past 30-days have seen mostly below-normal precipitation (except surpluses across far southern and eastern sections), with below-normal temperatures the past 14-days. With excess precipitation encompassing much of the Midwest the past 60- to 90-days, no D0 development was needed. Not surprisingly, USGS stream flows were near to much above-normal (more so at longer time periods) where the rivers were not frozen. In the upper Midwest, a decent snow cover blanketed the area. The drier weather was welcome in the Midwest, but they could also use some milder air – as long as it thaws the ground while gradually melts the snow.
High Plains
Much of the region was saw little or no precipitation with the exception of Kansas and eastern Colorado. Unseasonably heavy precipitation (1-3 inches) fell across much of Kansas and into Missouri, effectively erasing the two small D1 areas and D0 in south-central Kansas as surpluses now replaced deficits out to 90-days. Likewise, moderate precipitation (0.5-1.5 inches) in western Kansas and eastern Colorado (where February normally contributes to only 2-3% of the annual total) removed shortages out to 90-days, improving the D0-D2 by 1-category. In central Colorado, 0.5-1 inch of precipitation was enough to improve most indices to the normal range, thus D0 was removed in parts of Pueblo and Custer Counties. For D0 changes in Wyoming and Montana, please refer to the West write-up.
West
As a large ridge of high pressure off the California Coast remained entrenched, Pacific storm systems were deflected farther north or south of the ridge, affecting the Pacific Northwest and southwestern Canada, or Baja California and the Southwest, but keeping most of California, Nevada, northern Utah, and southern sections of Oregon and Idaho mostly dry. Unfortunately, this pattern has remained entrenched during much of January and February, normally the two wettest months of the year for California, and has greatly diminished the good (wet) start to the Water Year (Oct. 1). After above-normal precipitation during November and December in the Southwest and most of California (and below-normal precipitation in the Northwest), 2020 brought a flip to the weather pattern as California and parts of the Southwest dried out while the Northwest observed surplus precipitation. During the past 60-days, less than 25% of normal precipitation had fallen on much of California and western Nevada, creating deficits exceeding a foot in parts of the Sierra Nevada, and 4-8 inches along the coast. SNOTEL basin average WYTD precipitation has dropped to between 45-54% of normal in the Sierra Nevada while Feb. 25 SWC stood between 46-61%. In southern Oregon, although the past 60-days were somewhat better than California, a dry November and December started their Water Year off to a slow start. Their SNOTEL basin average WYTD precipitation and Feb. 25 SWC was between 67-69% and 71-77%, respectively. In southern Idaho, the Big Lost, Big Wood, and Little Wood basins were mostly dry this week, and the Feb. 25 SWC dropped to between 57-71% while WYTD precipitation held steady, ranging from 55 to 64%.
Although the California statewide average reservoirs were 104% of normal for this time of year, the timing of the precipitation deficiencies are just as important as the magnitude in California. According to California State Climatologist Michael Anderson, February is an important month as temperatures begin to warm and rangeland comes out of winter stasis. With late rains, germination was delayed, and now with little or no rain in February, it will be difficult for rangeland to develop the nutrients necessary for good forage. Expectations are that rangeland conditions will be poor or very poor, and supplemental feeding required. Reports from the field have already mentioned that some rangeland and pastures have already headed out, meaning that they completed their annual life cycle and won’t produce any more biomass, something that normally happens in late April or May. A report from northern California mentioned blowing dust when checking their herd – while blowing snow would be the norm. The latest USDA/NASS February report for California had topsoil moisture 25% very short, 40% short, and 35% adequate. Subsoil moisture was 10% very short, 50% short, and 40% adequate. Some areas are considering irrigation due to the dry weather, and cattle continued to be provided supplemental feed. With numerous non-managed 7-day averaged USGS stream flows in the lower tenth percentile (much below normal) in southwestern Oregon and the northern half of California, and non-irrigated lands already being impacted, D0(S) was expanded into northwestern and west-central California and northwestern and central Nevada. Where short-term conditions (60-days; SPIs at D2-D4) and WYTD conditions (120-days; SPIs at D1-D2) were the worst, D1(S) was added in central California and the Sierra Nevada, southern Oregon, and west-central Nevada. Fortunately, the long-term hydrologic conditions were much better, with California statewide reservoirs at 104% of normal as of Feb. 25. In southern Idaho, D2(SL) was added to the Big Wood, Little Wood, and Lost River basins. In northwestern Montana, a small D0 was introduced from Kalispell to Eureka based upon 90-day indices as SWC and WYTD precipitation is below normal, possibly due to a precipitation shadow effect from this winter’s dominant flow patterns.
In contrast, a southern storm system dropped light to moderate totals (0.5-2.5 inches) on the Southwest, mainly Arizona, but enough precipitation fell elsewhere on southern Nevada, southwestern Utah, northeastern Arizona, and central and eastern Colorado to slightly improve D0-D2 in these areas. In addition, 0.5-1 inch fell on the eastern side of the southern Sierra Nevada (western Inyo and eastern Fresno counties) that the eastern edge of the D1(S) was adjusted (improved) slightly westward. In northeastern Oregon (central Umatilla county), D0 was trimmed back as stream flows, SWC, WYTD precipitation, and soil moisture indicators were much improved. In northern Wyoming, although it was a quiet week, a re-evaluation of the tools showed that all indicators at all time periods were normal or wet, thus the D0 was erased there. Washington was left unchanged.
Alaska, Hawaii, and Puerto Rico
In Alaska, another week with heavy precipitation (2-6 inches) on eastern Kenai Peninsula and areas to the east and north eliminated the D0(S). Additional moderate precipitation (2-5 inches) fell on many locations of the southeastern Alaskan Peninsula as conditions have improved during the past several months, but long-term large deficits (1-year and longer) still remained, thus maintaining the D0(L) there.
Recent rainfall had mainly been along the windward slopes in modest amounts where no drought existed. However, the FSA on the Big Island reported that pastures had recovered enough from recent rains to warrant a 1-category improvement in the Waimea area – which was consistent with NDVI and rainfall data. In the western half of Molokai, recovery was limited. Although they received rainfall earlier this month, the cooler temperatures and field reports indicated minimal growth, thus a 1-category improvement was recommended in the northwestern section, but status-quo for the southwestern side.
The eastern area of the D0(S) in northwestern Puerto Rico was shrunk as 1.5-2.5 inches of rain fell on eastern Arecibo, southern Barceloneta, and northern Florida provinces, reducing the 60- to 90-day deficits enough to allow for removal of the D0(S) there. Moderate to heavy rains (1-4 inches, locally to 7) also fell across northern and northeastern sections of the island, while little or no rains occurred along the southern coastal areas. Except for the 60- to 90-day shortages in the northwest, the remainder of the island was at or above normal.
Pacific Islands
During the Northern Hemisphere winter, the North Pacific subtropical high, and the low latitude Inter-Tropical Convergence Zone (ITCZ), migrate south toward the equator. The seasonal migration brings drier subtropical trade winds to the northern portions of Micronesia and ITCZ rainfall to the southern regions. The weather conditions across the U.S.-Affiliated Pacific Islands (USAPI) during this USDM week (2/19/20-2/25/20) saw a continuation of this pattern with high pressure spreading dry trade winds across northern portions of Micronesia and surface troughs or a near-equatorial trough persisting across the southern portions. Weak circulations developed within the southern troughs, with upper-level divergence and converging surface trade winds enhancing showers along the troughs’ northern edge. Trade-wind convergence and/or disturbances developed over the eastern Federated States of Micronesia (FSM) and the Marshall Islands (RMI), while a diffuse shear line moved across the Marianas. South of the equator, the South Pacific Convergence Zone (SPCZ) monsoon trough persisted over the Samoan Islands, with several tropical systems bringing several rounds of high wind, flooding rain, landslides, and high surf to American Samoa. These systems included Tropical Disturbance 96P, Tropical Depression 09F (97P), and Tropical Cyclone 10F (18P, 98P). TD 09F eventually intensified into Tropical Cyclone Vicky (17P) well south of Tutuila, and TC 10F passed over Savaii then south of American Samoa as Tropical Storm Wasi.
Satellite-based estimates of 7-day precipitation (QPE) showed a narrow band of 2+ inches of rain across Yap State into southern Chuuk State, a band of 2+ inches from northeastern Chuuk State to the southern RMI, and a large area of 4+ inches of rain extending southeastward across the Samoan Islands. Otherwise, very little precipitation was indicated on the satellite QPE for northern and western portions of Micronesia.
Short-term abnormally dry conditions continued to affect Korror, Palau, as precipitation totals were only 0.80 inch of rain this week.
Dry conditions continued to affect the Mariana Islands this week, with all three locations having half an inch of rain or less. Saipan had the least rainfall total at 0.42 inch of rain (ASOS: 0.37 inch; NPS: 0.14 inch), followed by Rota at 0.46 inch and Guam (0.50 inch). With three consecutive months (December 2019-February 2020) of precipitation totals less than 2 inches, which is half of the monthly threshold of 4 inches to meet most water needs, Saipan continued this week in short-term moderate drought.
This week marked Rota and Guam’s third consecutive week with precipitation totals below half an inch of rain. However, Rota and Guam’s monthly February precipitation total (as of February 25, 2020) was 5.57 inches and 3.79 inches, respectively, which is close or above the 4 inches monthly threshold to meet most water needs. According to local reports, Rota and Guam’s pastures are green. For this reason, abnormally dry conditions remain in Rota and Guam.
Dry conditions continued to affect most of the Federated States of Micronesia, with several locations receiving less than half an inch of rain. Yap had the least precipitation at 0.27 inch, giving way to the February 2020 monthly precipitation total of 3.05 inches. Yap’s dry February 2020 followed a very dry January (1.46 inches). According to information that was provided by locals, Yap’s pastures have become brown and three wildfires were reported in February. For this reason, Yap’s drought classification was changed to short-term moderate drought. Similarly, Woleai’s drought was also changed to short-term moderate drought since this week Woleai had only 0.36 inch of rain and the month has had only 4.09 inches of rain. This followed a very dry January, where precipitation totals for Woleai were only 1.24 inches. Lukunor continues in short-term moderate drought as well as the precipitation total for the week was 1.26 inches and the month-to-date had only 2.88 inches of rain.
Chuuk Lagoon (1.11 inches) and Ulithi (0.56 inch) had its third consecutive week with precipitation totals below the 2 inches weekly threshold to meet most water needs. The monthly precipitation total for February 2020 was only 2.18 inches for Chuuk Lagoon and 3.05 inches for Ulithi, which is below the recommended 8 inches threshold to meet most water needs. Due to the persistent dry conditions, Chuuk Lagoon and Ulithi’s drought status were downgraded to abnormally dry conditions.
Kapingamarangi had close to 2 inches of rain this week. However, its monthly precipitation total was only 4.84 inches, which is less than the threshold of 8 inches to meet most water needs, securing another week of abnormally dry conditions.
Although Pingelap (0.30 inch) had a dry week, the monthly precipitation total for February was 8.60 inches, surpassing the threshold of 8 inches to meet most water needs and thus drought free conditions continue in Pingelap.
After two weeks of little to no rain, Nukuoro had 4.70 inches of rain this week. Although this was a very wet week, the monthly February 2020 precipitation total was only 5.30 inches of rain. Short-term abnormally dry conditions will continue for another week for Nukuoro.
Pohnpei and Kosrae also had a wet week, with Kosrae having the most precipitation at 7.26 inches. These two locations continue drought free.
Dry conditions continued to affect much of the Marshall Islands this week. Ailinglapalap had the least precipitation this week, receiving only 0.14 inch of rain. This was Ailinglapalap’s fourth consecutive week with little rain, resulting in only 0.27 inch of rain for February 2020. Drought conditions for Ailinglapalap were downgraded to short-term moderate drought. Similarly, Jaluit and Mili had 2.29 inches and 0.96 inch of rain so far for the month, respectively. Their drought classifications were also changed to short-term moderate drought. Kwajalein’s drought classification of short-term moderate drought was unchanged as this was another dry week and the month-to-date precipitation total is only 2.17 inches.
The last two months have been very dry for both Utirik and Wotje, with monthly precipitation totals below 4 inches in January 2020 and less than 2 inches in February 2020. Due to the persistent dry conditions, Utirik and Wotje’s drought classification was changed to short-term severe drought.
Majuro had a wet week with precipitation totals at 3.76 inches. Overall, the monthly precipitation total for February 2020 was 4.86 inches, below the 8 inches threshold to meet most water needs. Also, reservoir levels were at 64.3% of its maximum capacity, which is below the critical 80% level. For now, short-term moderate drought continues to affect Majuro.
Wet conditions continued to affect American Samoa this week with precipitation totals ranging between 5 to 11 inches, securing another week of drought free conditions across the region.
Virgin Islands
Although precipitation totals were less than half an inch for St. Thomas and St. John, drought free conditions persist this week. The month-to-date and year-to-date totals for St. Thomas were above normal, while St. John’s month-to-date precipitation total was 84.9% of normal and above-normal year-to-date. SPI at all levels indicate drought free conditions for both locations.
Little to no rain was observed this week in St. Croix. The month-to-date precipitation total of 0.80 inch was only 56.3% of normal precipitation. Meanwhile, the year-to-date precipitation total was 3.63 inches and 102% of normal precipitation. SPI for 1, 6,9, and 12 months indicate abnormally dry to severe drought. For this week, long-term moderate drought persists.
Looking Ahead
During the next 5 days (February 27-March 2) in the West, light to moderate precipitation is expected in the Cascades, Sierra Nevada, Great Basin, and northern and central Rockies later in the 5-day period. Dry weather should prevail across the Plains, while a departing storm system early in the period brings light to moderate totals to the Northeast, Ohio Valley, and central Florida.
In the extended range forecast for the ensuing 5 days (March 3-7), odds are tilted toward above-normal precipitation east of the Rockies, especially from the lower Missouri and Tennessee Valleys northeastward into western New England, and across most of Alaska. Subnormal precipitation is favored in the Far West, especially California, Nevada, and Utah, and in extreme southern Texas. Above-normal temperatures are likely east of the Mississippi River, the Far West (mainly California), and northern High Plains. Enhanced probabilities for subnormal temperatures were found across Alaska, and in the central and southern Rockies.
And shifting to the Alaska and CONUS Intermediate-Term Weather Forecast
 |
|
|
|


And then Precipitation
|
|
|


Here is the discussion that was released with the Week 3 – 4 forecast today.
ENSO-neutral conditions are present across the equatorial Pacific Ocean. Equatorial sea surface temperatures (SSTs) are near-to-above average across the Pacific Ocean. The MJO is weak, with little model agreement on the forecast MJO evolution over the next two weeks. The Week 3-4 Outlook is based primarily on dynamical model forecasts, including the NCEP CFS, ECMWF, and JMA ensemble prediction systems, as well as the Subseasonal Experiment (SubX), a multi-model ensemble (MME) of both operational and experimental ensemble prediction systems. A multivariate linear regression (MLR) of lagged temperature and precipitation forecasts to currently observed MJO and ENSO indices and long-term trends, is also consulted, but given weak MJO and ENSO forcing, this tool reflects the linear trend.
The dynamical model consensus predicts a fairly high-amplitude 500-hPa height pattern, with anomalous ridging forecast south of the Aleutians, troughing near the West Coast, and ridging over eastern North America. There is excellent agreement among dynamical models on these broad features. Negative height anomalies are forecast over the polar latitudes, with below-normal heights forecast over the mid-latitudes; this means the dynamical model consensus favors a positive phase of the Arctic Oscillation lasting on average through March.
The surface temperature and precipitation patterns fall out nicely from the forecast circulation pattern. Above-normal temperatures are likely over the eastern two-thirds of the CONUS, with below-normal temperatures only favored along the West Coast extending northwestward into southern Alaska. There is more uncertainty in the precipitation outlook where various model tools are in poor agreement. The large-scale circulation pattern produces the highest confidence over Alaska, with above(below)-normal precipitation favored over the northern (southern) part of the state. Over the CONUS, wetter-than-normal conditions are broadly favored over the northern tier with anomalous upper-level southerly flow forecast. Below-normal precipitation is more likely over much of the southern and eastern CONUS due to the position of the anomalous ridge axis. Model tools disagree over parts of the Southeast and Tennessee River Valley, where SubX guidance is substantially wetter than the operational guidance, leading to EC being depicted for that region. Likewise, operational ensemble means favor above-normal precipitation for northern California, but calibration and incorporation of the SubX guidance reduced the probabilities to approximately equal changes.
SST anomalies remain slightly above-normal in the vicinity of Hawaii, although the magnitude of the anomalies has decreased substantially over the past several weeks. Dynamical model forecasts, including the SubX suite, generally support above-normal temperatures across Hawaii, but the ECMWF has a cooler solution. Dynamical models generally favor enhanced precipitation.
Some may find the below way of looking at things useful and I hope these graphics are not too small to read. I did not make them so you could click on them individually but you can click on the whole graphic and it may enlarge. But I think you get the picture. It has been a rapid onset and demise. When you read these graphics, remember that the older graphics are not the drought conditions that existed then but the change from then until now.

Let’s focus on the change between January 28, 2020, and February 25, 2020, i.e. one month.
Focusing on the Intermountain West

Drought Forecasts
These two forecasts (Monthly and Season) are issued by the same agency but to obtain them you need to access two different links here and here.
Here is the Three-Month Forecast which was issued on February 20, 2020

Here is the Monthly Drought Outlook which was updated on January 31, 2020. It will be updated as a March Forecast on February 29, 2020 and we will report on it tomorrow night.

Floods
Floods remain a concern.

| Last Week | Current Week |
| |


Wildfires
Our usual graphic is not updating so we have deleted it. Bu updates from this source can be found here.
Current Wildfire Risk. This is a new model that updates daily by NOAA (but not automatically in this article) to show the short-term risk.

Click here to update. Red is high risk, blue is low risk. This graphic updates daily but you have to click on the link provided to get the updates More information can be found here.
This explains the model a bit.

The below graphics will update automatically on February 1 or so. So ignore the commentary for the time being. We will update it shortly.

Looking out another month.


Crop and Animal Husbandry Progress. USDA Executive Briefings can be found here (there are none this week). NASS reports can be found here. Foreign Intelligence reports can be found here.
There were a lot of NASS reports this week and we did not have time to prepare them for publication. A good state by state summary report was issued and you can access that here.
This shows the major reports Scheduled.

International

A map helps and is not always available and fortunately, it was available this week.

Major Sources of Information
In the box are shown the major resources we use. We will not be using them all each week but the reader is welcome to refer to these resources.
Major Sources of Information Used in this Weekly Report
|
Background Information


The sequence of drought occurrence and impacts for commonly accepted drought types. All droughts originate from a deficiency of precipitation or meteorological drought but other types of drought and impacts cascade from this deficiency. (Source: NDMC)
Source: National Drought Mitigation Center, University of Nebraska-Lincoln


