Written by Sig Silber
NOAA finally got real and changed their ENSO Status from El Nino to ENSO Neutral. We reported that last night in our Weather Impacts Article (click here to read) and now we explain the NOAA decision and begin to discuss what it means relative to our weather.

Please share this article – Go to the very top of the page, right-hand side, for social media buttons. Please feel free to send this article to anyone who you think might benefit from reading it.

Now we present the Figures referred to in the Advisory
Figure1

Figure 2

Figure 3

Figure 4

Here is a better graphic than the above.

Figure 5

Figure 6

So we are left with one slightly unusual question and the usual question. The slightly unusual question is: “why now for this downgrade?” The usual question is: “How will this impact our weather?” So we start with.
Why did NOAA “Stick a Fork in El Nino this Month”?
Here is a good post from Nat Johnson on the Climate.Gov Blog. Emily Becker usually does the honors but was away this week so Nat Johnson filled if for her and I liked his title “Stick a Fork in it” so I put it in my Landing Graphic. I hope it is not proprietary but I have heard it before. I could have provided the Emily Becker flow chart (and filled it in) but some of my friends at NOAA might have been offended so she probably will post when she returns. But it is useful to look at the forecasts for ENSO and these follow.
Here is the IRI/CPC forecast released with the Monthly ENSO Advisory.


But the Sea Surface Temperature (SST) a month ago still supported ENSO El Nino and it no longer does. So that supports the timing of the NOAA decision.

The same goes for the Southern Oscillation Index (SOI). A month ago it still suggested that the atmosphere had coupled with the location of the warm anomaly and now it does not. So again this supports the timing of the NOAA decision.

I present this history of the ONI readings just for reference. The longer list can be accessed here.

What Does it Mean to be in ENSO Neutral?
This is a difficult question to answer because ENSO Neutral is not either extreme of the ENSO Cycle and we are not going from a strong El Nino to pure Neutral but from a marginal El Nino to ENSO Neutral with an El Nino bias. So it is not like a switch has been thrown. But below are some things to think about.
First, are three specific things: two provided by Nat Johnson and the other by Emily Becker but referenced by Nat Johnson in his Blog Post. Now is a good time to make the point that the Climate.Gov Blog does not represent the views of NOAA but the posters. That may be a distinction without a distinction but it is a common practice and I assume is stated this way to allow posts to happen without having to go through an elaborate approval process.
There was a recent article on how this change in the Phase of ENSO might increase hurricanes this Summer and Fall. I am not linking that article as I did not find it to be impressive, but the below shows the mechanism.
Nat provided this really good graphic re ENSO and hurricanes.

That is called vertical shear as the changes in wind speed and direction vary with altitude but I would not be surprised if there were some horizontal shear differences also. Vertical shear is changes in wind speed and direction at different altitudes. Horizontal shear is changes spatially at the same altitude.
This also is from the Nat Johnson post.
A change to neutral could also impact the Atlantic hurricane season, which typically ramps up this time of year and peaks in early-to-mid September. El Niño tends to produce hostile conditions for Atlantic hurricanes, as explained more thoroughly in Dr. Phil Klotzbach’s guest post, so a return to neutral means that we will not get a decisive push from El Niño to the Atlantic. The updated NOAA Atlantic Hurricane Season Outlook is now available, so be sure to check how these changing ENSO conditions and other drivers are impacting the Atlantic hurricane season.
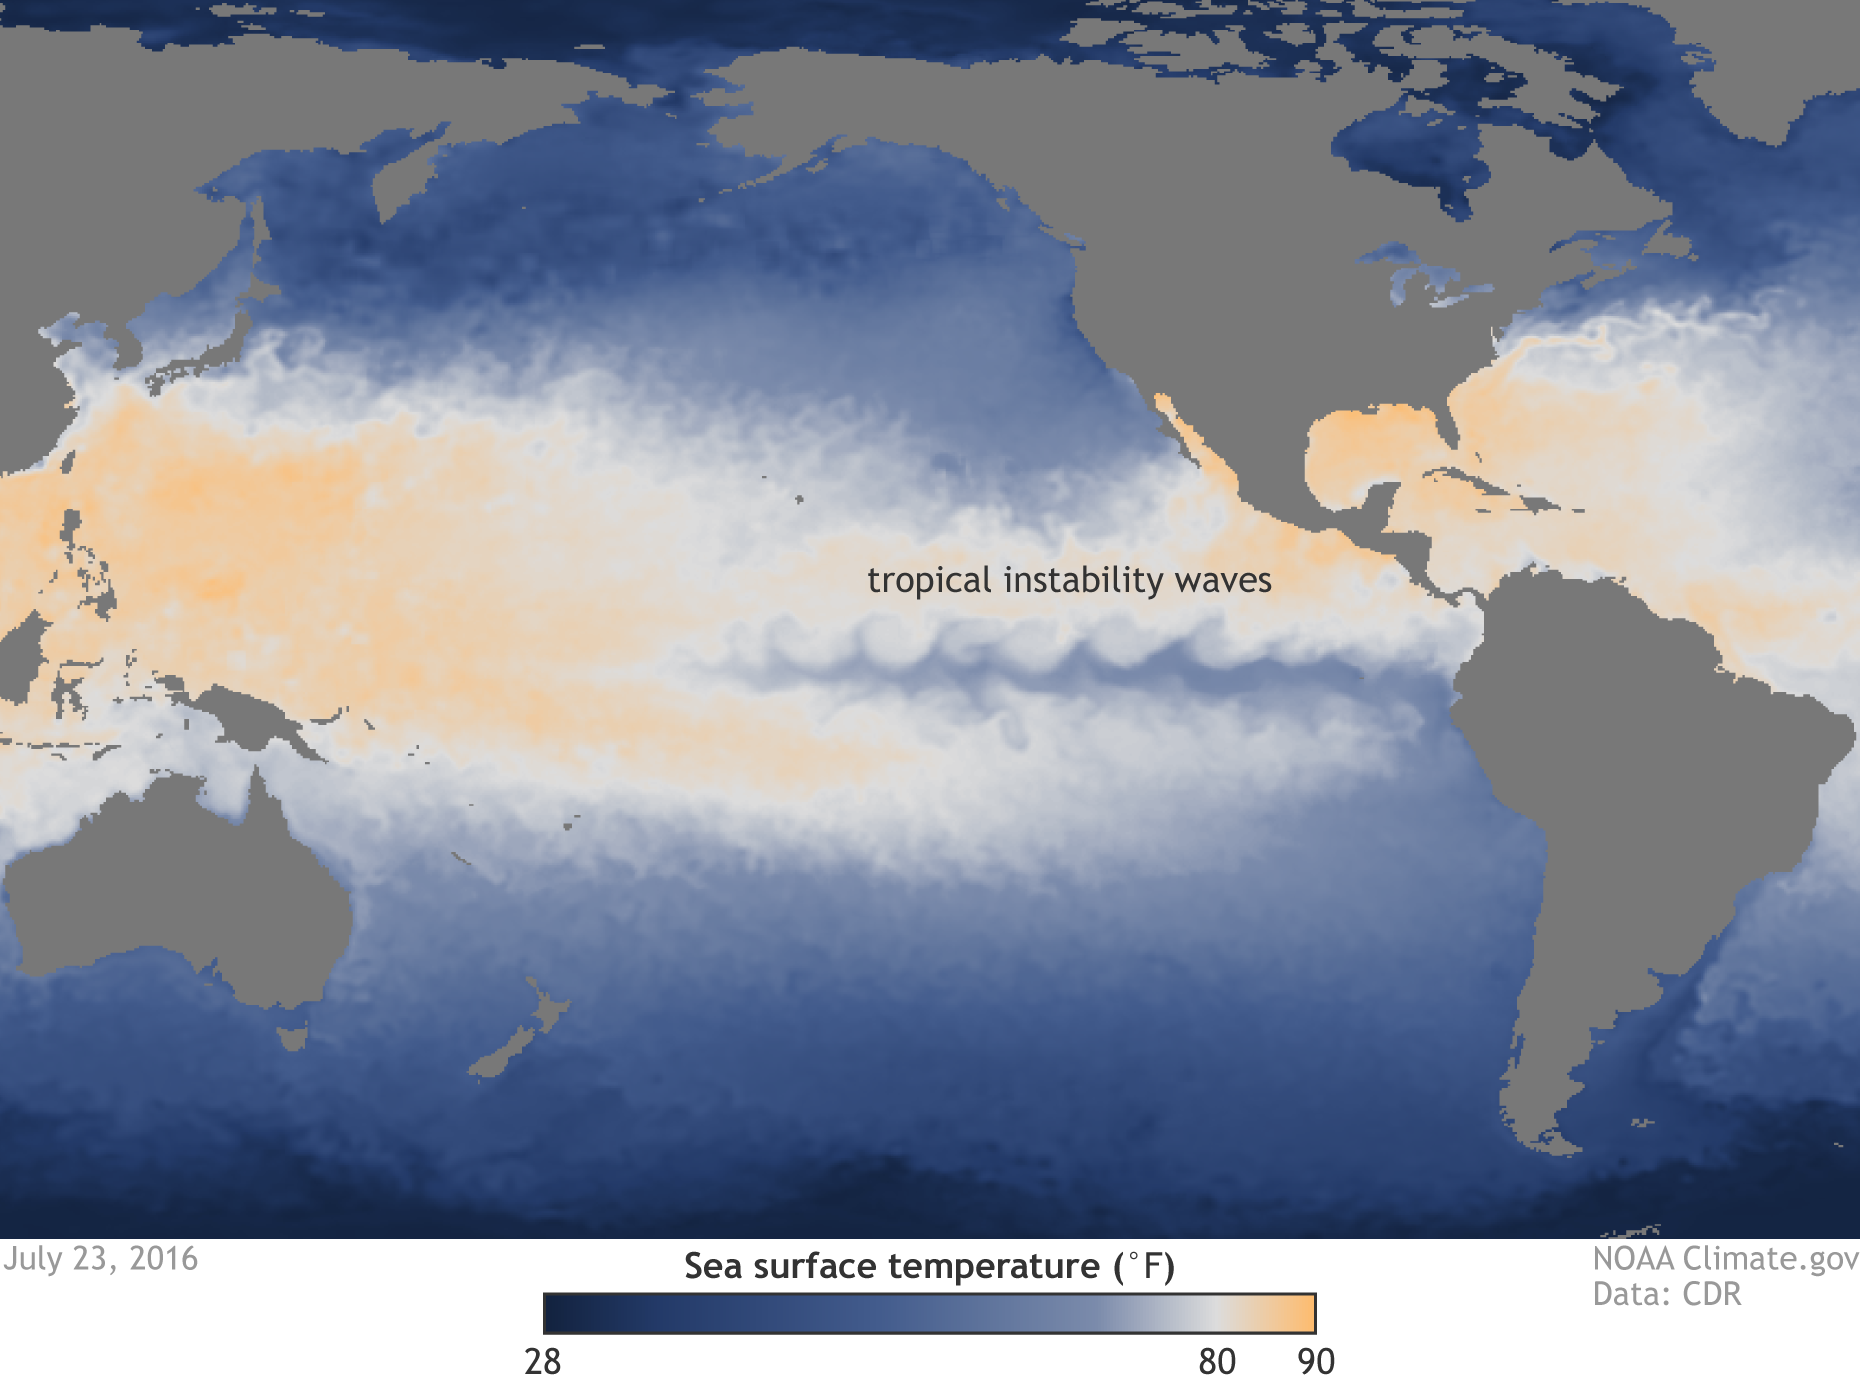
Sea surface temperature from June 1 through July 27, 2019. The region of cool water in the tropical eastern Pacific, called the eastern Pacific cold tongue, is clearly visible along the Equator, surrounded by warmer waters to the north and south. The wavy features along the northern and southern borders between the cold tongue and the warmer waters are tropical instability waves. The waves on the north side are clearer in part due to the stronger temperature gradient on that side of the cold tongue. Map by NOAA Climate.gov from CDR data.
Nat also referred to this post by Emily Becker that explains that ENSO Neutral does not mean nothing is happening.
August 2016 ENSO update: Wavy gravy
It is not directly related as it is about La Nina but it is pretty interesting so I have included it. We do have the so-called cold tongue jutting out from Equador so we do have what is discussed in that blog post just not as strong as it would be if this developed into La Nina which is not likely for 2020. .
It is useful to Compare El Nino to La Nina
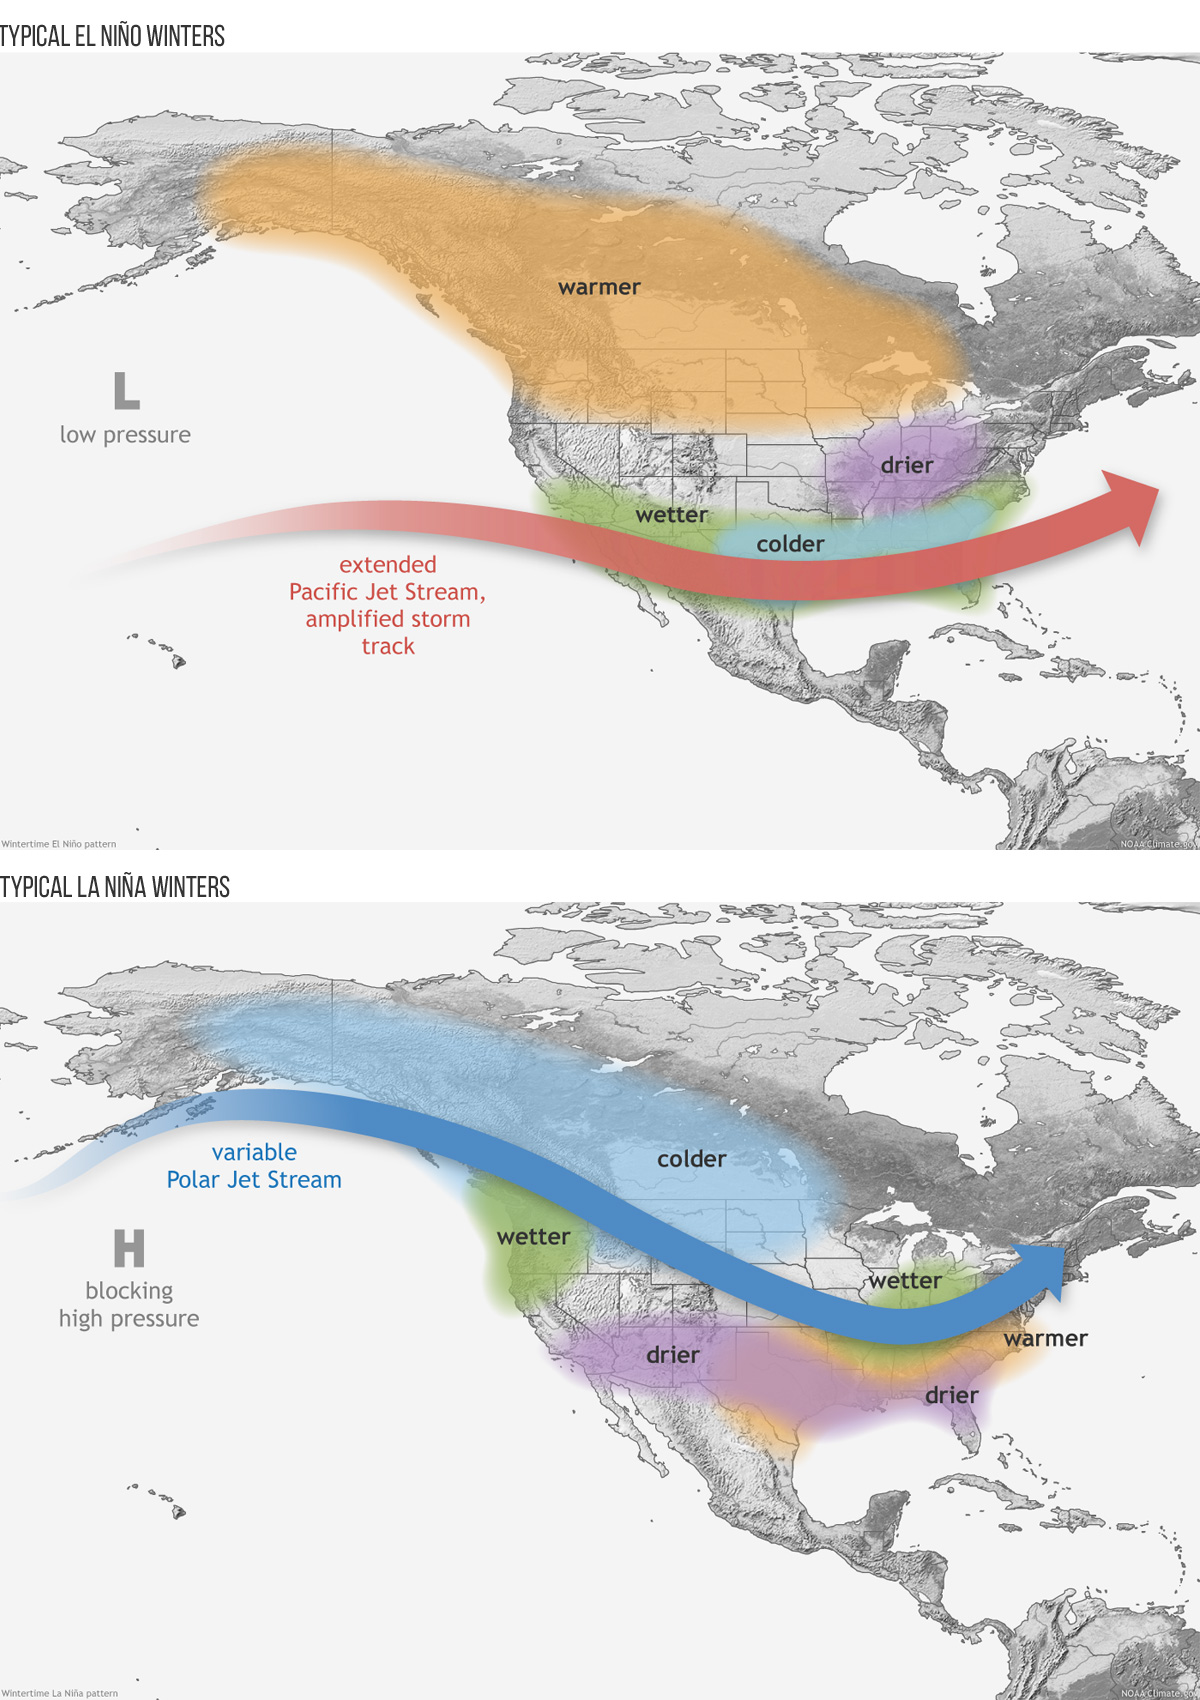
The first two graphics and there are many versions of these graphics but the above are very colorful, show how the Jet Stream tends to be further south during an El Nino (not this past winter). Notice the Aleutian Low in the El Nino graphic. The Blocking High in the La Nina pattern is reminiscent of summer weather but it is further off shore than a typical summer so it allows Pacific storms to enter the U.S. via the Northwest.
ENSO Neutral would be somewhat in between what is shown in the above two graphics.
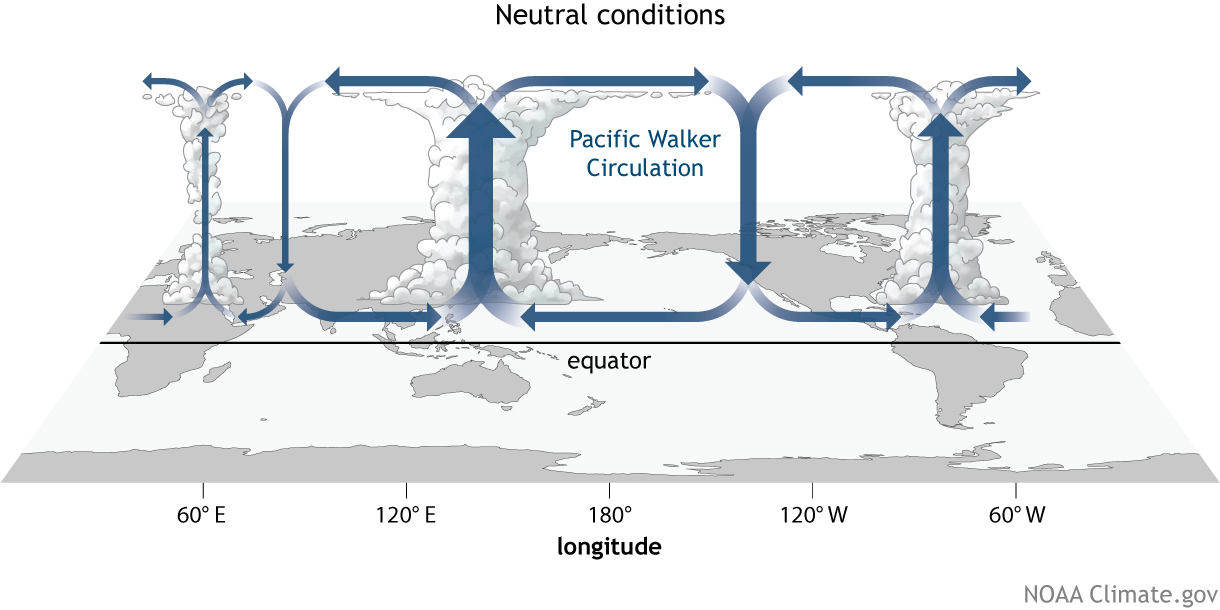
Walker Circulation
Now we take a look at the Walker Circulation which is where the warm water causes evaporation and convection (cloud formation) and where these clouds tend to drop their precipitation which creates downwards air movements. The colors also reveal the location of warmer than climatology and cooler than climatology Sea Surface Temperatures (SST) which are used to define the pattern. Pay special attention to the water along the Equator.
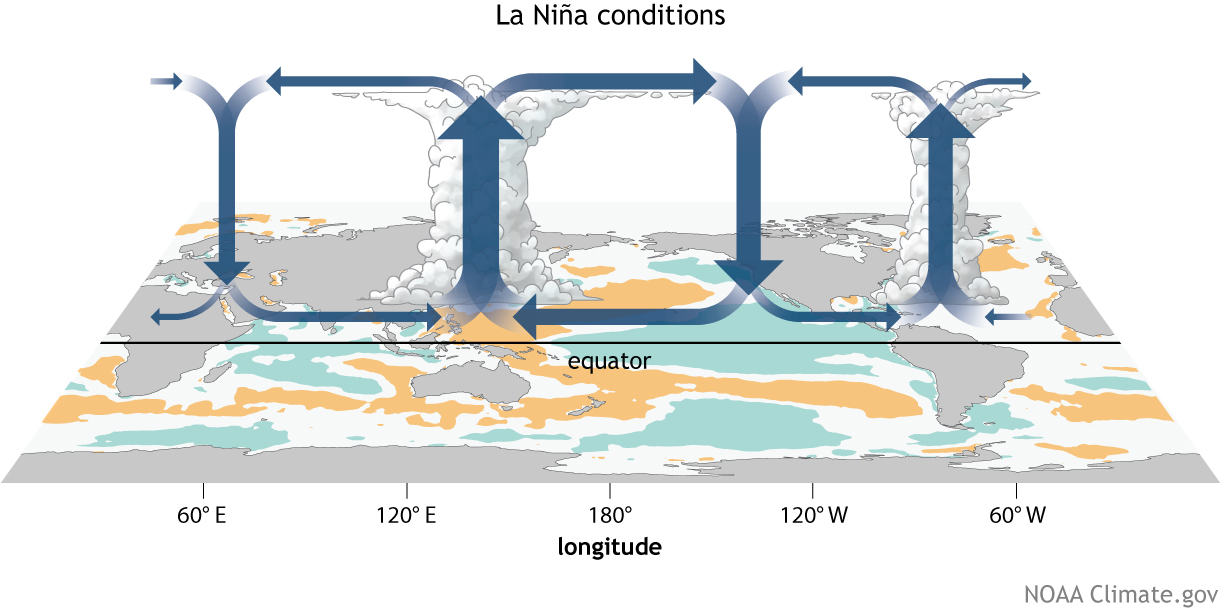
It is difficult to see the difference between the La Nina (above) and Neutral conditions (below) but you should pay attention to the more pronounced (darker – thicker arrows) convection zone in the El Nino state as compared to the Neutral state and similarly the stronger subsidence zone in the La Nina state. Subsidence tends to warm and dry air masses.
It is a lot easier to see the difference between Neutral and El Nino as the pattern tends to reverse with Convection Zones converting to Subsidence (drying) Zones. This winter the Convection Zone was further west than usual and I have mentioned that almost every week.

But these are theoretical constructs and are only a guide to trying to understanding what is going on. And of course these graphics do not address Modokis and yet we are coming out of a Modoki.
Conclusions
I think NOAA has it correct. They might have pulled the trigger sooner but they are appropriately cautious. Their discussion to be issued on August 15, 2019 will be very interesting and we will report that probably on August 16, 2019. And the comparison that we make between the NOAA forecast and the JAMSTEC forecast will also be very interesting and we will report that probably on August 18, 2019.
I recommend that all those who are impacted by the weather read our reports or access the information directly from NOAA or JAMSTEC. The reports in the major media often do not have sufficient detail to be fully useful.


