Written by Sig Silber
Here are the March 21 NOAA 15 month forecasts for CONUS and Alaska and also the JAMSTEC Three-Season forecasts for the World. We compare the two for CONUS and Alaska. Although not totally in disagreement. there is a lot of difference between the NOAA forecast for CONUS and that of JAMSTEC. This seems due to different views as to how the current ENSO warm event will play out. The difference seems to be primary with respect to the duration and rate of decline of this Warm Event. We have provided more analysis for Europe than the rest of the World. For the rest of the world, consult the forecast maps which tell the story. We have commented on them and so has JAMSTEC.

Please share this article – Go to very top of page, right hand side for social media buttons.
Prologue
I do this later in the article but let’s start by looking at the El Nino forecasts of the two meteorological agencies expressed by their forecast for the Nino 3.4 Index.
The first is a probability forecast by NOAA. It is not clear if they use the below or the later one (click to enlarge or if that does not work right click and hit view image)

They tend to prefer the early one and the later one was not available officially when they prepared the forecast. Notice the major difference. The first image is probabilities of the Nino 3.4 index equalling or exceeding 0.5C warmer than climatology in the Nino 3.4 Measurement Area. The second is a NOAA propriety forecasts model of Nino 3.4 (To update the NOAA model click here), and the third is the JAMSTEC proprietary forecast model for the Nino 3.4 Index.
 |
 |
|

Now to our full report.
This report is organized into a summary that has two tables of graphics that show the temperature and precipitation forecasts for the upcoming three seasons, a brief discussion of the ENSO assumptions by both NOAA and JAMSTEC and then the NOAA and JAMSTEC Agency discussions and then a comparison of the two forecasts which is basically an expansion of the summary table. We also take a look at the new NOAA forecast and how it compares to the forecast issued last month.
Summary of the NOAA and JAMSTEC Forecasts
For those who want a quick synopsis of the two forecasts, below is a summary of the temperature and precipitation forecasts for three time-periods and from left to right the NOAA forecast for Alaska and CONUS (the contiguous mid-latitude U.S), then JAMSTEC for North America (which includes Canada and Mexico), and then JAMSTEC for Europe and surrounding areas. Larger graphics are provided later in the report. (the graphics in the Summary Table are not set up to be clicked on to enlarge). The Summary Table is kind of a tease to keep you reading but you can see the evolution of the weather pattern through Spring, Summer and into Fall. For some readers, these two sets of summary graphics may be all the information they wish to look at and that is fine. The discussion in the Summary Table is necessarily succinct and the discussion later in the report goes into somewhat more detail on the differences in the forecasts.
Temperature
| NOAA Alaska Plus CONUS | JAMSTEC North America | JAMSTEC Europe | |
Spring MAM 2019 for JAMSTEC AMJ for NOAA |  |  |  |
Summer JJA 2019 |  |  |  |
Fall SON 2019 |  |  |  |
Precipitation
| NOAA Alaska Plus CONUS | JAMSTEC North America | JAMSTEC Europe | |
Spring MAM 2019 for JAMSTEC AMJ for NOAA |  |  |  |
Summer AMJPrecip JJA 2019 |  |  |  |
Fall SON 2019 |  |  |  |
A. Focus on the NOAA Update
A note about terminology; the deviations from climatology/normal are color coded but also labeled “A” for more than (above) normal and “B” for less than (below) normal. The area designated EC means Equal Chances of being more or less than normal. In my comments For the shorter-term maps, NOAA uses “N” instead of “EC” as they believe they can be more definitive with respect to shorter timeframes. So the words “warm”, “cool”, “wet”, “dry” should be generally interpreted as being relative to climatology/normal for that location and time of year.
First, we will take a look at the NOAA Early Outlook for March, 2019. It is called the Early Outlook because it will be updated at the end of February. Only the March Outlook will be updated at that time.
Temperature

Precipitation

We have nothing to compare these maps with as NOAA does not in their Update provide a forecast for each of the subsequent two months separate from their three-month forecast. Thus I do not have previously forecast maps for April from the previous NOAA Report to compare against. And the current month is not over so we can not really compare the forecast for next month against the actual for this month. It is probably best to just try to understand what NOAA is trying to convey about April which for Temperature is a cool* anomaly that extends from the Dakotas/Minnesota into Texas with a warm* East Coast and a warm* Northwest. And for precipitation, there is an “L” shaped wet anomaly running from Texas east and Texas north to the top of the cool anomaly.
* compared to normal/climatology for the indicated time of the year.
Visual Consistency Testing.
It is useful to see how the month forecast fits with the set of shorter forecasts that we have.
First Temperature
 |  |  |
| The new monthly forecast is to the right. Does it appear to be reflective of the three parts of the month for which we have forecasts? → |
| ↑ ← The full month forecast seems to fit well with the Week 3 – 4 forecast. We do not have the last eleven days of the month in the sequence of maps above. We will revisit this question at the end of March when the April forecast is updated. |
And then Precipitation
 |  |  |
| The new monthly forecast is to the right. Does it appear to be reflective of the three parts of the month for which we have forecasts? → |
| ↑ ← The full month forecast does not seem to fit reasonably well with the Week 3-4 Map. It seems not to be sufficiently wet. But we do not have the last eleven days of the month in the sequence of maps above. We will revisit this question at the end of March when the April forecast is updated. |
Now we consider the three-month Outlook.
Notice that the three-month periods are abbreviated e.g. April/May/June is shown as AMJ. You will see such abbreviations often in this report.
Prior Temperature Outlook for AMJ 2019 (sorry about the poor quality image but I forgot to save the image from last month’s forecast so I had to reconstruct it from a smaller image and it lost resolution but it can still be compared to the new forecast).

New Temperature Outlook for AMJ 2019
Prior Precipitation Outlook for AMJ – 2019

New Precipitation Outlook for MAM, 2019
And here is the new Seasonal Drought Forecast.

Now let us focus on the long-term situation.
Prior 14 Month Temperature Outlook: AMJ 2019 – FMA 2020

New 14 Month Temperature Outlook: MJJ 2019 – AMJ 2020

To compare maps from one release to another, one needs to remember that the new release drops one three-month period and adds a later one. So to make the comparisons one has to shift the new maps to the right one position and that makes the map on the right drop down to become the left-most map in the next level. I do not have a computer software tool for doing that for you so you have to do it mentally. When I do the comparison, I print the two sets of maps and put them side by side and number the same three-month maps 1, 2, 3,…..,11 in both sets of maps to make it easier for me to easily compare the same three-month period in the new with the previous forecast. One uses the same procedure to compare the precipitation maps. Based on this procedure, I conclude that:
Now Precipitation
Prior 14 Month Precipitation Outlook: AMJ 2019 – MAM 2020

New 14 Month Precipitation Outlook: MJJ 2019 – AMJ 2020

If you want larger versions of each map (temperature and precipitation) you can find them here. And then each of those maps can be clicked on to further enlarge them.
Sometimes it is useful to compare the three-month outlook to the forecast for the first of the three months. It shows how much the pattern changes over the three-month period.

One can mentally subtract the First-Month Outlook from the Three-month Outlook and create the Outlook for the last two months in the three-month period.
Below is the NOAA Discussion (slightly reorganized and with a bit of the redundancy and some discussion of methodology removed) released by NOAA on March 21, 2019. Headings that are “Initial Cap” only rather than all caps were added by the Author of this Update Report for clarity. Also, we have organized the sequence of the sections of NOAA Discussion to first present the Atmospheric and Oceanic Conditions and then the Initial Month (April), the new NOAA Summary for AMJ, and finally the remainder of the 15 Month Forecast. We have in the past reorganized some of the material to consolidate it into the first three months of the forecast. The new NOAA Summary for the first three months is not very detailed but it performs that function. Overall the NOAA forecast discussion has shown continual improvement in being a very useful read.
CURRENT ATMOSPHERIC AND OCEANIC CONDITIONS
Weak El Nino conditions remained in place in the Pacific Ocean during March 2019. Sea surface temperatures (SSTs) along the equatorial Pacific Ocean remain above +0.5 degrees C with many areas above +1.0 degrees C for the most recent 4-week average and the latest Nino3.4 value is +1.0 degrees C. Oceanic heat content (ocean temperature anomalies from the surface to a depth of 300 m along the equatorial Pacific) has rapidly once again increased over the past two months. Atmospheric conditions continue to respond to the anomalous SST forcing with enhanced convection now more consistently observed along the equator near the Date Line and just to the west and east. Modest westerly wind anomalies along the equator and an upper-level anticyclonic circulation north of the equator in the central Pacific are also now present. Collectively, these combined oceanic and atmospheric conditions represent a continuation of weak El Nino conditions as designated in early February 2019.
A review of other boundary conditions relevant to the seasonal outlook are soil moisture anomalies, current snowpack and in some areas near coastal SSTs. Widespread and persistent above normal precipitation for most of the CONUS during the winter months and especially during February and March has resulted in very high positive soil moisture anomalies for parts of California, but especially for many areas of the central and eastern CONUS. Moreover, the exceptionally anomalous and persistent cold that impacted much of the western and north central CONUS in February into March, combined with a persistent storm track, rapidly increased snowpack for the northern Plains, western Great Lakes and much of the West. The lack of sea ice in waters bordering much of western Alaska have remained free of or have below normal sea ice coverage and thickness.
PROGNOSTIC DISCUSSION OF SST FORECASTS
The CPC SST Consolidation forecast for Nino3.4 depicts the continuation of a weak El Nino. There is considerable spread, however, in its constituent input models with the CA favoring ENSO neutral conditions, the CCA and Markov statistical models forecasting an increase in Nino3.4 SST during summer 2019 into the winter of 2019-2020. The dynamical model CFS forecast increases in positive value through autumn 2019 to moderate or strong strength (as indicated by this measure). The NMME suite of models also shows large spread with some solutions depicting a strong event by autumn, some maintaining a borderline weak-moderate event to autumn and still others favoring a decrease to ENSO neutral conditions by autumn.
30-DAY OUTLOOK DISCUSSION FOR MARCH 2019
THE CLIMATIC BACKGROUND STATE STILL FEATURES AN ON GOING EL NINO. THE MADDEN-JULIAN OSCILLATION IS LIKELY TO BE ACTIVE OVER THE INDIAN OCEAN DURING THE FIRST WEEK TO 10 DAYS, WHICH WOULD FAVOR A SWITCH TOWARD WARMER IN THE NORTHEAST LATER IN THE MONTH. THE POTENTIAL FOR A MID-MONTH PATTERN CHANGE IS INDICATED IN SOME MODELS, SO UNCERTAINTY IS HIGHER IN AREAS WHERE THE PATTERN CHANGE WOULD HAVE THE GREATEST IMPACTS.
Temperature
FOR THE TEMPERATURE OUTLOOK, THE AXIS OF THE COLDEST AIR FORECAST EARLY MONTH IS PREDICTED TO BE SLIGHTLY FURTHER WEST THAN IN THE MID-MONTH OUTLOOK. THE HIGHEST PROBABILITIES FOR BELOW NORMAL TEMPERATURES NOW STRETCH FROM THE NORTHERN ROCKIES TO THE NORTHERN PLAINS AND SOUTHWARD TO THE CENTRAL PLAINS WHERE EARLY MONTH AND WEEK3/4 OUTLOOKS ALL TILT COLD. MODEL GUIDANCE HAS CHANGED TO A COLDER PATTERN OVER THE NORTHEAST DURING THE FIRST 10 DAYS OF THE MONTH, SO THE UPDATED OUTLOOK REFLECTS THAT CHANGE. LATER MONTH GUIDANCE HAS SOME MODERATION INDICATED FOR TEMPERATURES IN THOSE REGIONS, SO PROBABILITIES REMAIN LOW TO REFLECT THE UNCERTAINTY. ABOVE NORMAL TEMPERATURES ARE FAVORED FOR MOST OF ALASKA, ESPECIALLY THE WEST COAST WHERE ICE COVERAGE OVER THE NEAR-SHORE WATERS IS LOWER THAN NORMAL.
Precipitation
EARLY IN THE MONTH, AN ACTIVE PATTERN IS FORECAST FROM CENTRAL CALIFORNIA EAST TO THE THE GREAT BASIN AND CENTRAL ROCKIES. IF THE CURRENT 7-DAY QPF OUTLOOKS VERIFY, MANY AREAS ACROSS THE WEST WILL RECEIVE ENOUGH PRECIPITATION IN THE FIRST 7 DAYS OF THE MONTH TO COMPLETELY ELIMINATE POSSIBILITIES FOR BELOW NORMAL PRECIPITATION. THE CFS DEPICTS A PATTERN FLIP TO A DRIER PATTERN ACROSS THE WEST DURING THE LATTER HALF OF MARCH. A STRONG SIGNAL FOR ABOVE NORMAL PRECIPITATION REMAINS FROM THE SOUTHEAST TO THE MID-ALTANTIC AND SOUTHERN PORTIONS OF THE NORTHEAST, IMPLYING THE MEAN BAROCLINIC ZONE AND ACTIVE STORM TRACK IS SOUTH OF THE COLD AIR FOR AT LEAST THE FIRST 10 DAYS OF THE MONTH. WESTERN ALASKA SHOULD START OFF THE MONTH WET, WHILE THE ALASKA PANHANDLE IS LIKELY TO BE RELATIVELY DRY, WITH A MID-MONTH FLIP TOWARD A WETTER THAN NORMAL PATTERN INDICATED IN THE CFS AND JMA FOR WEEK3/4. THE FORECAST MORE HEAVILY REFLECTS THE EARLY MONTH GUIDANCE, BUT PROBABILITIES FOR BELOW NORMAL PRECIPITATION OVER THE ALASKA PANHANDLE REMAIN MODEST.
SUMMARY OF THE OUTLOOK (beyond April) FOR NON-TECHNICAL USERS
The April-May-June (AMJ) 2019 temperature outlook favors above normal seasonal mean temperatures for Alaska, the Pacific Northwest and from southern Texas northward to the eastern Great Lakes and eastward to the East Coast. Probabilities exceed 50% for Alaska, areas in the Pacific Northwest, mid-Atlantic and Northeast. Below normal temperatures are favored at modest odds for the northern and central Great Plains.
The AMJ 2019 precipitation outlook indicates enhanced odds of above normal seasonal total precipitation amounts for much of interior Alaska and for a region extending from the central Great Basin eastward and southward to the Gulf of Mexico and Atlantic seaboard. Below normal precipitation is favored for the Alaska Panhandle and parts of the Pacific Northwest. All precipitation probabilities are modest and do not reach 50% probability.
Equal Chances (EC; white areas) of below, near, and above normal seasonal mean temperatures or seasonal total precipitation amounts are where odds for these three categories are similar to their climatological probabilities. Review of subsequent season outlooks and the scientific forecast basis for all outlooks are given below.
BASIS AND SUMMARY OF THE CURRENT LONG-LEAD OUTLOOKS
PROGNOSTIC TOOLS USED FOR U.S. TEMPERATURE AND PRECIPITATION OUTLOOKS
The temperature and precipitation outlooks were based on some consideration and potential impact from the ongoing El Nino base state, however, due to the high uncertainty of its evolution in coming months as well as a typically weaker signal during the warm season, impacts associated with El Nino during the warm season were limited. Most recent soil moisture conditions (both contemporaneous and lagged as well as local versus remote influences) were considered as well as recent snowpack observations and near coastal SST anomalies. Several statistical, hybrid and consolidated forecast tools as well as dynamical model guidance from the NMME and IMME were also a substantial part of the outlook preparation. Long term trends were considered at all leads but especially for later outlooks.
PROGNOSTIC DISCUSSION OF OUTLOOKS – AMJ 2019 TO AMJ 2020
TEMPERATURE
The forecast rationale for preparation of the AMJ – JAS 2019 seasonal mean temperature outlooks utilized and considered several factors including the ongoing El Nino base state (albeit weak) and its potential evolution into and through the summer months, strongly anomalous land surface states and dynamical model consistency and confidence. Below normal temperatures are favored for a region in the northern and central Great Plains during AMJ 2019 and to a lesser extent in coverage during MJJ 2019. Lag correlation forecast tools relating soil moisture to subsequent future month(s) temperature and soil moisture based constructed analogue statistical guidance both support these forecast areas. Moreover, although a more minor consideration, long term temperature trends , as represented by OCN, also support the potential for below normal temperatures in the northern portion of these areas in AMJ and MJJ 2019. Forecast guidance from ECMWF among some others also support below normal temperatures, primarily in the southern portions of these areas. For JJA and JAS 2019, potential El Nino influence and residual land surface state feedback resulted in less coverage and lower probabilities for above normal temperatures for parts of the Southwest, south-central Great Plains and western Ohio Valley compared to the previous set of outlooks.
From AMJ – JAS 2019, areas where odds for above normal temperatures are indicated are supported overwhelmingly by both statistical and dynamical model information. This includes Alaska (primarily for AMJ 2019) where the largest probabilities are along parts of the west and north coast of the state and is linked to the continued downward long term trends in sea ice coverage and thickness, more open water earlier in the seasonal cycle and so greater potential for warmer temperatures impacting portions of the state.
The outlooks from ASO 2019 through NDJ 2019-2020 depict full or near full coverage of the forecast domain for above normal temperatures supported by available statistical and dynamical model forecast tools and guidance. These outlooks, however, were modified for potential El Nino influences in subtle ways (given the high uncertainty of the evolution of ENSO) from the previous set of outlooks through this period. Long term temperature trends dominant the basis for the remaining temperature outlooks through AMJ 2020.
PRECIPITATION
For AMJ 2019, above normal precipitation is forecast at modest probabilities for a large region from the central Great Basin to the Gulf and East coasts, while below normal precipitation is most likely for parts of the Alaska Panhandle and Pacific Northwest. This general precipitation forecast pattern remains, to first order, consistent through JAS 2019. The forecast rationale is based on dynamical model forecast guidance from the NMME and IMME constituent models and is consistent with a potential El Nino influence over the period (primarily for a region stretching from Texas to the northern Rockies and Great Basin). For JJA and JAS 2019, there is a substantial change in the forecast for the northern Rockies from the previous set of outlooks which were mainly based on long term precipitation trends . Above normal precipitation is now forecast to extend into this region through JAS 2019 where there are consistent signals of enhanced wetness from statistical and dynamical model guidance and is consistent with any potential El Nino summer impact.
For ASO and SON 2019, the focus of elevated odds for above normal precipitation shifts over time to the Southwest CONUS. Outlooks from OND 2019 only depict at the current time above normal precipitation for areas in Alaska related to long term precipitation trends . Other areas where similar type trends may be designated at these long forecast leads are somewhat at odds with potential El Nino related impacts during the autumn and winter months of 2019-2020.
And here is the much shorter JAMSTEC Discussion released on March 20, 2019
Prediction from 1st Mar., 2019
ENSO forecast:
As predicted earlier, El Niño/El Niño Modoki-like state has actually emerged in last autumn. Warmer-than-normal sea surface temperature is observed now for the whole tropical Pacific. The SINTEX-F predicts that the current state will continue in spring. Then the tropical Pacific will return to a normal state by summer.Indian Ocean forecast:
As predicted earlier, the Ningaloo Niña off the west coast of Australia has actually emerged and the amplitude quickly amplified in late austral spring. The model predicts that the Ningaloo Niña will continue in early austral autumn, and then decay in late austral autumn. The model predicts the evolution of a positive Indian Ocean Dipole from late summer. However, there is a large uncertainty in the amplitude at present.
Regional forecast:
On a seasonal scale, SINTEX-F predicts that most part of the globe will experience a warmer-than-normal condition in boreal spring, while some parts of western U.S.A. and most part of Russia will experience a colder-than-normal condition. In boreal summer, most part of the globe will experience a warmer-than-normal condition, except for southern China, central Russia, and most parts of Europe.
As regards to the seasonally averaged rainfall in boreal spring, a wetter-than-normal condition is predicted for most part of U.S.A., western part of the South American Continent, eastern China, most part of Indonesia. In contrast, Mexico, region around Venezuela, northern Brazil, Australia, East/West/Southern Africa, northern part of Europe, India, most part of Southeast Asia, and the Philippines will experience a drier-than-normal condition. In boreal summer, a wetter-than-normal condition is predicted for Canada, region around Venezuela, Rio de la Plata Basin, southern West Africa, northern/eastern Europe, central Russia, most part of Southeast Asia, and southern China. In contrast, southern U.S.A., Mexico, Australia, northern West Africa, India, Mongolia, a northern part of the Philippines, Indonesia, and Korean Peninsula will experience a drier-than-normal condition. We notice that Australia may experience warmer and drier than normal condition in austral winter.
The model predicts most part of Japan will experience warmer-than-normal condition in spring as a seasonal average. In boreal summer, most part of Japan may experience hotter- and drier-than-normal condition.
It is useful to look at the forecasts for the Nino 3.4 Index used to determine if the Sea Surface Temperatures meet the criteria for an El Nino(+0.5 C or higher). Here is a brief summary of the Indices of the two Agencies and how they compare.
| One Year | JAMSTEC Two Years | |
| JAMSTEC |
|
|
| CFS.v2 | CPC-IRI Probabilities | |
| NOAA |
|
|
| Comparing the one-year JAMSTEC NINO 3.4 two graphics above to a similar period for both the NOAA models one sees the difference between a peak and decline versus a more steady state. | The IRI/CPC forecast uses different units namely probabilities rather than absolute levels of the NINO 3.4 Index and is more consistent with the JAMSTEC forecast than the CFSv2 model but does not decline as quickly and extends the El Nino longer. | |
| The so-called Modoki index is interesting because it pretty much tracks the JAMSTEC 3.4 Index. I am not sure how to interpret that. |  |


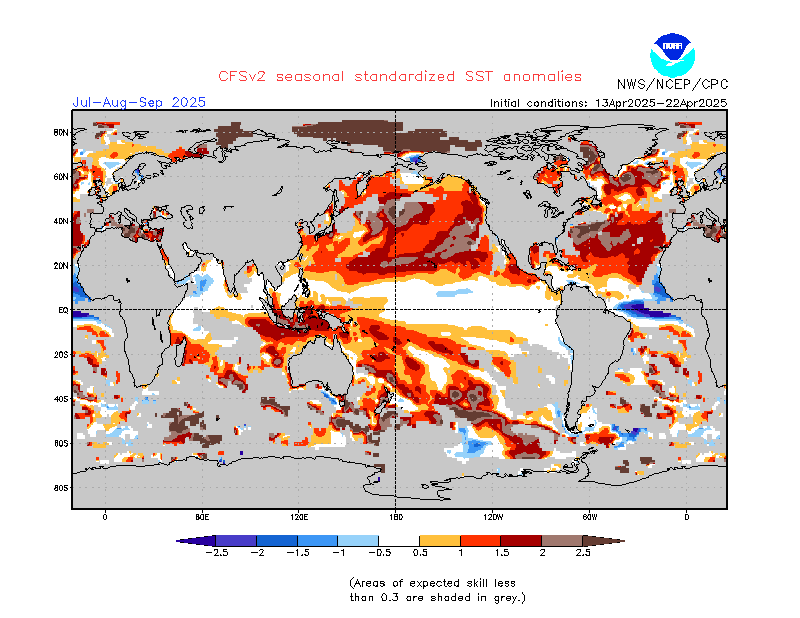
Indices use a single number to convey information. Sometimes it is useful to look at the forecast Sea Surface Temperatures that correlate to the indices. I believe that these SST’s directly correlated with the JAMSTEC model but NOAA uses a variety of tools so it is not so easy to understand exactly how they do their forecast but there is a lot of information on that in their lengthy discussion which was presented earlier.
| NOAA | JAMSTEC |
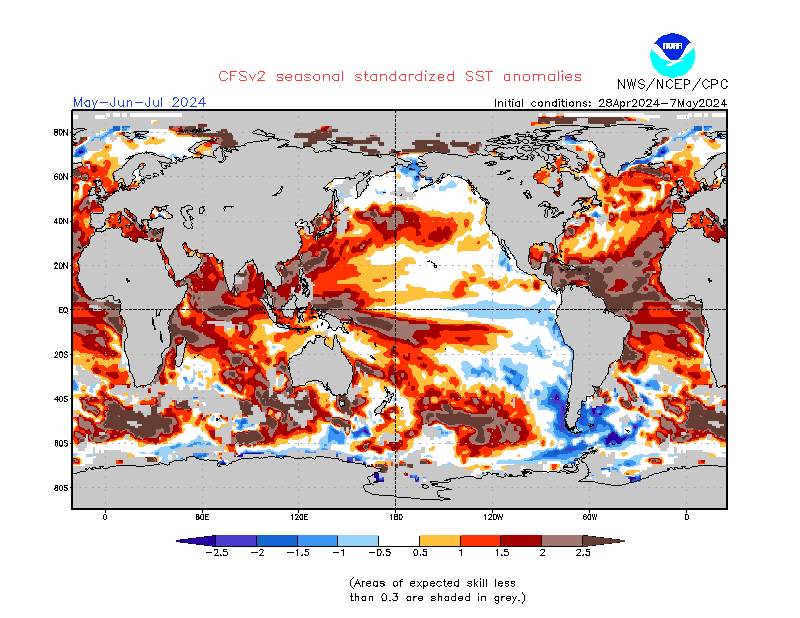 |  |
|  |
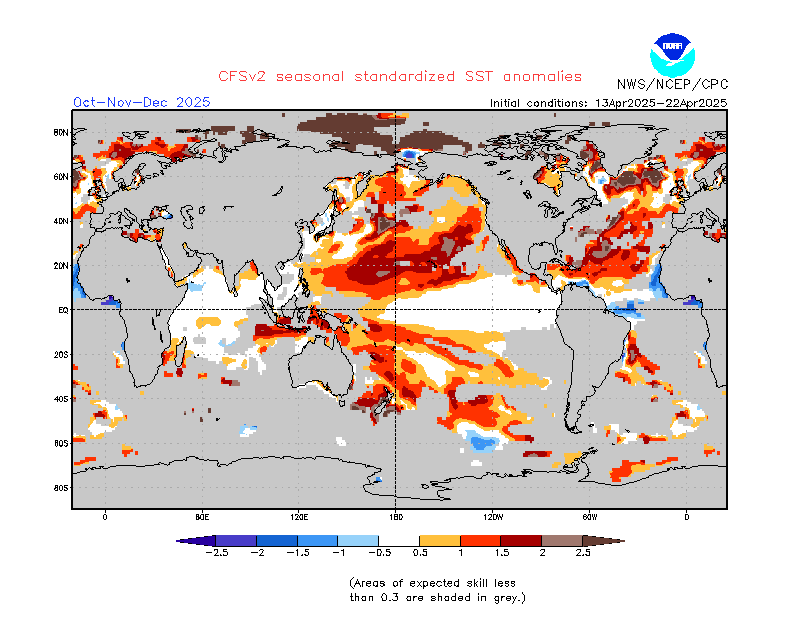 |  |
Updates from JAMSTEC can be found here. Updates from NOAA can be found here. You have to look for the SST row and go to the right where it says “normalized with mask” and click on E3 which provides the latest model run.
All of these forecasts depend to a large extent on what is known about subsurface temperature anomalies. Here is the latest analysis. Updates can be obtained here.

Does the SOI confirm that El Nino Conditions apply?

B. Now we begin our comparison of the NOAA and JAMSTEC Forecasts (Focus on next nine months i.e. three seasons)
In this Update, we compare the JAMSTEC temperature and precipitation forecast maps, which are for the World, with the NOAA temperature and precipitation forecast maps that cover only CONUS and Alaska. We do this primarily for educational purposes.
JAMSTEC works in three-month intervals which correspond to seasons and does not change the selection of months each time they update but does so every three months. At that time they drop one season and add another season further in the future. So for JAMSTEC, we have Spring (MAM), Summer (JJA) and Fall (SON). NOAA provides maps for each three-month period starting with AMJ. JAMSTEC only provides three sets of maps and they only change every three months. So one out of three months the first season lines up perfectly. In one month, the JAMSTEC first season is already underway and in another month it starts one month out. This month the MAM Spring Season is already underway so we are comparing the NOAA AMJ forecast with the JAMSTEC MAM forecast which includes a month that has two-thirds already happened.
The timing of the forecasts is something to consider. NOAA releases their Seasonal Outlook on the third Thursday of the month so one expects that the material was compiled perhaps two days earlier than the date when it is published. JAMSTEC does not have a consistent time for releasing their forecast but their Nino 3.4 forecasts are dated the 1st of the month. Their Nino Index graphic and their forecast maps are usually placed on their web site just before NOAA issues their Seasonal Outlook but this month they were posted early. So one is not sure that the “initial conditions” for both forecasts are the same. It is not possible for me to know exactly what information the two agencies used in the preparation of their forecasts although the NOAA discussion provides a lot of information on that. I have assured myself that this detail of the way the two forecasts are produced has not had a major impact this month but I am not sure of that. I believe the differences have more to do with the subtle differences in the forecast for Nino 3.4.
I show the NOAA Maps first followed by the JAMSTEC maps. I extract North America from the Worldwide JAMSTEC map and use that to compare with the NOAA Maps. I also extract Europe including parts of North Africa and Western Asia from the Worldwide JAMSTEC maps and include those excerpted maps in the summary table at the beginning of this article.
Spring 2019.
Temperature
NOAA (AMJ)
And here is the MAM 2018/2019 temperature forecast for North America that I extracted from the JAMSTEC World Forecast.
And now the JAMSTEC WORLD FORECAST (for this graphic my comments are mostly related to areas other than Alaska and CONUS as those comments appear with the larger graphics above)

Precipitation
NOAA (AMJ)
And here is the MAM 2019 Precipitation Forecast for North America that I extracted from the JAMSTEC World Forecast.
JAMSTEC WORLD FORECAST

Summer (JJA – 2019)
Temperature
NOAA
And here is the JJA – 2019 Temperature Forecast for North America that I extracted from the JAMSTEC World Forecast.
JAMSTEC WORLD FORECAST

Precipitation
NOAA
And here is the JJA – 2019 Precipitation Forecast for North America that I extracted from the JAMSTEC World Forecast.
JAMSTEC WORLD FORECAST

Fall (SON 2019)
Temperature
NOAA
And here is the SON 2019 Temperature Forecast for North America that I extracted from the JAMSTEC World Forecast.
JAMSTEC WORLD FORECAST

Precipitation
NOAA
And here is the JJA 2019 Precipitation Forecast for North America that I extracted from the JAMSTEC World Forecast
JAMSTEC WORLD FORECAST

Conclusion
Both NOAA and JAMSTEC have forecasts that in one way or another incorporate an El Nino of some sort in their forecasts. But the timing of the peak and demise of the El Nino varies a lot between the two agencies.
Neither is forecasting a particularly robust El Nino so the differences tend to be more subtle than if it was a strong El Nino. What we have is a forecast for a marginal El Nino. The next phase of ENSO also varies between the two forecasts although JAMSTEC makes it easier to see their longer-term view than NOAA.


