
Written by Steven Hansen
The headline data for February and March shows a decline in income and an increase in expenditures.

Analyst Opinion of Personal Income and Expenditures
Note the following from the BEA:
Due to the recent partial federal government shutdown, this report combines estimates for February and March 2019. Personal Income is updated for January and February and new estimates are available for March. Personal consumption expenditures are updated for January and new estimates are available for February and March.
Consumer income growth year-over-year is now much less than the spending growth year-over-year. For sustained growth of expenditures, income needs to grow at nearly the same rate.
Savings growth significantly weakened.
The real issue with personal income and expenditures is that it jumps around – and one cannot take any single month as fixed or gospel. This month all trendlines reversed (income Vs. expenditures)
- The market looks at current values (not real inflation adjusted) and was expecting (from Econoday):.
| February 2019 | Consensus Range | Consensus | Actual |
| Personal Income – M/M change | 0.1 % to 0.4 % | +0.3 % | -0.1 % |
| Consumer Spending – M/M change | 0.1 % to 0.6 % | +0.2 % | +0.1 % |
| PCE Price Index — M/M change | 0.2 % to 0.2 % | +0.1 % | +0.1 % |
| Core PCE price index – M/M change | 0.1 % to 0.2 % | +0.1 % | +0.1 % |
| PCE Price Index — Y/Y change | +1.3 % | ||
| Core PCE price index – Yr/Yr change | 1.7 % to 1.8 % | +1.8 % | +1.7 % |
March 2019 | Consensus Range | Consensus | Actual |
| Personal Income – M/M change | 0.3 % to 0.5 % | +0.4 % | +0.1 % |
| Consumer Spending – M/M change | 0.5 % to 0.8 % | +0.7 % | +0.9 % |
| PCE Price Index — M/M change | 0.2 % to 0.4 % | +0.3 % | +0.2 % |
| Core PCE price index – M/M change | 0.0 % to 0.2 % | +0.1 % | +0.0 % |
| PCE Price Index — Y/Y change | 1.6 % to 1.9 % | +1.7 % | +1.5 % |
| Core PCE price index – Yr/Yr change | 1.6 % to 1.9 % | +1.7 % | +1.6 % |
- The market looks at current values (not real inflation adjusted) and was expecting (from Econoday):.
- The monthly fluctuations are confusing. Looking at the inflation-adjusted year-over-year 3-month trend rate of growth, disposable income growth rate trend declined while consumption’s growth rate improved.
- Real Disposable Personal Income is up 2.3 % year-over-year, and real consumption expenditures are up 2.9 % year-over-year.
- The latest 1Q2019 GDP estimate indicated the economy was expanding at 3.2 % (quarter-over-quarter compounded). Expenditures are counted in GDP, and income is ignored as GDP measures the spending side of the economy. However, over periods of time – consumer income and expenditure grow at the same rate.
- The savings rate is 6.5 % (a decline from February’s 7.3 %.

z pce_table.png
The inflation-adjusted income and consumption are “chained”, and the headline GDP is inflation adjusted. This means the impact on GDP is best understood by looking at the chained numbers. Econintersect believes year-over-year trends are very revealing in understanding economic dynamics.
Per capita, inflation-adjusted expenditure has exceeded the pre-recession peak.
Seasonally and Inflation Adjusted Expenditure Per Capita

The graph below illustrates the relationship between income (DPI) and expenditures (PCE) – showing clearly income and expenditures grow at nearly the same rate over time.
Indexed to Jan 2000, Growth of Real Disposable Income (blue line) to Real Expenditures (red line)

The short term trends are mixed depending on the periods selected.
Seasonally Adjusted Spending’s Ratio to Income (a declining ratio means the consumer is spending less of its Income)

PCE is the spending of consumers. In the USA, the consumer is the economy. Likewise, personal income is the money consumers earn to spend. Even though most analysts concentrate on personal expenditures because GDP is based on spending, increases in personal income allow consumers the option to spend more.
There is a general correlation of PCE to GDP (PCE is a component of GDP).
Seasonally and Inflation Adjusted Year-over-Year Change of Personal Consumption Expenditures (blue line) to GDP (red line)

Econintersect and GDP use the inflation-adjusted (chained) numbers. Disposable Personal Income (DPI) is the income after the taxes.
Seasonally & Inflation Adjusted Percent Change From the Previous Month – Personal Disposable Income (red line) and Personal Consumption Expenditures (blue line)

Yet year-over-year growth for income and expenditures is below GDP year-over-year growth.
Seasonally & Inflation Adjusted Year-over-Year Change – Personal Disposable Income (red line) and Personal Consumption Expenditures (blue line)

The savings rate has been bouncing around – but the general trend is down. In an economy driven by consumers, a higher savings rate does not bode well for increased GDP. This is one reason GDP may not be a good single metric of economic activity.
Personal Savings as a Percentage of Disposable Personal Income

And one look at the different price changes seen by the BEA in this PCE release versus the BEA’s GDP and BLS’s Consumer Price Index (CPI). We should note that the inflation adjustment is for PCE and Personal Income is usually lower than the ones used for GDP and CPI.
Year-over-Year Change – PCE’s Price Index (blue line) versus CPI-U (red line) versus GDP Deflator (green line)

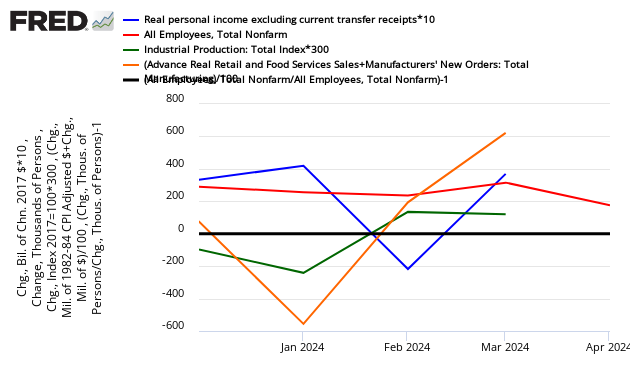
Finally for recession watchers, here is the graph below, here are the elements used to mark a recession. (1) personal income less transfer payments, in real terms and (2) employment. In addition, we refer to two indicators with coverage primarily of manufacturing and goods: (3) industrial production and (4) the volume of sales of the manufacturing and wholesale-retail sectors adjusted for price changes.
If a line falls below the 0 (black line) – that sector is contracting from the previous month. Personal income is the blue line. Note – the below graph uses multipliers to make movements more obvious (ignore the value of the scale, only consider whether the graph is above [good] or below [bad] the zero line).
Month-over-Month Growth Personal Income less transfer payments (blue line), Employment (red line), Industrial Production (green line), Business Sales (orange line)
Caveats on the Use of Personal Income and Consumption Expenditure Data
PCE is a fairly noisy index and subject at times to significant backward revision. This index cannot be relied upon in real time.
This personal income and personal consumption expenditure data by itself is not a good tool to warn of an upcoming recession. Econintersect has shown that PCE is a distraction for recession watchers, with moves over a few months having a 30% accuracy of indicating a recession start, and a 70% incidence of indicating a non-recessionary event. PCE does have prolonged declines over many months associated with recessions but these long declines are not very good in “predicting” a recession until it is already underway.
Readers are warned that this article is based on seasonally adjusted data. Monthly non-adjusted data is available with a delay of several months.
include(“/home/aleta/public_html/files/ad_openx.htm”); ?>


