
Written by Steven Hansen
We stated last month, “With the mixed economic picture and stock market turmoil one might expect our forecast to significantly degrade” – yet our economic forecast was little changed. This month the Econintersect Economic Index (EEI) significantly declined, and is now below territory associated with normal expansions. This is a departure from the previous three months where the index’s growth rate was little changed.

Please share this article – Go to very top of page, right hand side for social media buttons.
Analyst Summary of this Economic Forecast
The economic data produced this month has significantly degraded. This is the nearly the largest single month drop in our index this century.
Our major worry is the rapid deceleration of growth in rail transport data – a usual flag for a slowing economy. And then there is housing growth going negative – never a good sign (but this time buyers are not buying because housing is not affordable – time will tell if this could be a recession signal).
The forward looking leading and coincident data trends are mostly indicating deceleration of the rate of growth..However, the predictive coincident indices are still showing positive rate of growth trends.
Note that the quantitative analysis which builds our model of the economy does not include housing, personal income, or expenditures data sets.
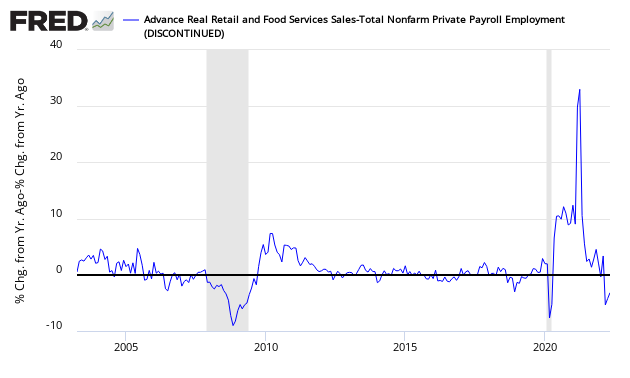
The relationship between retail sales and employment is also degrading – and has crossed over to territory. Historically, when this ratio is in negative territory it indicates a slowing economy. Note that neither employment nor retail sales are part of our economic model.
Econintersect checks its forecast using several alternate monetary based methods – and the checked forecasts are now mixed on forecasted economic growth.
Our employment forecast continues to show good employment growth (but still marginally slowing) six months from today.
Note that the majority of the graphics in this post auto-update. The words are fixed on the day of publishing, and therefore you might note a conflict between the words and the graphs due to new data and / or backward data revisions.
This index is not designed to guess GDP – or the four horsemen used by the NBER to identify recessions (industrial production, business sales, employment and personal income). It is designed to look at the economy at the Main Street level.
The graph below plots GDP (which has a bias to the average – not median – sectors) against the Econintersect Economic Index.

This post will summarize the:
- special indicators,
- leading indicators,
- predictive portions of coincident indicators,
- review of the technical recession indicators, and
- interpretation of our own index – Econintersect Economic Index (EEI) – which is built of mostly non-monetary “things” that have been shown to be indicative of the direction of the Main Street economy at least 30 days in advance.
- our six-month employment forecast.
Special Indicators:
The consumer is still consuming – and the ratio between spending and income remains about average to the levels seen since the Great Recession.
Seasonally Adjusted Spending’s Ratio to Income (an increasing ratio means Consumer is spending more of Income)

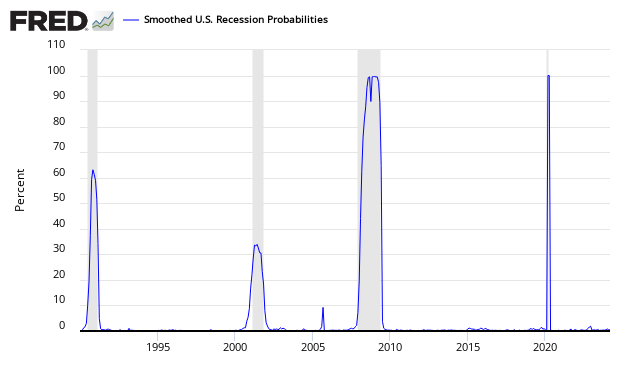
The St. Louis Fed produces a Smoothed U.S. Recession Probabilities Chart which is currently giving no indication of an oncoming recession.
Smoothed recession probabilities for the United States are obtained from a dynamic-factor markov-switching model applied to four monthly coincident variables: non-farm payroll employment, the index of industrial production, real personal income excluding transfer payments, and real manufacturing and trade sales. This model was originally developed in Chauvet, M., “An Economic Characterization of Business Cycle Dynamics with Factor Structure and Regime Switching,” International Economic Review, 1998, 39, 969-996. (http://faculty.ucr.edu/~chauvet/ier.pdf)
Econintersect reviews the relationship between the year-over-year growth rate of non-farm private employment and the year-over-year real growth rate of retail sales. This index has fallen into negative territory. When retail sales grow faster than the rate of employment gains (above zero on the below graph) – a recession is not imminent. However, this index has many false alarms.
Growth Relationship Between Retail Sales and Non-Farm Private Employment – Above zero suggests economic expansion
GDPNow
The growth rate of real gross domestic product (GDP) is the headline view of economic activity, but the official estimate is released with a delay. Atlanta’s Fed GDPNow forecasting model provides a “nowcast” of the official estimate prior to its release. Econintersect does not believe GDP is a good tool to view what is happening at Main Street level – but there are correlations.
Latest forecast: 2.7 percent – December 21, 2018
The GDPNow model estimate for real GDP growth (seasonally adjusted annual rate) in the fourth quarter of 2018 is 2.7 percent on December 21, down from 2.9 percent on December 18. The nowcast of fourth-quarter real personal consumption expenditures growth decreased from 4.1 percent to 3.7 percent after this morning’s personal income and outlays release from the U.S. Bureau of Economic Analysis.

z forecast8.png or source
Nowcast
The New York Fed also has introduced its own economic projection called Nowcast. Its current forecast:
Dec 28, 2018: New York Fed Staff Nowcast
- The New York Fed Staff Nowcast stands at 2.5% for 2018:Q4 and 2.1% for 2019:Q1.
- This week, there were no new releases on the variables tracked by the model.
- The New Residential Sales and Advance Economic Indicators releases scheduled for this week were postponed due to the ongoing partial shutdown of the United States federal government.

z forecast7.png
A yield curve inversion historically has been an accurate predictor of an impending recession. A yield curve inversion is where short term bonds have a higher yield than longer term bonds. The graph below shows inversions prior to USA recessions.

Special Indicators Conclusion:
Most economic releases are based on seasonally adjusted data which are revised for months after issuance. The real trends in a particular release may not be obvious for many months due to data gathering and seasonality adjusting methodologies. The special indicators seem to be indicating a slowing of economic growth.
The Leading Indicators:
The leading indicators are for the most part monetary based. Econintersect‘s primary worry in using monetary based methodologies to forecast the economy is the accomodative monetary policy which may (or may not) be affecting historical relationships.
Econintersect does not use data from any of the leading indicators in its economic index. Leading indices in this post look ahead six months – and are all subject to backward revision.
Chemical Activity Barometer (CAB) – The CAB is an exception to the other leading indices as it leads the economy by two to fourteen months, with an average lead of eight months. The CAB is a composite index which comprises indicators drawn from a range of chemicals and sectors. It is a relatively new index and appears somewhat accurate (but its real time performance is unknown – you can read more here). A value above zero is suggesting the economy is expanding.

ECRI’s Weekly Leading Index (WLI) – A positive number shows an expansion of the business economy, while a negative number is contraction. The methodology used in created this index is not released but is widely believed to be monetary based.
Current ECRI WLI Index

The Conference Board’s Leading Economic Indicator (LEI) – the LEI has historically begins contracting well before a recession but has had false contraction.

z conference1.png
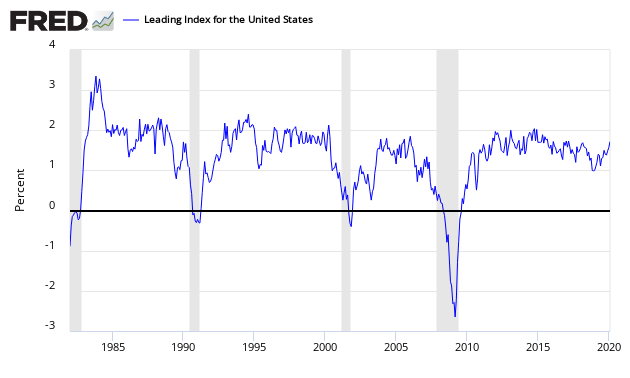
Leading Index for the United States from the Philadelphia Fed – This index is the super index for all the state indices. This index has significant backward revision and is considered close to worthless.
Nonfinancial leverage subindex of the National Financial Conditions Index – a weekly index produced by the Chicago Fed signals both the onset and duration of financial crises and their accompanying recessions. Econintersect now believes this index may be worthless in real time as the amount of backward revision is excessive – so we present this index for information only. This index was designed to forecast the economy six months in advance. The chart below shows the current index values, and a recession usually occurs months to years after the trend line changes from positive to negative.

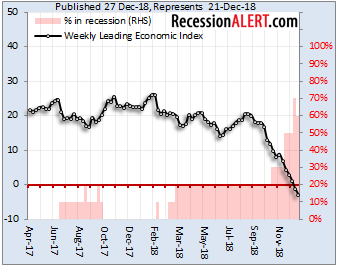
RecessionALERT.com has constructed a Weekly Leading Economic Index (WLEI) for the U.S Economy that draws from over 50 time-series from the following broad categories – Corporate Bond Market Composite, Treasury Bond Market Composite, Stock Market Composite, Labor Market Composite, and Credit Market Composite. From the authors of the index:
Being a weekly growth index, it provides data with at most a 1-week lag, which is far more timely than the lag found on monthly economic indicators. Additionally, it is published on Thursday afternoons, a full 18 hours before the widely known ECRI Weekly Leading Index.
As with all weekly indices though, the data is far more volatile than monthly or quarterly indicators and the WLEI components are therefore subject to more false positives (calling recession when one does not occur.). The WLEI is heavily weighed toward financial market data, but the obvious advantage of this is that data revisions are minor and isolated to the Labor Market Composite and small portions of the Credit Market Composite.
Leading Indicators Conclusion: most are projecting a pigs breakfast of growth (from slowing to improving) – but none indicating a recession over the next six months.
- Chemical Activity Barometer (CAB) growth rate is near average for times of economic expansion and its rate of growth is slowing.
- ECRI’s WLI is forecasting contraction in the business cycle six months from today.
- The Conference Board (LEI) 6 month rolling average suggesting a slowing of growth rates over the next 6 months.
- The Philly Fed’s Leading Index continued backward revisions make this index worthless – however its growth trend currently is projecting a slowing rate of growth.
- The Chicago Fed’s Nonfinancial leverage subindex is not close to warning a recession.
- RecessionAlert’s Weekly Leading Economic Index is in contraction and suggesting a recession may be possible.
Forward Looking Coincident and Lagging Indicators
Here is a run through of the most economically predictive coincident indices which Econintersect believes can give up to a six month warning of an impending recession – and do not have a history of producing false warnings. Econintersect does not use any of these indicators in its economic forecast.
Consider that every recession has different characteristics – and a particular index may not contract during a recession, or start contracting after the recession is already underway.
Truck transport portion of employment – to search for impending recessions. Look at the year-over-year zero growth line. For the last two recessions it has offered a six month warning of an impending recession with only one false warnings. Transport is an economic warning indicator because it moves goods well before final retail sales occur. Until people stop eating or buying goods, transport will remain one of the primary economic pulse points. When this sector turns robotic in the coming years – this measure will become useless – but currently the shift from box stores to e-Commerce is creating much more employment in this sector. Either way – this index may not be capable of alerting the next recession.
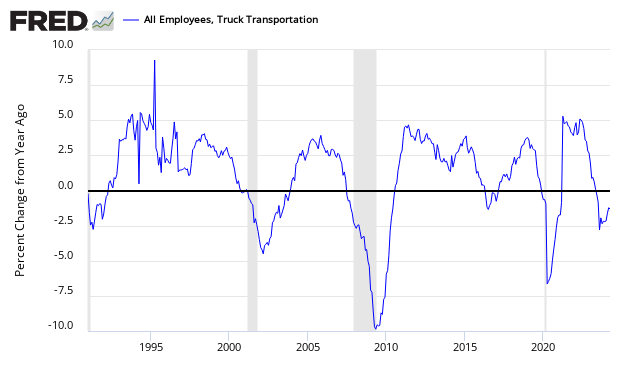
Transport employment growth is well above the zero growth line. As transport provides a six month recession warning – the implication is that any possible recession is more than six months away.
Business Activity Markit US Services Activity Index – this index is noisy. The index is now slightly near 55 (below 55 is a warning that a recession might occur, whilst below 50 is almost proof a recession is underway). This index may not provide timely warnings of recessions.

z%20markit_services.png
US Treasury Tax Receipts – For the Great Recession, the rolling averages went negative in February 2008 – two months after the Great Recession’s start. For the 2001 recession, the rolling averages for tax revenues went negative two months after the official start of the recession. Currently year-over-year rolling average growth is growing 0.6 % year-over-year – up from last month’s -2.4 %.
Year-over-Year Change in US Government Receipts – Monthly (blue line) and Three Month Rolling Average (red line)

z forecast5.png
Predictive Coincident Index Conclusion: The predictive indicies are mixed but not contracting.
Technical Requirements of a Recession
Sticking to the current technical recession criteria used by the NBER:
A recession is a significant decline in economic activity spread across the economy, lasting more than a few months, normally visible in real GDP, real income, employment, industrial production, and wholesale-retail sales. A recession begins just after the economy reaches a peak of activity and ends as the economy reaches its trough. Between trough and peak, the economy is in an expansion. Expansion is the normal state of the economy; most recessions are brief and they have been rare in recent decades.
… The committee places particular emphasis on two monthly measures of activity across the entire economy: (1) personal income less transfer payments, in real terms and (2) employment. In addition, we refer to two indicators with coverage primarily of manufacturing and goods: (3) industrial production and (4) the volume of sales of the manufacturing and wholesale-retail sectors adjusted for price changes.
Below is a graph looking at the month-over-month change (note that multipliers have been used to make changes more obvious).
Month-over-Month Growth Personal Income less transfer payments (blue line), Employment (red line), Industrial Production (green line), Business Sales (orange line)
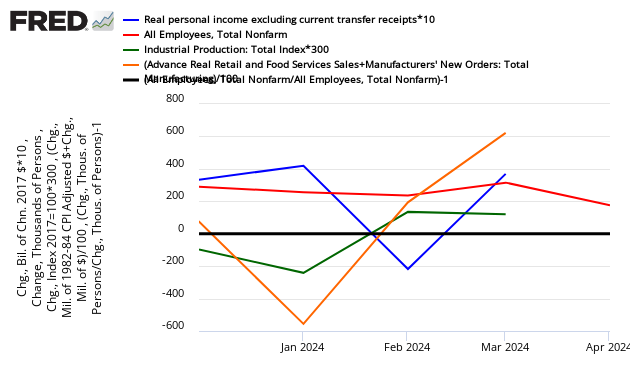
In the above graph, if a line falls below the 0 (black line) – that sector is contracting from the previous month. None are in negative territory. Another way to look at the same data sets is in the graph below which uses indexed real values from the trough of the Great Recession.
Indexed Growth Personal Income less transfer payments (red line), Employment (green line), Industrial Production (blue line), Business Sales (orange line)
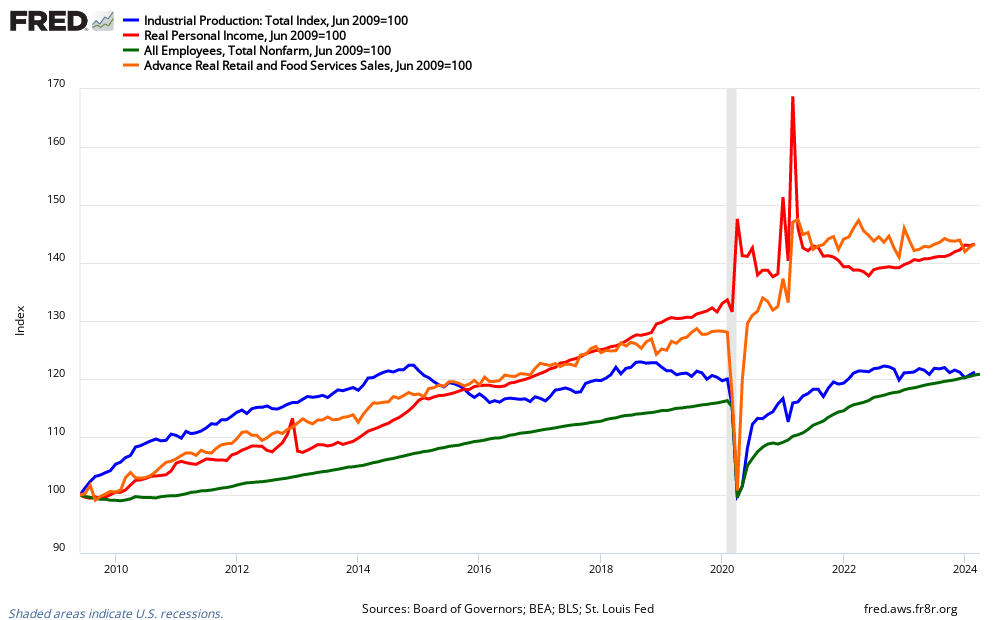
NBER Recession Marker Bottom Line – all in positive or near territory – and no sign of an impending recession.
Econintersect believes that the New Normal economy has different dynamics than most economic models are using.
Economic Forecast Data
The Econintersect Economic Index (EEI) is designed to spot Main Street and business economic turning points. This forecast is based on the index’s three month moving average. The three month rolling index value is now a POSITIVE 0.30 – a significant slowing from last month’s positive 0.44.
A summary of elements affecting our economic index:
- The government portion relating to business and main street slowed and no longer in positive territory.
- The business portion has significantly slowed its rate of growth.
- The consumer portion rate of growth has marginally slowed.
The EEI is a non-monetary based economic index which counts “things” that have shown to be indicative of direction of the Main Street economy at least 30 days in the future. Note that the Econintersect Economic Index is not constructed to mimic GDP (although there are correlations, but the turning points may be different), and tries to model the economic rate of change seen by business and Main Street. The vast majority of this index uses data not subject to backward revision.

The red line on the EEI is the 3 month moving average. The economic forecast is based on the 3 month moving average as the monthly index is very noisy. A positive value of the index represents main street economic expansion. Readings below 0.4 indicate a weak economy, while readings below 0.0 indicate contraction.
Consumer and business behavior (which is the basis of the EEI) either lead or follow old fashion industrial age measures such as GDP depending on the primary dynamic(s) driving the economy. The main street sector of the economy lagged GDP in entering and exiting the 2007 Great Recession.
As Econintersect continues to back check its model, from time-to-time slight adjustments are made to the data sets and methodology to align it with the actual coincident data. To date, when any realignment was done, there have been no changes for trend lines or recession indications. Most changes to date were to remove data sets which had unacceptable backward revisions, became too volatile, or were discontinued. The last realigment was done in the June 2016 forecast to swap an industrial production data set which became to volatile. Documentation for this index was in the October 2011 forecast.
Jobs Growth Forecast
The Econintersect Jobs Index is forecasting non-farm private jobs growth of 190,000 for January – 10,000 lower than last month’s forecast.
Summary of Jobs Forecast
The fundamentals which lead jobs growth are now showing a slowing growth trend in the employment growth dynamics. However, we expect jobs growth over the next six months to exceed the growth needed to maintain participation rates and the employment-population ratios at the current levels.

The Econintersect Jobs Index is based on economic elements which create jobs, and (explanation here) measures the historical dynamics which lead to the creation of jobs. It measures general factors, but it is not precise (quantitatively) as many specific factors influence the exact timing of hiring. This index should be thought of as a measurement of jobs creation pressures.
For the last year, jobs growth year-over-year (green line in below graph) is bouncing around. The forecast by the Econintersect Jobs Index is shown as the blue line in below graph. A fudged forecast (red line in below graph) is based on deviation between forecast & current actual using a 3 month rolling average.

The fudge factor (based on deviation between the BLS actual growth and the Econintersect Employment Index over the last 3 months) would project jobs growth at 200,000 – which is unusually below as the forecasted value. This fudge factor is fluid (subject to change) as the BLS has significant backward revision to their jobs numbers.
Analysis of Economic Indicators:
Econintersect analyzes all major economic indicators. The table below contains hyperlinks to posts. The right column “Predictive” means this particular indicator has a leading component (usually other then the index itself) – in other words has a good correlation to future economic conditions.
General Economic Indicators:
Monthly Data: {click here to view full screen}
Quarterly Data: {click here to view full screen}
Aruoba-Diebold-Scotti Business Conditions Index: {click here to view full screen}
include(“/home/aleta/public_html/files/ad_openx.htm”); ?>


