Written by Steven Hansen
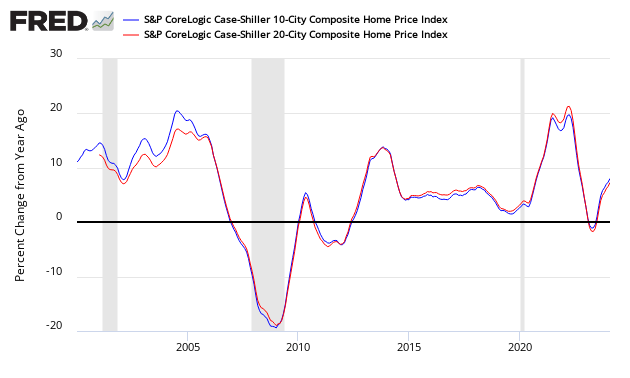
The non-seasonally adjusted Case-Shiller home price index (20 cities) year-over-year rate of home price growth decelerated from 6.7 % to 6.5 %. The index authors stated “ All these indicators suggest that the combination of rising home prices and rising mortgage rates are beginning to affect the housing market.”
Analyst Opinion of Case-Shiller HPI
Many pundits believe home prices are back in a bubble. Maybe, but the falling inventory of homes for sale keeps home prices relatively high. I continue to see this a situation of supply and demand. It is the affordability of the homes which is becoming an issue for the lower segments of consumers.
- 20 city unadjusted home price rate of growth decelerated 0.1 % month-over-month. [Econintersect uses the change in year-over-year growth from month-to-month to calculate the change in rate of growth]
- Note that Case-Shiller index is an average of the last three months of data.
- The market expected from Nasdaq / Econoday:
| Consensus Range | Consensus | Actual | |
| 20-city, SA – M/M | 0.2 % to 0.6 % | 0.4 % | +0.2 % |
| 20-city, NSA – M/M | 0.7 % to 0.9 % | 0.8 % | +0.7 % |
| 20-city, NSA – Yr/Yr | 6.4 % to 6.9 % | 6.6 % | +6.5 % |
S&P/Case-Shiller Home Price Indices Year-over-Year Change

Comparing all the home price indices, it needs to be understood each of the indices uses a unique methodology in compiling their index – and no index is perfect.
The way to understand the dynamics of home prices is to watch the direction of the rate of change. Here home price growth generally appears to be stabilize (rate of growth not rising or falling).
There are some differences between the indices on the rate of “recovery” of home prices.
A synopsis of Authors of the Leading Indices:
Case Shiller’s David M. Blitzer, Chairman of the Index Committee at S&P Indices:
Home prices continue to rack up gains two to three times greater than the inflation rat. The yearover-year increases in the S&P CoreLogic Case-Shiller National Index have topped 5% every month since August 2016. Unlike the boom-bust period surrounding the financial crisis, price gains are consistent across the 20 cities tracked in the release; currently, the range of the largest to smallest price change is 10 percentage points compared to a 20 percentage point range since 2001, and a 25 percentage point range between 2006 and 2009. Not only are prices rising consistently, they are doing so across the country.
Continuing price increases appear to be affecting other housing statistics. Sales of existing single family homes – the market covered by the S&P CoreLogic Case-Shiller Indices – peaked last November and have declined for three months in a row. The number of pending home sales is drifting lower as is the number of existing homes for sale. Sales of new homes are also down and housing starts are flattening. Affordability – a measure based on income, mortgage rates and home prices – has gotten consistently worse over the last 18 months. All these indicators suggest that the combination of rising home prices and rising mortgage rates are beginning to affect the housing market.
CoreLogic believes low inventories are spurring rising home prices (May 2018 Data). Per Dr Frank Nothaft, chief economist for CoreLogic and Frank Martell, president and CEO of CoreLogic stated:
The lean supply of homes for sale is leading to higher sales prices and fewer days on market, and the supply shortage is more acute for entry-level homes. During the first quarter, we found that about 50 percent of all existing homeowners had a mortgage rate of 3.75 percent or less. May’s mortgage rates averaged a seven-year high of 4.6 percent, with an increasing number of homeowners keeping the low-rate loans they currently have, rather than sell and buy another home that would carry a higher interest rate.
The CoreLogic consumer research demonstrates that, despite high home prices, renters want to get out of their rental property and purchase a home. Even in the most expensive markets, we found four times as many renters looking to buy than home-owners willing to sell. Until more supply becomes available, we will continue to see soaring pprices in cities such as Denver, San Francisco and Seattle.
The National Association of Realtors says home sales prices continue to increase (May 2018 data):
Lawrence Yun, NAR chief economist, says closings inched backwards in June and fell on an annual basis for the fourth straight month. There continues to be a mismatch since the spring between the growing level of homebuyer demand in most of the country in relation to the actual pace of home sales, which are declining,” he said. “The root cause is without a doubt the severe housing shortage that is not releasing its grip on the nation’s housing market. What is for sale in most areas is going under contract very fast and in many cases, has multiple offers. This dynamic is keeping home price growth elevated, pricing out would-be buyers and ultimately slowing sales.
“It’s important to note that despite the modest year-over-year rise in inventory, the current level is far from what’s needed to satisfy demand levels,” added Yun. “Furthermore, it remains to be seen if this modest increase will stick, given the fact that the robust economy is bringing more interested buyers into the market, and new home construction is failing to keep up.”
“Realtors® throughout the country continue to stress that there’s considerable pent-up demand for buying a home among the millennial households in their market,” said Yun. “Unfortunately, they’re just not making meaningful ground, and continue to be held back by too few choices in their price range, and thereby missing out on homeownership and wealth gains.”
“The modest uptick in new listings last month is perhaps good news for would-be buyers who are still in the market after a highly competitive spring buying season,” said NAR President Elizabeth Mendenhall, a sixth-generation Realtor® from Columbia, Missouri and CEO of RE/MAX Boone Realty. “As summer winds down, the number of home shoppers begins to decrease. Listings are still scarce – especially for entry-level homes – but patience may yield a positive result for those looking to buy in the months ahead.”
The U.S. Federal Housing Finance Agency produces an All-Transactions House Price Index for the United States:

Econintersect publishes knowledgeable views of the housing market.
Caveats on the Use of Home Price Indices
The housing price decline seen since 2005 varies by zip code – and seems to have ended somewhere around the beginning of the 2Q2012. Every area of the country has differing characteristics. Since January 2006, the housing declines in Charlotte and Denver are well less than 10%, while Las Vegas home prices had declined almost 60%.
Each home price index uses a different methodology – and this creates slightly different answers.
The most broadly based index is the US Federal Housing Finance Agency’s House Price Index (HPI) – a quarterly broad measure of the movement of single-family house prices. This index is a weighted, repeat-sales index on the same properties in 363 metro centers, compared to the 20 cities Case-Shiller.
The US Federal Housing Finance Agency also has an index (HPIPONM226S) based on 6,000,000 same home sales – a much broader index than Case-Shiller. Also, there is a big difference between home prices and owner’s equity (OEHRENWBSHNO) which has been included on the graph below.
Comparing Various Home Price Indices to Owner’s Equity (blue line)


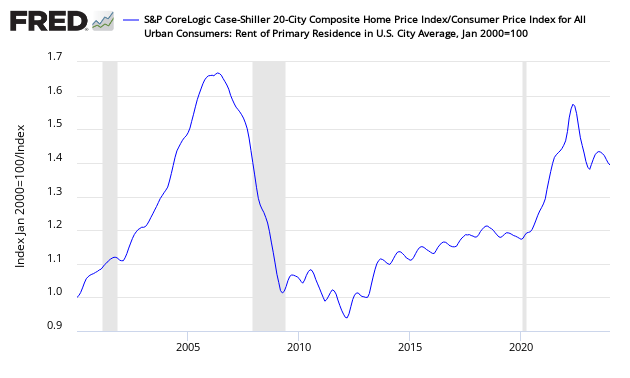
The affordability factor favors rental vs owning.
Price to Rent Ratio – Indexed on January 2000 – Based on Case-Shiller 20 cities index ratio to CPI Rent Index

include(“/home/aleta/public_html/files/ad_openx.htm”); ?>


