Written by Steven Hansen
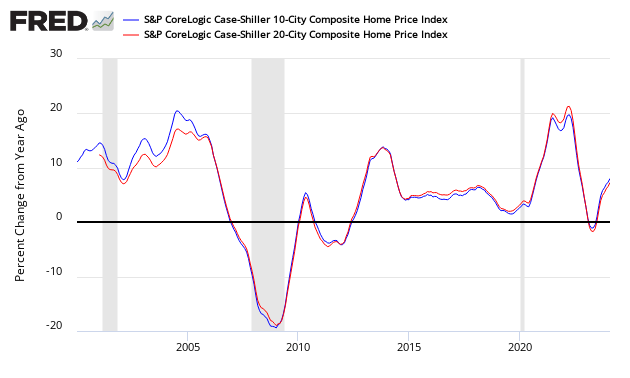
The non-seasonally adjusted Case-Shiller home price index (20 cities) year-over-year rate of home price growth improved 0.2 % from last months 5.1 %. The index authors stated “Further gains in personal income and employment may increase the demand for housing and add to price pressures when home prices are already rising about twice as fast as inflation”.
Analyst Opinion of Case-Shiller HPI
Many pundits believe home prices are back in a bubble. Maybe, but the falling inventory of homes for sale keeps home prices relatively high. I continue to see this a situation of supply and demand. It is the affordability of the homes which is becoming an issue for the lower segments of consumers.
- 20 city unadjusted home price rate of growth accelerated 0.2 % month-over-month. [Econintersect uses the change in year-over-year growth from month-to-month to calculate the change in rate of growth]
- Note that Case-Shiller index is an average of the last three months of data.
- The market expected:
| Consensus Range | Consensus | Actual | |
| 20-city, SA – M/M | 0.4 % to 0.7 % | 0.7 % | +0.9% |
| 20-city, NSA – M/M | +0.2 % | ||
| 20-city, NSA – Yr/Yr | 5.0 % to 5.4 % | 5.0 % | +5.3 % |
S&P/Case-Shiller Home Price Indices Year-over-Year Change

Comparing all the home price indices, it needs to be understood each of the indices uses a unique methodology in compiling their index – and no index is perfect.
The way to understand the dynamics of home prices is to watch the direction of the rate of change. Here home price growth generally appears to be stabilize (rate of growth not rising or falling).
There are some differences between the indices on the rate of “recovery” of home prices.
A synopsis of Authors of the Leading Indices:
Case Shiller’s David M. Blitzer, Chairman of the Index Committee at S&P Indices:
“With the S&P CoreLogic Case-Shiller National Home Price Index rising at about 5.5% annual rate over the last two-and-a-half years and having reached a new all-time high recently, one can argue that housing has recovered from the boom-bust cycle that began a dozen years ago. The recovery has been supported by a few economic factors: low interest rates, falling unemployment, and consistent gains in per-capita disposable personal income. Thirty-year fixed rate mortgages dropped under 4.5% in 2011 and have only recently shown hints of rising above that level. The unemployment rate at 4.7% is close to the Fed’s full employment target. Inflation adjusted per capita personal disposable income has risen at about a 2.5% annual rate for 30 months.
The home prices and economic data are from late 2016. The new Administration in Washington is seeking faster economic growth, increased investment in infrastructure, and changes in tax policy which could affect housing and home prices. Mortgage rates have increased since the election and stronger economic growth could push them higher. Further gains in personal income and employment may increase the demand for housing and add to price pressures when home prices are already rising about twice as fast as inflation.
CoreLogic believes low inventories are spurring rising home prices (November 2016 Data). Per Dr Frank Nothaft, chief economist for CoreLogic and Anand Nallathambi, president and CEO of CoreLogic stated:
Last summer’s very low mortgage rates sparked demand, and with for-sale inventories low, the result has been a pickup in home-price growth. With mortgage rates higher today and expected to rise even further in 2017, our national Home Price Index is expected to slow to 4.7 percent year over year by November 2017.
Home prices continue to march higher, with home prices in 27 states above their pre-crisis peak levels. Nationally, the CoreLogic Home Price Index remains 4 percent below its April 2006 peak, but should surpass that peak by the end of 2017.
The National Association of Realtors says home sales prices continue to increase (November 2016 data):
Lawrence Yun, NAR chief economist, says the housing market’s best year since the Great Recession ended on a healthy but somewhat softer note. “Solid job creation throughout 2016 and exceptionally low mortgage rates translated into a good year for the housing market,” he said. “However, higher mortgage rates and home prices combined with record low inventory levels stunted sales in much of the country in December.”
Added Yun, “While a lack of listings and fast rising home prices was a headwind all year, the surge in rates since early November ultimately caught some prospective buyers off guard and dimmed their appetite or ability to buy a home as 2016 came to an end.”
“Housing affordability for both buying and renting remains a pressing concern because of another year of insufficient home construction,” said Yun. “Given current population and economic growth trends, housing starts should be in the range of 1.5 million to 1.6 million completions and not stuck at recessionary levels. More needs to be done to address the regulatory and cost burdens preventing builders from ramping up production.”
“Constrained inventory in many areas and climbing rents, home prices and mortgage rates means it’s not getting any easier to be a first-time buyer,” said Yun. “It’ll take more entry-level supply, continued job gains and even stronger wage growth for first-timers to make up a greater share of the market.”
On the topic of first-time- and moderate-income buyers, NAR President William E. Brown says Realtors® look forward to working with the Federal Housing Administration to express why it is necessary to follow through with the previously announced decision to reduce the cost of mortgage insurance. By cutting annual premiums from 0.85 percent to 0.60 percent, an FHA-insured mortgage becomes a more viable and affordable option for these buyers.
“Without the premium reduction, we estimate that roughly 750,000 to 850,000 homebuyers will face higher costs and between 30,000 and 40,000 would-be buyers will be prevented from entering the market,” he said.
Black Knight Financial Services (formerly known as Lender Processing Services) October 2016 home price index Up 0.2 Percent for the Month; Up 5.7 Percent Year-Over-Year. Note that Black Knight uses the current month closings only (not a three month average like Case-Shiller or a weighted average like CoreLogic), excludes short sales and REOs, and is not seasonally adjusted.

Econintersect publishes knowledgeable views of the housing market.
Caveats on the Use of Home Price Indices
The housing price decline seen since 2005 varies by zip code – and seems to have ended somewhere around the beginning of the 2Q2012. Every area of the country has differing characteristics. Since January 2006, the housing declines in Charlotte and Denver are well less than 10%, while Las Vegas home prices had declined almost 60%.
Each home price index uses a different methodology – and this creates slightly different answers.
The most broadly based index is the US Federal Housing Finance Agency’s House Price Index (HPI) – a quarterly broad measure of the movement of single-family house prices. This index is a weighted, repeat-sales index on the same properties in 363 metro centers, compared to the 20 cities Case-Shiller.
The US Federal Housing Finance Agency also has an index (HPIPONM226S) based on 6,000,000 same home sales – a much broader index than Case-Shiller. Also, there is a big difference between home prices and owner’s equity (OEHRENWBSHNO) which has been included on the graph below.
Comparing Various Home Price Indices to Owner’s Equity (blue line)


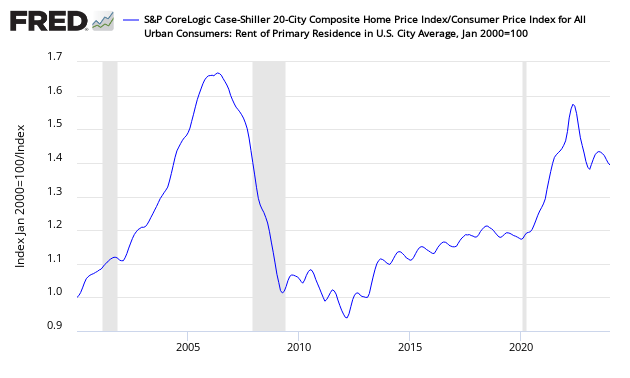
With rents increasing and home prices declining – the affordability factor favoring rental vs owning is reversing. Rising rents are shifting the balance.
Price to Rent Ratio – Indexed on January 2000 – Based on Case-Shiller 20 cities index ratio to CPI Rent Index

include(“/home/aleta/public_html/files/ad_openx.htm”); ?>


