Written by Steven Hansen
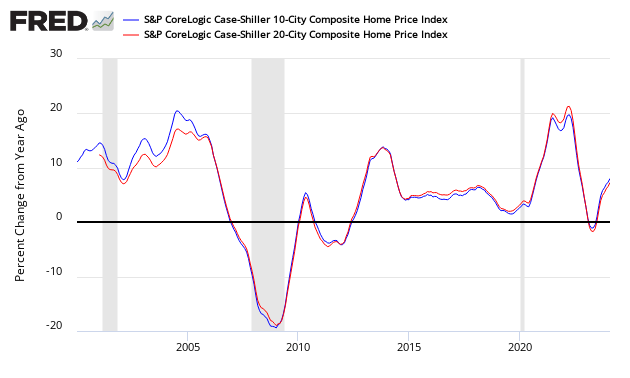
The non-seasonally adjusted Case-Shiller home price index (20 cities) for February 2015 (released today) year-over-year rate of home price growth improved from 4.5% (reported as 4.5% last month) to 5.0%. The authors of the index say: “home prices continue to rise and outpace both inflation and wage gains“.
- 20 city unadjusted home price rate of growth accelerated 0.5% month-over-month. [Econintersect uses the change in year-over-year growth from month-to-month to calculate the change in rate of growth]
- CoreLogic currently shows the highest year-over-year growth of 5.6%.
- The market expected:
| Consensus Range | Consensus | Actual | |
| 20-city, SA – M/M | 0.6 % to 1.0 % | 0.7 % | +0.9% |
| 20-city, NSA – M/M | 0.1 % to 0.2 % | 0.2 % | +0.5% |
| 20-city, NSA – Yr/Yr | 4.5 % to 5.0 % | 4.8 % | +5.0% |
S&P/Case-Shiller Home Price Indices Year-over-Year Change

Comparing all the home price indices, it needs to be understood each of the indices uses a unique methodology in compiling their index – and no index is perfect. The National Association of Realtors normally shows exaggerated movements which likely is due to inclusion of more higher value homes.
Comparison of Home Price Indices – Case-Shiller 3 Month Average (blue line, left axis), CoreLogic (green line, left axis) and National Association of Realtors 3 Month Average (red line, right axis)
z existing3.PNG
The way to understand the dynamics of home prices is to watch the direction of the rate of change. Here home price growth generally appears to be stabilizing (rate of growth not rising or falling).
Year-over-Year Price Change Home Price Indices – Case-Shiller 3 Month Average (blue bar), CoreLogic (yellow bar) and National Association of Realtors 3 Month Average (red bar)
z existing5.PNG
There are some differences between the indices on the rate of “recovery” of home prices.
A synopsis of Authors of the Leading Indices:
Case Shiller’s David M. Blitzer, Chairman of the Index Committee at S&P Indices:
Home Prices continue to rise and outpace both inflation and wage gains. The S&P/Case-Shiller National Index has seen 34 consecutive months with positive year-over-year gains; all 20 cities have shown year-over-year gains every month since the end of 2012. While prices are certainly rebounding, only two cities – Denver and Dallas – have surpassed their housing boom peaks. Nationally, prices are almost 10% below the high set in July 2006. Las Vegas fell 61.7% peak to trough and has the farthest to go to set a new high; it is 41.5% below its high. If a complete recovery means new highs all around, we’re not there yet.
A better sense of where home prices are can be seen by starting in January 2000, before the housing boom accelerated, and looking at real or inflation adjusted numbers. Based on the S&P/Case-Shiller National Home Price Index, prices rose 66.8% before adjusting for inflation from January 2000 to February 2015; adjusted for inflation, this is 27.9% or a 1.7% annual rate. The highest price gain over the last 15 years was in Los Angeles with a 4.3% real annual rate; the lowest was Detroit with a -3.6% real annual rate. While nationally, prices are recovering, new construction of single family homes remains very weak despite low vacancy rates among both renters and owner-occupied homes.
CoreLogic believes home price growth will be 5% over the next 12 months (February Data). Per Dr. Frank Nothaft, chief economist at CoreLogic and Anand Nallathambi, president and CEO of CoreLogic:
Since the second half of 2014, the dwindling supply of affordable inventory has led to stabilization in home price growth with a particular uptick in low-end home price growth over the last few months. From February 2014 to February 2015, low-end home prices increased by 9.3 percent compared to 4.8 percent for high-end home prices, a gap that is three times the average historical difference.
In terms of home price appreciation, this has been the hottest spring in nine years. Home prices have now increased for 39 straight months as improved housing market and macro-economic fundamentals and tight supplies combine to support the positive trend. Assuming a continued benign interest rate environment, we expect home prices to rise by an additional five percent over the next twelve months.
The National Association of Realtors says home sales growth for Spring is much improved (March 2015 data):
Lawrence Yun, NAR chief economist, says the housing market appears to be off to an encouraging start this spring. “After a quiet start to the year, sales activity picked up greatly throughout the country in March. The combination of low interest rates and the ongoing stability in the job market is improving buyer confidence and finally releasing some of the sizable pent-up demand that accumulated in recent years. The modest rise in housing supply at the end of the month despite the strong growth in sales is a welcoming sign. For sales to build upon their current pace, homeowners will increasingly need to be confident in their ability to sell their home while having enough time and choices to upgrade or downsize. More listings and new home construction are still needed to tame price growth and provide more opportunity for first-time buyers to enter the market.
NAR President Chris Polychron says there needs to be additional choices for borrowers looking for safe and secure mortgage products to finance their home purchase. Realtors® urge the U.S. Senate to schedule a vote for the bipartisan Mortgage Choice Act, which passed the U.S. House of Representatives last week. This legislation levels the playing field for brokerages with affiliated business agreements by eliminating the 3 percent cap on the calculations of fees and points in the Dodd-Frank Ability-to-Repay/Qualified Mortgage rule.
Black Knight Financial Services (formerly known as Lender Processing Services) February 2015 home price index up 0.7% for the Month; Up 4.6% Year-over-Year (unchanged from the previous month).

Econintersect publishes knowledgeable views of the housing market.
Caveats on the Use of Home Price Indices
The housing price decline seen since 2005 varies by zip code – and seems to have ended somewhere around the beginning of the 2Q2012. Every area of the country has differing characteristics. Since January 2006, the housing declines in Charlotte and Denver are well less than 10%, while Las Vegas home prices had declined almost 60%.
Each home price index uses a different methodology – and this creates slightly different answers. There is some evidence in various home price indices that home prices are beginning to stabilize – the evidence is also in this post. Please see the post Economic Headwinds from Real Estate Moderate.
The most broadly based index is the US Federal Housing Finance Agency’s House Price Index (HPI) – a quarterly broad measure of the movement of single-family house prices. This index is a weighted, repeat-sales index on the same properties in 363 metro centers, compared to the 20 cities Case-Shiller.
The US Federal Housing Finance Agency also has an index (HPIPONM226S) based on 6,000,000 same home sales – a much broader index than Case-Shiller. Also, there is a big difference between home prices and owner’s equity (OEHRENWBSHNO) which has been included on the graph below.
Comparing Various Home Price Indices to Owner’s Equity (blue line)


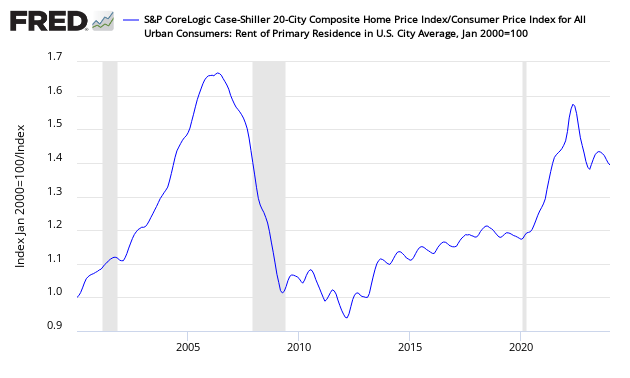
With rents increasing and home prices declining – the affordability factor favoring rental vs owning is reversing. Rising rents are shifting the balance.
Price to Rent Ratio – Indexed on January 2000 – Based on Case-Shiller 20 cities index ratio to CPI Rent Index

Related Articles
Old Analysis Blog | New Analysis Blog |
| Housing Sales and Prices | Housing Sales and Prices |
include(“/home/aleta/public_html/files/ad_openx.htm”); ?>


