
by Lance Roberts, Clarity Financial
Since I was traveling on vacation last week, and did not write a weekly report, I want to use this opportunity to update the previous analysis and model positioning for the current environment. This is particularly important as we enter into what has historically been two of the most dangerous months of the year.

First, why do I say that? The chart below shows the historical return patterns by month for the S&P 500.
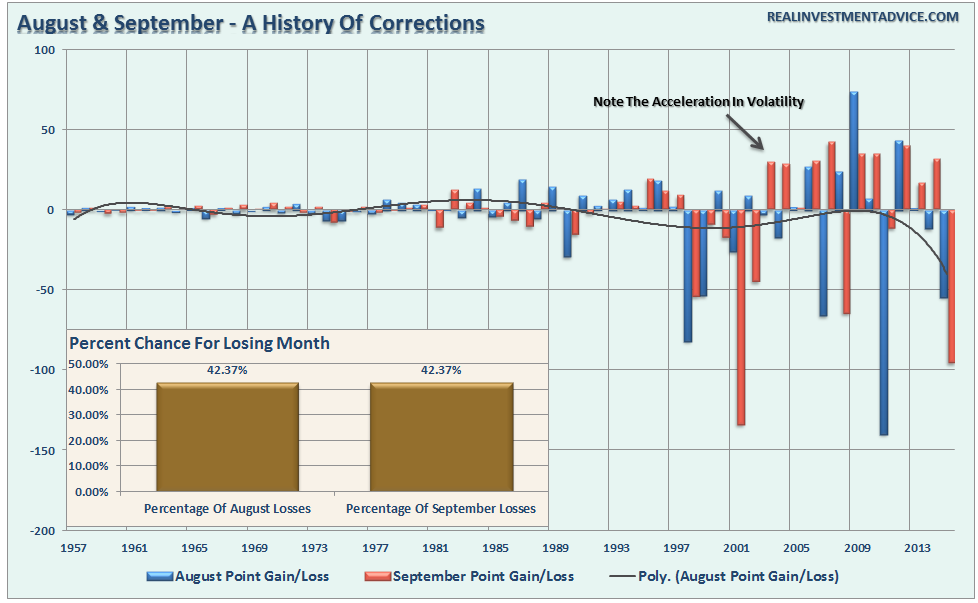
The months of August and September have a higher rate of corrections that other months with both standing at 42.37%. Furthermore, the rise of computerized trading, as shown in the chart above, has led to a substantial increase in volatility of point gain/loss during these two months. However, notice the polynomial trend line has trended more negatively in recent years reinforcing my concerns heading into the next two months.
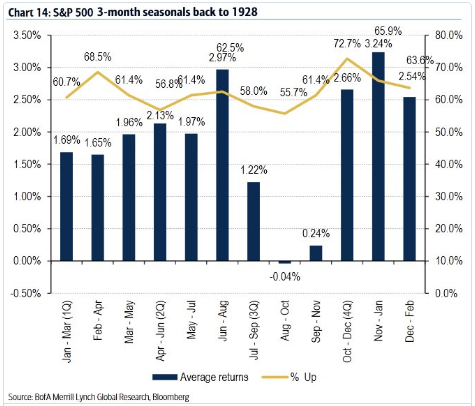
Then there is this tidbit:
We’re about to step into seasonality ditch: lowest 3-month returns Aug-Oct for S&P going back to 1928
source: BoA ML pic.twitter.com/Q5S5JSQdvr
– Babak (@TN) July 29, 2016
It is not just historical statistics that suggest caution, but primarily it is the current extension of the market itself. As I discussed two weeks ago:
“This week, I am adjusting the model allocations up to 75%. Review last week’s missive for the individual sector analysis for recommendations leading up to the model change.”
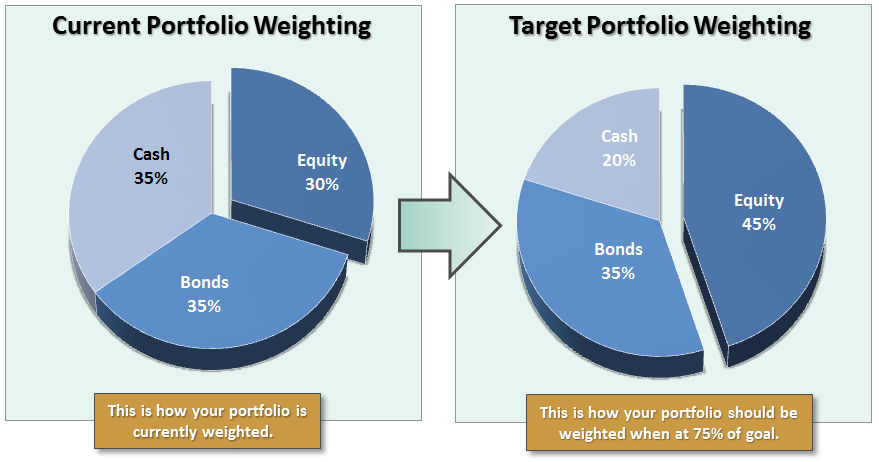
“However, while I am changing the model, this does not mean going out and clicking the “buy” button on everything you can find. We must now wait for the right entry point to increase equity allocations to the new model weights.
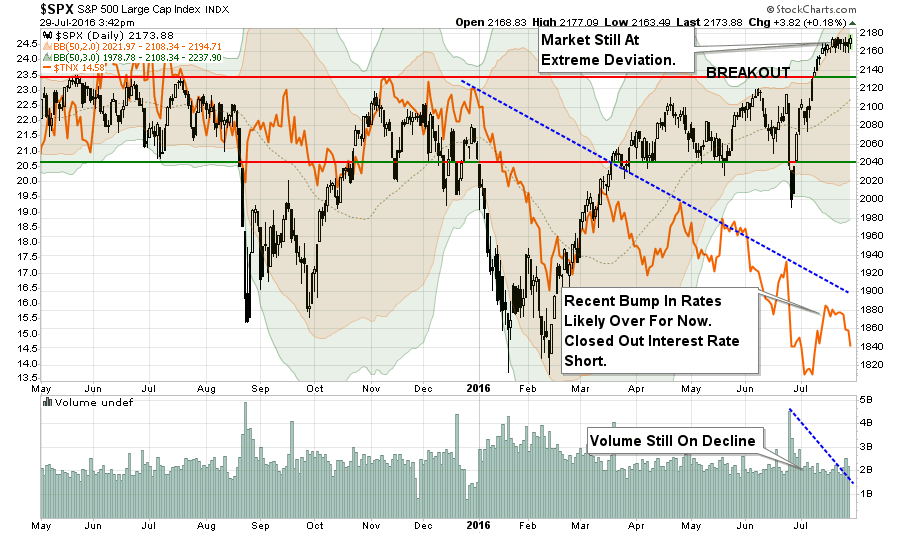
As shown below, the market is currently 3-standard deviations above its 50-day moving average. This is “rarefied air” in terms of price extensions and a pullback is now necessary to provide a better entry point for increasing equity allocations.”
Chart Updated Through Friday
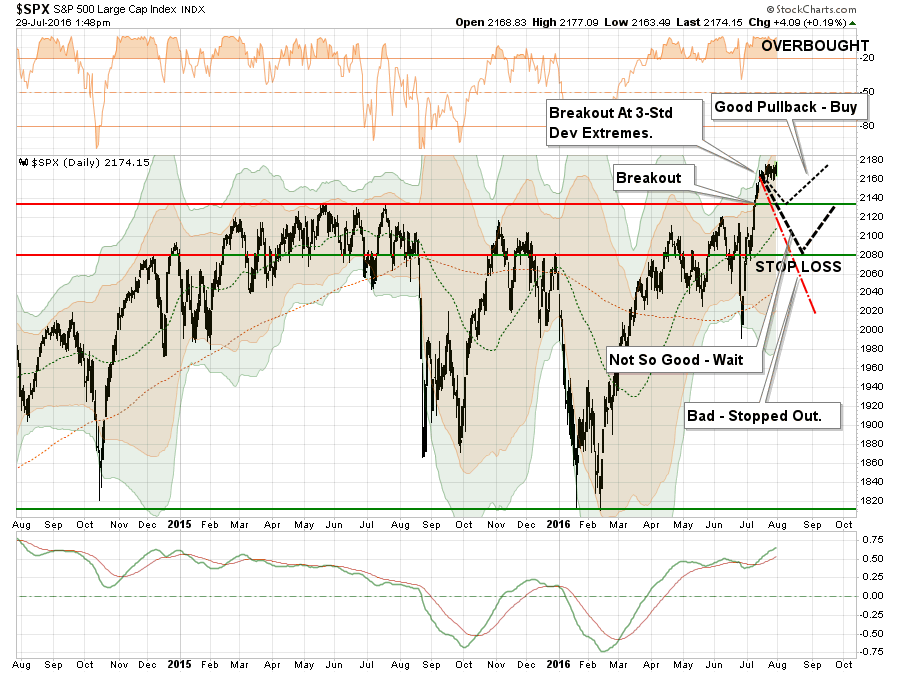
The consolidation over the past week DID pull the deviation back from 3-standard deviations above the 50-dma to just 2-standard deviations. This didn’t solve much of the problem as of yet.
Importantly, there are TWO ways to solve an overbought and overextended market advance. The first is for the market to continue this very tight trading range long enough for the moving average to catch up with the price.
The second is a corrective pullback, which is notated in the chart above. However, not all pullbacks are created equal.
A pullback to 2135, the previous all-time high, that holds that level will allow for an increase in equity allocations to the new targets.
A pullback that breaks 2135 will keep equity allocation increases on “HOLD” until support has been tested.
A pullback that breaks 2080 will trigger “stop losses” in portfolios and confirm the recent breakout was a short-term “head fake.”
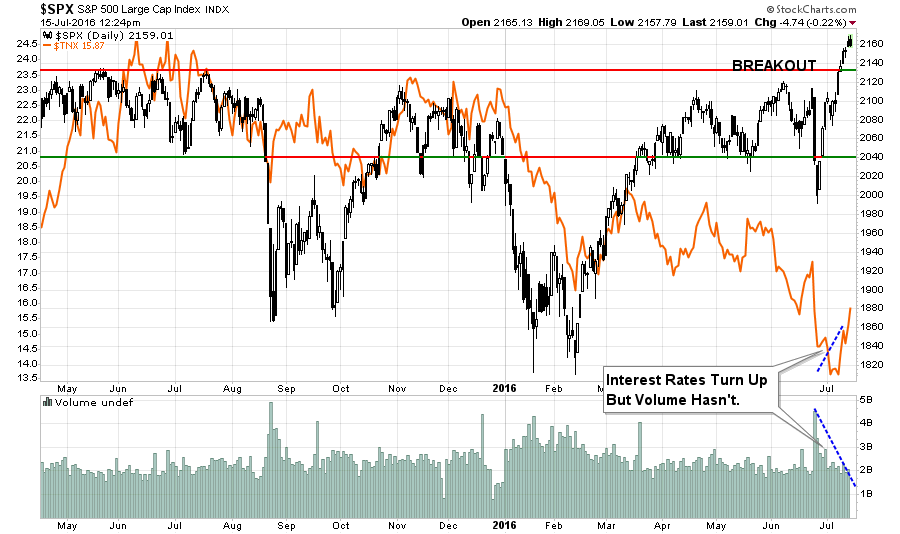
The next chart shows the 9.3% advance from the “Brexit” low. The momentum “buy” signal was triggered fairly early in the advance along with an upturn in volume. However, both of those indicators are now beginning to turn lower which would also suggest that a corrective action is likely in store in the days or weeks ahead.
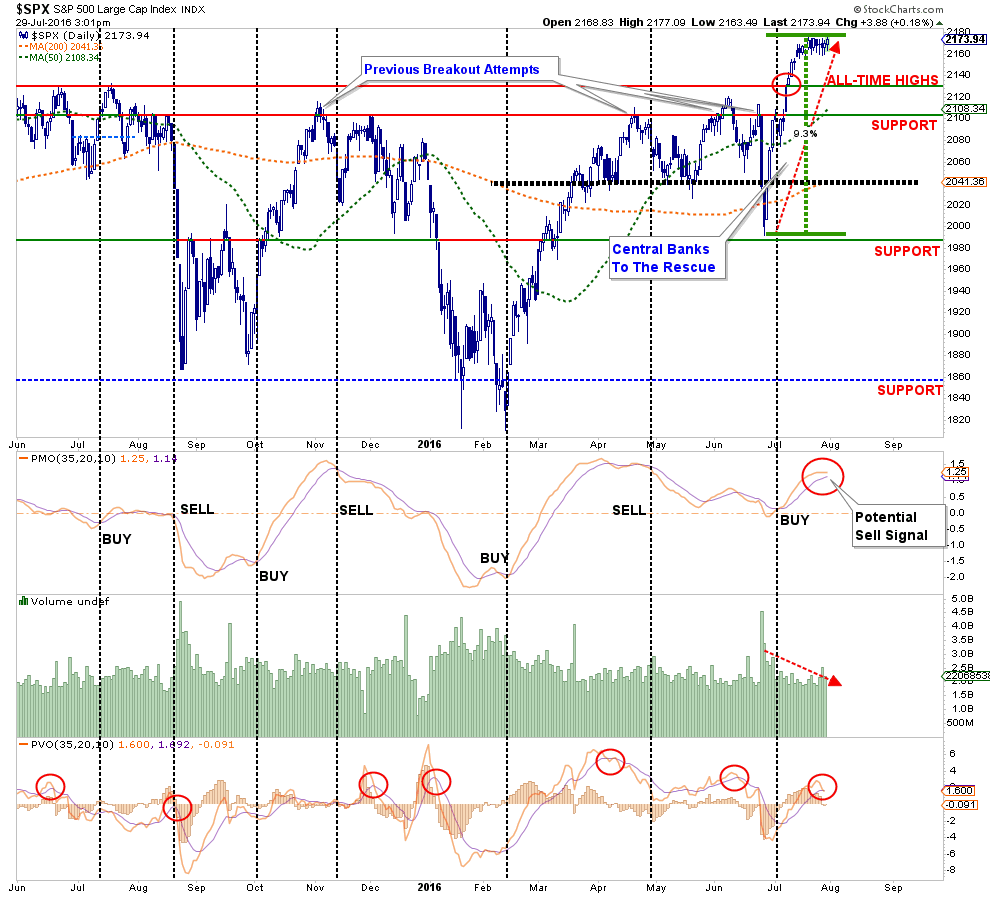
Note that while the technical model has suggested an increase in equity exposure currently, that increase is DEPENDENT on whether the recent breakout is confirmed by a corrective action that does not violate OR reverse the current trend. There is a decent probability that such could occur, so we wait for the market to dictate our next portfolio moves.
Furthermore, my friend Dana Lyons recently made some excellent comments on the extremely tight trading range as of late. To wit:
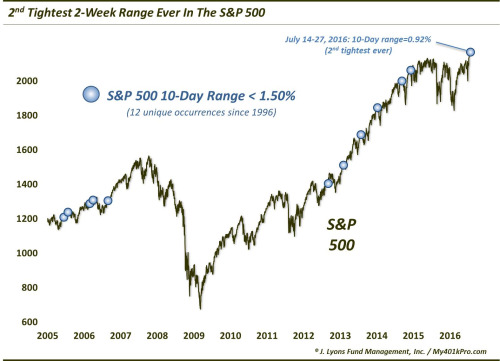
“It is particularly noteworthy considering the fact that, after today’s trading, the S&P 500 is exhibiting its 2nd tightest 10-day trading range ever.
Specifically, we looked at the prior occasions since 1997 that saw the S&P 500 trade in a range of less than 1.50% over a 2-week period. As it happens, there have been 11 such prior tight ranges since 1997, all occurring since 2005.”
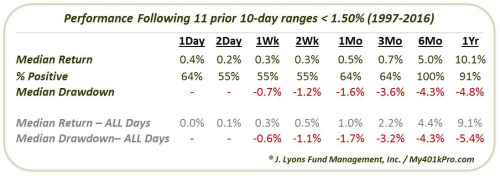
“If you look carefully at the last 4 occurrences (prior to this one), it appears that each of them ran into some trouble almost immediately. Indeed, following tight ranges on 7/31/2013, 1/10/2014, 9/11/2014 and 12/8/2014, the S&P 500 experienced 1-month drawdowns of -3.3%, -5.5%, -4.6% and -4.3% respectively. Therefore, if there is something to the notion that more recent precedents are the most relevant to present circumstances, this tight range may be a bit of a red flag in the near-term.
(Btw, if you’re wondering – like we usually do – about the performance following these tight ranges when the S&P 500 is trading close to a 52-week high, don’t bother. As it turns out, these ranges occur almost exclusively near highs. For example, since January 1995, all 42 days showing a 10-day range of < 1.50% occurred within 3% of a 52-week high.)”
As I warned last time:
“There is also a possibility this central bank driven liquidity push is a giant ‘trap’ waiting to be sprung on unwitting investors.
The current rally is built on a substantially weaker fundamental and economic backdrop. Therefore, it is extremely important to remember that whatever increase in equity risk you take, could very well be reversed in short order due to the following reasons:
We are moving into the latter stages of a cyclical bull market.
Economic data continues to remain weak
Earnings are only positive by not sucking as bad as estimates
Volume is weak
Longer-term technical underpinnings remain bearish.
It is the summer of a Presidential election year which tends to be weak.
Share buybacks are slowing
The yield curve is flattening
It is worth remembering that markets have a very nasty habit of sucking individuals into them when prices become detached from fundamentals. Such is the case currently and has generally not had a positive outcome.
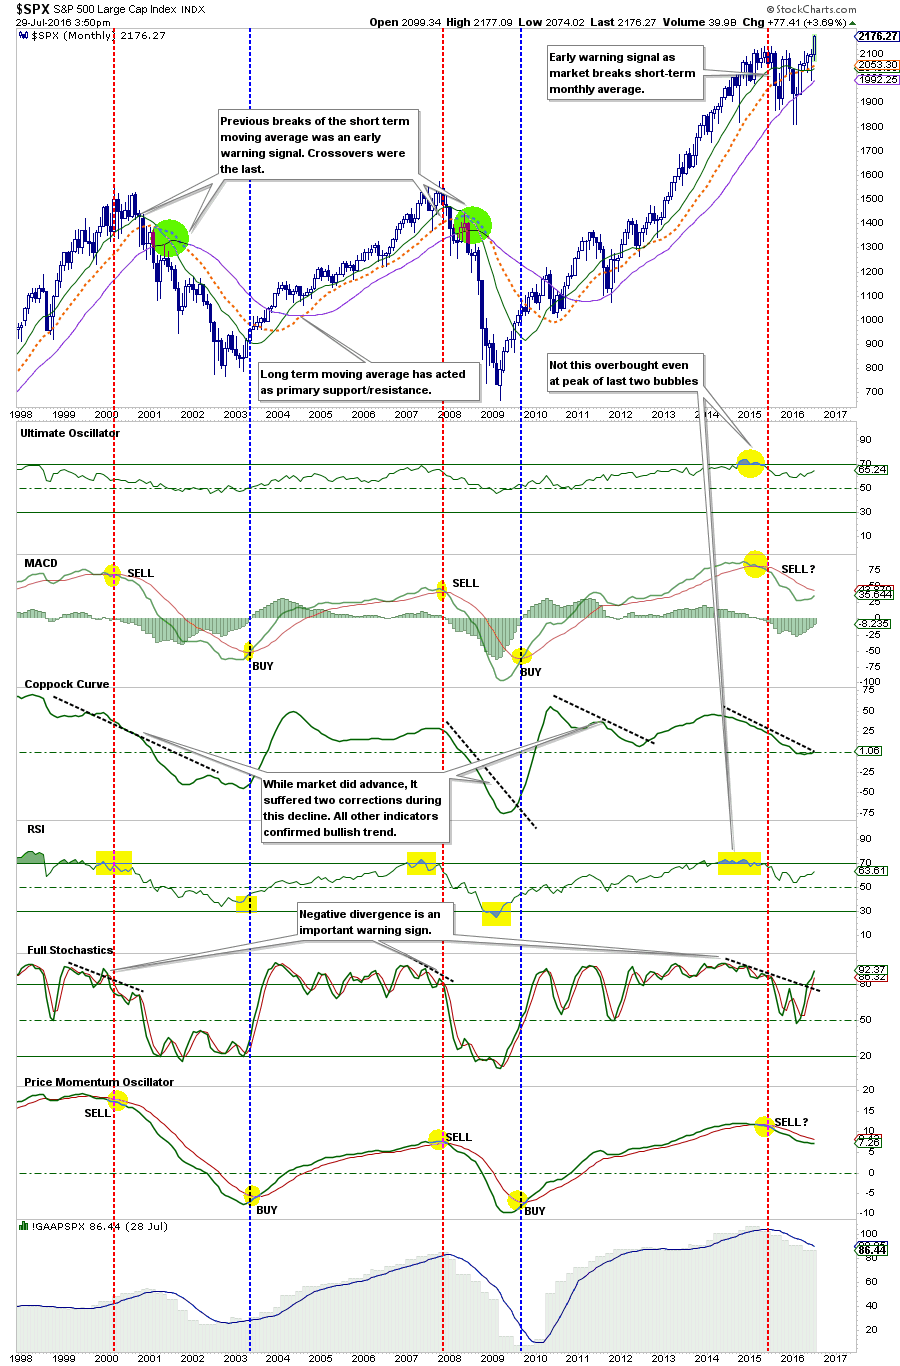
The chart below illustrates point #5 above. There are still WAY too many negative divergences in underlying indicators to suggest an ‘all clear’ for investors currently.”
Interest Rates
I discussed previously that interest rates had gotten so oversold (bonds overbought) due to the “Brexit” that a reversal was very possible. As I noted on previously, the rotation from bonds to stocks confirmed the push higher in the markets.
“Much of the sustainability of the rally going forward is dependent upon the ongoing rotations from ‘safety’ back into ‘risk.'”
This was the chart I posted at that time as I disclosed that I had taken a “short position” on interest rates using the exchange-traded fund (TBT).
Given the strength of the run-up in stocks which pushed into extreme overbought territory, I began discussing the potential for a short-term correction. Therefore, I closed out the short position on TBT this past Monday given that money would like reverse flows from “risk” back into “safety.”
If I am correct, and the markets do experience a short-term correction, or worse, interest rates will likely retest recent lows. One thing is for sure…
“Rates ain’t going significantly higher anytime soon.”
Oil & The Dollar
At the beginning of July I wrote:
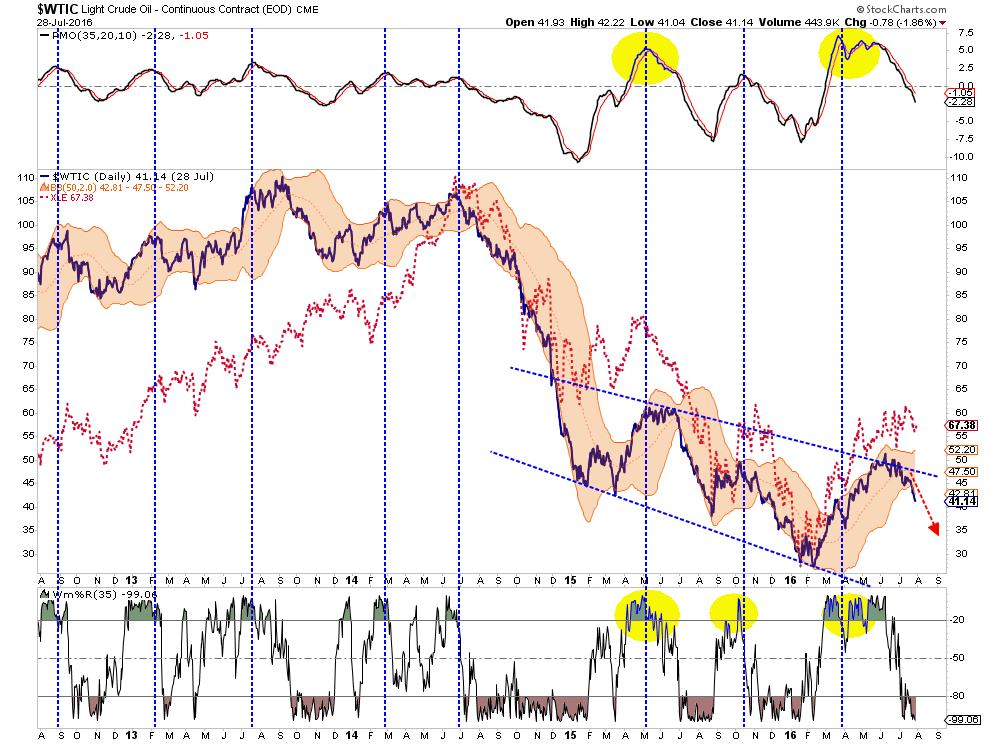
“There are two things about the energy sector. While the push from the lows has been fairly strong in recent months, the ongoing downtrend remains intact. If the market does turn lower in the August/September period as expected the potential to retest lows is fairly high.
As shown in the longer term oil chart below, there is little to suggest a recovery back to old levels is in the offing anytime soon. With oil prices back to extreme overbought conditions, a retracement to $35 or $40/bbl would not be surprising particularly if, and when, the US Dollar strengthens. Remain underweight this sector as valuations for energy stocks have entered into ‘moon shot’ territory.”
That call was quite prescient as shown.
Furthermore, the rise in the dollar is likely to continue which will continue to suppress both oil prices AND earnings. As noted:
“While earnings are set to decline again this quarter which will push valuations even further into the proverbial stratosphere, the real risk to watch is the US Dollar. While Central Banks have gone all in, including the BOJ with additional QE measures of $100 billion, to bail out financial markets and banks following the “Brexit” referendum, it could backfire badly if the US dollar rises from foreign inflows. As shown below, a stronger dollar will provide another headwind to already weak earnings and oil prices in the months ahead which could put a damper on the expected year-end “hockey stick” recovery currently expected. “
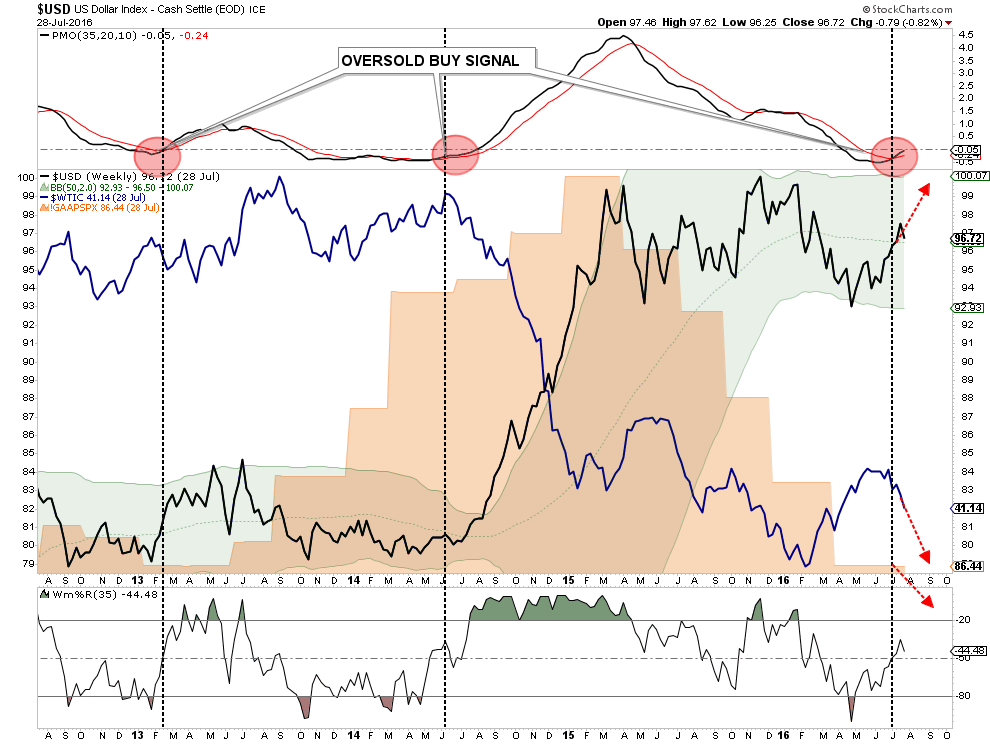
Unlike the stock market which is pushing extreme overbought levels, the dollar is at an extreme oversold condition and has only started a potential move higher. This is something to pay very close attention to in the months ahead.
As noted, with interest rates negative in many areas of the world, the push of capital into the U.S. for a higher return on reserves is very likely.
Quick Reminder On Taking Action
While Monday is NOT the day to go rushing headfirst into the markets, there are things that we can and should be doing to prepare for “whatever happens next.”
Move slowly. There is no rush in adding equity exposure to your portfolio. Use pullbacks to previous support levels to make adjustments.
If you are heavily UNDER-weight equities, DO NOT try and fully adjust your portfolio to the model in one move. This could be disastrous if the market reverses sharply in the short term. Again, move slowly.
Begin by selling laggards and losers. These positions are dragging on performance as the market rises and tend to lead when markets fall. Like “weeds choking a garden,” pull them.
Add to sectors, or positions, that are performing with, or outperforming, the broader market. (See previous analysis for suggestions.)
Move “stop loss” levels up to current breakout levels for each position. Managing a portfolio without “stop loss” levels is like driving with your eyes closed.
While the technical trends are intact, risk considerably outweighs the reward. If you are not comfortable with potentially having to sell at a LOSS what you just bought, then wait for a larger correction to add exposure more safely. There is no harm in waiting for the “fat pitch” as the current market setup is not one.
If none of this makes any sense to you – please consider hiring someone to manage your portfolio for you. It will be worth the additional expense over the long term.
What you decide to do with this information is entirely up to you. As I stated, I do think there is enough of a bullish case being built to warrant taking some equity risk on a very short-term basis give the right set up. However, we MUST wait and see what happens next week.
However, the longer-term dynamics remain bearish. When those negative price dynamics are combined with the fundamental and economic backdrop, the “risk” of having excessive exposure to the markets greatly outweighs the potential “reward. “
Please be careful.
Investing is not a competition.
It is a game of long-term survival.


