
Written by rjs, MarketWatch 666
News posted last week about economic effects related to the coronavirus 2019-nCoV (aka SARS-CoV-2), which produces COVID-19 disease, has been surveyed and some articles are summarized here. We cover the latest economic data, especially the new coronavirus relief bill and stimulus checks, government funding, the latest employment data, housing market reports, mortgage delinquencies & forbearance, layoffs, lockdowns, and schools, as well as GDP. The bulk of the news is from the U.S., with a few more articles from overseas at the end. (Picture below is morning rush hour in downtown Chicago, 20 March 2020.) News items about epidemiology and other medical news for the virus are reported in a companion article.

Please share this article – Go to very top of page, right hand side, for social media buttons.
We have the usual scope of topics, but only two articles from Europe this week:
Central Bank Will Begin Reducing Bond Purchases ‘Well Before’ Raising Interest Rates, Powell Says – WSJ – Federal Reserve Chairman Jerome Powell said Wednesday that the central bank will begin to slow the pace of its bond purchases “well before” raising interest rates. The Fed has been buying at least $120 billion a month of Treasury debt and mortgage-backed securities since last June to hold down long-term borrowing costs. Since December, the central bank has said the economy must make “substantial further progress” toward its goals of maximum employment and 2% inflation before it scales back those purchases. “We will taper asset purchases when we’ve made substantial further progress toward our goals, from last December when we announced that guidance,” Mr. Powell said in a virtual event held by the Economic Club of Washington, D.C. “That would in all likelihood be before – well before – the time we consider raising interest rates.” The Fed has said it will hold rates near zero until it sees the labor market return to full employment and inflation rise to 2% and is forecast to moderately exceed that level for some time. Mr. Powell reiterated that he thinks it is highly unlikely that the Fed would raise interest rates this year and noted that most central-bank officials see rates remaining near zero through 2023. Mr. Powell’s comments came a day after the Labor Department reported the biggest one-month jump in the consumer-price index since 2012. While the Fed targets a different measure of inflation – the personal-consumption-expenditures price index – the CPI provides much of that index’s raw data. Tuesday’s report fueled concerns that inflation, dormant through the record-long economic expansion from 2009 to 2020, could soon become a challenge for policy makers. Mr. Powell acknowledged those worries while reiterating that the Fed seeks inflation “that is moderately above 2% for some time” to make up for the past decade’s shortfalls. “For quite some time, many people were saying, ‘Well, you’ll never get above 2%,’ because it [has] been very hard to get back to 2%,” Mr. Powell said. “Now more of the discussion is on the other side.” Both the Biden administration and the Fed acknowledge the possibility of prices rising faster than usual in coming months as the economic recovery strengthens and demand for goods and services temporarily outruns supply. But both expect the acceleration in inflation to prove temporary. “In most cases, this type of inflation is transitory: the price of lumber or energy rises, but then stabilizes at a higher level or decreases, with no further impact on future inflation,” the White House Council of Economic Advisers said in a blog post about inflation on Monday, a day before the Labor Department’s report. “This example underscores an important distinction between price levels and inflation, with the latter being the rate at which levels move up and down.” Mr. Powell in the past has emphasized that the type of inflation that preoccupies the Fed is a process rather than the outcome of an idiosyncratic event such as the economy rebounding after a pandemic.A Fed report released Wednesday included widespread accounts of firms raising selling prices, but usually not enough to keep up with climbing costs. The chief source of higher business costs was continuing supply-chain delays and disruptions, especially in getting shipments from overseas, according to the central bank’s periodic roundup of anecdotes from business sources, known as the Beige Book. The report concluded that U.S. economic activity “accelerated to a moderate pace” from February to early April, as rising rates of Covid-19 vaccinations, business reopenings and federal-stimulus funds boosted consumer spending across the country.
Dollar at 4-week low on retreating Treasury yields – The dollar fell to a four-week low against a basket of currencies on Friday, still smarting from a sharp drop in U.S. Treasury yields the previous session, and as investors increasingly bought into the Federal Reserve’s insistence it would keep an accommodative policy stance for a while longer. The benchmark 10-year U.S. Treasury yield dipped to a one-month low of 1.528% overnight, moving further away from March’s 1.776%, its highest in more than a year, even in the face of Thursday’s stronger-than-expected retail sales and employment data. On Friday, the 10-year recovered some ground to trade at 1.5675%. Trang cited some profit-taking after the greenback’s sharp appreciation in March as well as the recent retreat in Treasury yields as main reasons for the dollar’s weakness. Investors’ healthy appetite for riskier assets such as equities has also sapped some of the safe-haven demand the dollar typically enjoys, Trang said. The dollar index measuring the greenback against a basket of six currencies was 0.111% lower at 91.561, its lowest since March 18. For the week the index was down 0.7%, set for its second straight weekly decline. San Francisco Fed President Mary Daly said the U.S. economy was still far from making “substantial progress” toward the central bank’s goals of 2% inflation and full employment, the bar the Fed has set for beginning to consider reducing its support for the economy. That echoed Fed Chair Jerome Powell’s comments in several speeches over the past week that policymakers will look through near-term rises in prices amid ongoing slack in the labor market. On Friday, the U.S. Treasury Department said it will continue enhanced engagement with Vietnam and Switzerland, and initiate similar talks with Taiwan after concluding all three countries met the criteria under a 2015 U.S. currency manipulation law. The Canadian dollar strengthened 0.3% against its U.S. counterpart, turning higher for the week, as oil prices gained and the broader decline for the greenback offset domestic data showing a bigger-than-expected drop in wholesale trade. In cryptocurrencies, bitcoin stood around $61,648.71, below the record high of $64,895 reached on Wednesday, when cryptocurrency platform Coinbase this week made its debut in Nasdaq in a direct listing.
The WSJ April Survey: Accelerating Growth Prospects – Menzie Chinn -The survey results are out, and once again, the outlook improves. Figure 1: GDP actual (bold black), WSJ April survey mean (blue), February (red), December (green), October (light blue), CBO estimate of potential GDP (gray), all in billions Ch.2012$, on log scale. Forecasted levels calculated by cumulating growth rates to latest GDP level reported. Source: BEA (2020Q4 3rd release), WSJ surveys (various), CBO (February 2021), and author’s calculations. The implied output gap by 2022Q2 is 1.9%, compared to 1.3% from last month’s survey (discussed here). Despite the improvement in the central tendency of forecasts, there remains wide disagreement. Figure 2: GDP actual (bold black), WSJ April survey mean (blue), Cummins/Nat West Markets (red), Fienup, Hamilton/California Lutheran University (green), CBO estimate of potential GDP (gray), all in billions Ch.2012$, on log scale. Foreacasted levels calculated by cumulating growth rates to latest GDP level reported. Source: BEA (2020Q4 3rd release), WSJ surveys (various), CBO (February 2021), and author’s calculations. The low forecast implies that an output gap of -1.3% remains by 2022Q2 (the high is 5.1%). In other words, some economists view as plausible the existence of slack in mid-2022 (and it’s possible that even with the high estimates of growth, slack will exist given a high estimate of potential – see this post). Unsurprisingly, the inflation forecasts have been marked up as well. However, even with 12 month inflation in December 2021 being marked up to 2.58% from 2.48%, the price level will still be below 2016-19 trend. Figure 3: CPI-all (bold black), CPI implied by WSJ April survey (teal squares), and 2016-19 trend (red), all at end of quarter, on log scale. Source: BLS via FRED, WSJ April survey, and author’s calculations.
Q1 GDP Forecasts: Around 7%— Note that the forecasts of the automated systems (based on released data), have caught up with the forecasts of economists, as data for March is released.From Merrill Lynch: Despite robust retail sales growth, it was less bullish than our forecast, resulting in a 0.5pp reduction to our 1Q GDP tracking estimate, to 6.5% qoq saar. [Apr 16 estimate] From Goldman Sachs: We left our Q1 GDP tracking estimate unchanged on a rounded basis at +7.5% (qoq ar). [Apr 16 estimate]From the NY Fed Nowcasting Report: The New York Fed Staff Nowcast stands at 6.8% for 2021:Q1 and 4.4% for 2021:Q2. [Apr 16 estimate]And from the Altanta Fed: GDPNow: The GDPNow model estimate for real GDP growth (seasonally adjusted annual rate) in the first quarter of 2021 is 8.3 percent on April 16, unchanged from April 15 after rounding. After this morning’s housing starts report from the U.S. Census Bureau, the nowcast of first-quarter real residential investment growth decreased from 10.6 percent to 10.2 percent. [Apr 16 estimate]
Seven High Frequency Indicators for the Economy — These indicators are mostly for travel and entertainment. The TSA is providing daily travel numbers. This data shows the seven day average of daily total traveler throughput from the TSA for 2019 (Light Blue), 2020 (Blue) and 2021 (Red). This data is as of April 11th. The seven day average is down 38.7% from the same day in 2019 (61.3% of last year). The second graph shows the 7 day average of the year-over-year change in diners as tabulated by OpenTable for the US and several selected cities. This data is updated through April 9, 2021. Dining picked up during the holidays, then slumped with the huge winter surge in cases. Dining is picking up again – and is above 2019 in Texas and Florida. This data shows domestic box office for each week and the median for the years 2016 through 2019 (dashed light blue). Blue is 2020 and Red is 2021. The data is from BoxOfficeMojo through Apr 8th. Movie ticket sales were at $49 million last week, down about 71% from the median for the week. This graph shows the seasonal pattern for the hotel occupancy rate using the four week average. Occupancy has increased to 2009 levels – and 2009 was horrible for hotels. This data is through April 3rd. Hotel occupancy is currently down 16% compared to same week in 2019). Note: Occupancy was up year-over-year, since occupancy declined sharply at the onset of the pandemic. However, occupancy is still down significantly from normal levels. This graph, based on weekly data from the U.S. Energy Information Administration (EIA), shows gasoline supplied compared to the same week of 2019. Blue is for 2020. Red is for 2021. As of April 2nd, gasoline supplied was off about 10.5% (about 89.5% of the same week in 2019). This graph is from Apple mobility. From Apple: “This data is generated by counting the number of requests made to Apple Maps for directions in select countries/regions, sub-regions, and cities.” This is just a general guide – people that regularly commute probably don’t ask for directions. There is also some great data on mobility from the Dallas Fed Mobility and Engagement Index. However the index is set “relative to its weekday-specific average over January – February”, and is not seasonally adjusted, so we can’t tell if an increase in mobility is due to recovery or just the normal increase in the Spring and Summer. This data is through April 10th for the United States and several selected cities. The graph is the running 7 day average to remove the impact of weekends. According to the Apple data directions requests, public transit in the 7 day average for the US is at 67% of the January 2020 level. It is at 59% in Chicago, and 62% in Houston (the Houston dip was a weather related decline) – and moving up recently. Here is some interesting data on New York subway usage. This graph is from Todd W Schneider. This is weekly data since 2015. Most weeks are between 30 and 35 million entries, and currently there close to 10 million subway turnstile entries per week. This data is through Friday, April 9th.
CPI Surprise – Menzie Chinn – The CPI came in slightly above Bloomberg consensus (2.6% vs 2.5%), and above the WSJ April survey consensus (shown below). Figure 1: CPI All urban (blue), Bloomberg consensus as of 4/12 (pink inverted triangle), WSJ April survey mean implied by forecasted inflation rate (teal square), and 2016-19 trend line (red), all on log scale. Source: BLS via FRED, Bloomberg, WSJ April survey, and author’s calculations.In other words, the March release is above the path implied by the WSJ survey that had only been taken a week or so earlier. That being said, there is barely a blip in markets showing an increase in inflation expectations. Figure 2. Five year inflation breakeven calculated as five year Treasury yield minus five year TIPS yield (blue), five year breakeven adjusted by term premium and liquidity premium per DKW, all in %. Red dashed line at 4/13, CPI release date. Source: FRB via FRED, KWW following D’amico, Kim and Wei (DKW), and author’s calculations.Torsten Slok (Apollo Global Management) writes today:Inflation for March came in at 2.6%, and the most likely scenario is that inflation in the second half of this year will move below 2% again. That is also what the consensus expects.But there is a 25% probability that we will see a substantial overshoot where inflation will be above 2.2% for the rest of 2021.One particularly troubling aspect of the inflation outlook is the fact that a very high number of companies are saying that they are planning to raise prices of the products they are selling
Today’s inflation data show zero sign of sustained economic overheating – EPI Blog – Today, the Bureau of Labor Statistics (BLS) reported that the overall consumer price index (CPI) in March 2021 was 2.6% higher than in March 2020, while the “core” measure of the CPI (which excludes volatile food and energy prices) was 1.6% higher than a year ago. Given that these are noticeable (if modest) increases over recent months’ year-over-year inflation rates, some might be tempted to argue that this data should make policymakers worry about economic “overheating” stemming from “too much” fiscal support provided in recent recovery legislation. This is clearly wrong, for a number of reasons:
- The data released today do not show that prices have risen rapidly since recovery legislation passed – instead they just show that prices plummeted during the near-total shutdown of large swaths of the economy a year ago in response to the COVID-19 shock.
- Measured on an annualized basis from February 2020 – before the COVID-19 economic shock – inflation in March 2021 was running at just 1.5%.
- Measured since October – shortly before the $2.8 trillion in additional relief spending provided by legislation in December 2020 and the American Rescue Plan (ARP) in March – inflation is running at an annualized rate of 1.3%.
- Non-price measures continue to show enormous degrees of economic slack, so there is no conceivable way that the U.S. economy was overheating in March 2021.
- Employment remains 8.4 million jobs below what prevailed in February 2020. If we add in growth in the working-age population, the jobs gap remains over 10 million – larger than it was during the worst parts of the Great Recession of 2008-09.
- Nominal wage growth (adjusting for composition) remains very tame. True “overheating” has to come from the labor market and this isn’t happening.
- Nominal consumption spending in the U.S. economy is slightly lower than it was a year ago, before the COVID-19 shock.
- Even in coming years, and even if growth in economy-wide spending outstrips growth in the economy’s productive capacity for a long stretch of time, damaging inflation that would require policymakers’ response is highly unlikely to appear.
- Even several years of inflation above 2% would still not make up for years of too-slow price growth over the past 12 years, and making up for these years of too-slow price growth would go a long way to reestablishing the credibility of the Federal Reserve inflation target. This is an opportunity, not a threat.
- Counterbalancing recent expansionary fiscal actions like the ARP is the steady and significant drag on spending growth imposed by the enormous rise in inequality in recent decades. As inequality has redistributed income from households that spend most of their income to households that save much more, this puts a steady anchor keeping demand growth depressed. Until this structural headwind to growth is addressed, persistent overheating is highly unlikely to happen.
- Long-lasting upward spirals of wages and price inflation that may call for action from policymakers require relatively balanced bargaining positions of workers and employers to sustain. This does not describe today’s U.S. economy and so such spirals will not happen in coming years.
Today’s data are mostly about what happened in March 2020, not March 2021
Business Cycle Indicators as of Mid-April — Menzie Chinn – today, showing a rebound in March. In the context of key macro indicators followed by the NBER Business Cycle Dating Committee: Figure 1: Nonfarm payroll employment from March release (dark blue), Bloomberg consensus as of 4/1 for March nonfarm payroll employment (light blue +), industrial production (red), personal income excluding transfers in Ch.2012$ (green), manufacturing and trade sales in Ch.2012$ (black), consumption in Ch.2012$ (light blue), and monthly GDP in Ch.2012$ (pink), all log normalized to 2020M02=0. Source: BLS, Federal Reserve, BEA, via FRED, IHS Markit (nee Macroeconomic Advisers) (4/1/2021 release), NBER, and author’s calculations. Industrial production was whipsawed by weather in February, so it makes sense to look at manufacturing production as well. Seasonally adjusted industrial production rose 1.4% vs. 2.8% for manufacturing production (18.7% vs. 39.1% annualized). Industrial production is 3.4% below levels at NBER peak (2020M02), while manufacturing is 1.7% below. Incidentally, neither has re-attained the local maxima in January 2021. Atlanta Fed GDPNow (4/15) is for 8.3% in Q1; IHS Markit nowcast (4/15) is 6.0% (both figures SAAR).
Against mounting odds, Biden seeks GOP support for infrastructure plan – President Biden on Monday intensified his effort to win broad congressional support for his massive infrastructure plan, huddling with eight lawmakers from both chambers in search of that rarest of things in today’s hyperpolarized Washington: bipartisanship. The gathering marked the first time the president has met with a bipartisan group of lawmakers on infrastructure since he introduced his American Jobs Plan on March 31 in Pittsburgh. He previously hosted a small cadre of Republican and Democratic senators in the Oval Office in February. But the two parties remained far apart after the nearly two-hour meeting. Mississippi Sen. Roger Wicker, the top Republican on the Senate Commerce, Science and Transportation Committee, called it a “good discussion,” one in which Biden did most of the talking. But Wicker said pieces of Biden’s proposal would be “non-starters” for Republicans, particularly his idea to pay for the package through big corporate tax increases. Wicker said it “would be an almost impossible sell for the president to come to a bipartisan agreement that included the undoing” of the GOP’s 2017 tax cuts law. “I did tell him that,” Wicker told reporters after the meeting. “Whether we’ll be able to come to a bipartisan agreement that gets as expansive and as massive as he would like to, I don’t know.” “I certainly appreciated the words in the room, but obviously the follow-up actions are … most important,” Rep. Garret Graves (R-La.), a member of the House Transportation and Infrastructure Committee, told The Hill after the meeting. The comments highlight the barriers facing the new administration as Biden seeks to honor a central campaign vow – working across the aisle in search of bipartisan solutions to the nation’s gravest problems – without alienating the liberal base that put him in office. The infrastructure package, among Biden’s top year-one priorities, is an enormous $2.25 trillion wish list that combines hundreds of billions of dollars in new spending for traditional public works projects like roads, bridges and public transit, with funding to fight climate change and additional provisions to prop up America’s families, including new child care and health care benefits.Democrats are leaning toward a plan to separate the package into two smaller proposals: one featuring the more conventional infrastructure projects, which party leaders believe have a better chance of winning Republican support; and the other focused on the family care provisions, which face stronger headwinds from the right. Speaker Nancy Pelosi (D-Calif.) has said she wants to pass both before Congress’s August recess, but there are plenty of hurdles standing in the way. Internally, Democrats are at odds over the size of the package, with liberals urging Biden to go bigger while moderates are more wary of deficit spending – and the political blowback that might accompany it. Across the aisle, the president is also facing heavy resistance from conservatives who say the package is too large, leans heavily on tax increases and covers too many issues outside the realm of traditional infrastructure. “You can’t just make up words and add ‘infrastructure’ at the end,” Graves said in the phone interview, panning what Democrats are calling “social infrastructure.”
Rep. Katie Porter calls Biden’s move to split up his infrastructure package ‘a big mistake’ -Democratic Rep. Katie Porter of California called President Joe Biden’s decision to split up his infrastructure plan into separate jobs and family components a major error. “This idea that there are two separate buckets, a bucket of American Jobs Plan … and this idea he has a second plan coming soon that he’s called the American Families Plan. I told the White House, ‘I think this is a big mistake,'” she said in an Axios interview published Friday.She continued: “I think it’s mislabeling what you know as president to be true, which is that all of this is about our economy and economic recovery.””Strong family policy is strong jobs policy,” she said. Porter previously expressed a fear that women could be left behind in the Biden plan, CNBC reported.Biden recently unveiled a $2.3 trillion public-works plan, the first of two plans aimed at upgrading the nation’s infrastructure. The plancontains new funds to repair deteriorating roads and bridges, eliminate lead pipes from water systems, and widen the reach of broadband networks.The second part will be known as the American Family Plan, a package expected to contain a multi-trillion investment into childcare and education. Republicans are strongly critical of the Democratic infrastructure push, arguing that its tax hikes would slam into the economy.Last month, Biden noted that 2 millions women had left the workforce since the pandemic started.”A lot of that is because so much extra weight of caregiving and responsibility is falling on their shoulders,” he said at a White House event. “It causes women to miss work, cut hours, and leave their jobs and care for their children and aging loved ones.” “How many men are staying home and doing it, and the woman’s staying in the workforce?” he asked.
INFRASTRUCTURE: Oval Office meeting fails to bridge partisan divide — Tuesday, April 13, 2021 — President Biden’s meeting yesterday with lawmakers from both parties failed to produce a breakthrough over partisan tensions about his sweeping infrastructure plan, even as lawmakers expressed tepid optimism about the dialogue.
Washington Post reporter explains how taxes in Biden infrastructure plan would affect multinational corporations – video – Washington Post economics reporter Jeff Stein on Monday delved into how taxes in President Biden’s infrastructure proposal could dramatically change how multinational corporations operate.While appearing on Hill.TV’s “Rising,” Stein noted that former President Trump’s 2017 tax law, whether inadvertently or not, encouraged corporations to move their operations overseas. “So there’s going to be a lot of measures in the Democratic plans … dramatically increasing what corporations pay on their overseas operations,” Stein said.Stein also said that Treasury Secretary Janet Yellen is working with the Organisation for Economic Co-operation and Development to stop the global corporate tax rate from dropping, as it has for decades in Europe, the U.S. and Asia.”Instead of trying to just compete with these other countries, what Yellen is trying to do is coordinate an international effort in which the globe agrees to stop this race to the bottom,” Stein said. “And the idea there is that even if the U.S. increases its corporate taxes, once that floor is enacted across the world, there will be less of an incentive for, you know, corporations… to go abroad.”According to Stein, this plan is an “interesting inversion” of what Democrats have typically espoused, that higher taxes don’t actually cause companies to move abroad. “Yellen is kind of implicitly acknowledging that Republicans might have a point here,” Stein said.
Seven takeaways from Biden’s budget proposal: defense, immigration, climate | Reuters – Here are seven takeaways from U.S. President Joe Biden’s proposed federal budget, released on Friday:
- HEADLINE NUMBERS. Federal discretionary spending is up by 8.4% compared to 2021 levels, excluding emergency funding, to $1.52 trillion, with a focus on health, education and climate. About two-thirds of the massive budget is “mandatory” spending for benefits like Social Security and Medicare.
- MILITARY AND DEFENSE SPENDING. Making up about half of the U.S. discretionary budget, this would increase by 1.7% to $753 billion. The increase will likely upset progressives, who pushed for cuts to the never-audited Defense Department to fuel other policy priorities. Because it is lower than former President Donald Trump’s 2022 projections, it may also anger Republican defense hawks pushing for more spending.
- HEALTH AND MEDICAL RESEARCH. The budget includes $8.7 billion in funding for the Centers for Disease Control and Prevention, representing what the White House says is the largest increase in two decades. The CDC has suffered from a decade of declining funding, and the agency’s muddled response to the coronavirus pandemic may have contributed to the spread of the disease, Reuters reported here. The budget also allocates $6.5 billion for a new research agency to direct federal funding to diabetes, Alzheimer’s and cancer research, and $10.7 billion to research and prevent opioid addiction, representing a nearly $4 billion increase from last year.
- IMMIGRATION. The budget includes $52 billion for the U.S. Department of Homeland Security, with about $1.2 billion going to investments in modern border security technology. It lays out spending to rebuild the refugee program, which was slashed dramatically under Trump, and boosts funding to reduce backlogs in the immigration court system and in the processing of asylum and citizenship cases.
- CLIMATE. The proposal includes budget boosts of about 20% for the Environmental Protection Agency and the National Science Foundation over last year’s enacted levels. A total $14 billion boost on climate spending is expected to go a long way toward reversing Trump’s slashing of regulations on fossil fuel producers such as rules on methane, a potent greenhouse gas, and provides $1.2 billion for the international Green Climate Fund as part of Biden’s re-entry into the Paris Agreement on climate change.
- IMPOVERISHED SCHOOLS. Biden’s budget would distribute a record $36.5 billion to America’s neediest school districts through the Title I federal aid program, up $20 billion from the 2021 enacted level. This comes on the heels of the American Rescue Plan Act, which invested more than $122 billion in K-12 public schools and allocated funds based on poverty concentration. The budget includes $1 billion for school nurses and mental health programs to address effects of the COVID-19 pandemic.
- TRANSIT. The administration is proposing $600 million to buy electric vehicles for government agencies and charging stations, including for the U.S. Postal Service and $8 billion for the Energy Department to invest in clean energy technologies, up 27% over the prior year’s funding. It would also boost U.S. passenger railroad Amtrak funding by 35%.
US announces deal with Mexico, Guatemala and Honduras to use military against migrants – The Biden administration announced agreements this week with the governments of Mexico, Guatemala and Honduras to deploy thousands of troops and police against refugees escaping a growing humanitarian crisis in the region. White House press secretary Jen Psaki reported that Mexico agreed to keep 10,000 troops deployed across its southern border, Guatemala will deploy 1,500 soldiers and police to block migration routes, and Honduras will field 7,000 military and police personnel to stop migrants from leaving the country. “The objective is to make it more difficult to make the journey and make crossing the borders more, more difficult,” explained Psaki.Currently, there are 3,600 US active-duty soldiers deployed on the US southern border in support of the Department of Homeland Security (DHS), which requested in February that this continue for “the next three to five years, possibly more.”The Mexican foreign ministry confirmed the deal shortly after the US announcement in a statement that pledged: “Mexico will maintain its existing deployment of federal forces along its border region … ” Fearful of a domestic backlash, the Honduran and Guatemalan governments denied any official agreements. Vice President Kamala Harris announced Wednesday that she is planning a trip to Mexico and Guatemala to discuss addressing the “root causes” of migration, including investments promised by Biden. While the militarized crackdown is already taking place, including against two caravans this year, promises to alleviate social ills ring hollow. Economic desperation is a core component not only for maintaining Mexico and Central America as platforms for cheap labor but for coercing workers into going into infected workplaces during the COVID-19 pandemic. The ruling elites have already demonstrated a willingness to sacrifice countless lives for profits. Even as the militarization agreement was being announced, 30 Mexican Marines were detained for participating in the disappearance of dozens of people ostensibly as part of the “war on drugs” that has left over 250,000 people dead and 85,000 missing since 2006. So far this year, Mexican security forces are known to have murdered two migrants. Beyond this notorious case, the Honduran regime has regularly massacred protesters and striking workers since being installed in a 2009 military coup backed by the Obama administration. Current President Juan Orlando Hernflndez has been named by US prosecutors as a major partner of Mexican and Honduran drug cartels. More than 172,000 migrants were arrested by the US Border Patrol in March, up 71 percent from February. More than 20,000 unaccompanied minors remain under US custody in overcrowded and jail-like detention centers, where they are forced to remain far beyond the legal limit of 72 hours. Over 60 percent of the migrants detained last month were immediately returned to Mexico under Title 42, the same law employed by the Trump administration, using the pandemic as a pretext to abrogate the right to apply for asylum enshrined in US and international law.
Biden keeps U.S. refugee cap at Trump-era 15,000 – for now – President Joe Biden signed an order on Friday limiting U.S. refugee admissions this year to the historically low 15,000 cap set under his predecessor Donald Trump, shelving a plan to raise it to 62,500 and drawing the ire of refugee advocates and some Democratic lawmakers. But as criticism mounted, the White House issued a statement saying Biden would set a “final, increased refugee cap” for the remainder of this fiscal year by May 15. Biden’s order to limit admissions to 15,000 was a blow to advocacy groups that wanted the Democratic president to move swiftly to reverse the refugee policies of the Republican Trump, who had set the figure as a way to limit immigration. The program for admitting refugees is distinct from the asylum system for migrants. Refugees must be vetted while still overseas and cleared for entry to the U.S., unlike migrants who arrive at a U.S. border and then request asylum. Biden, who took office in January, had signaled two months ago plans to raise the cap during the 2021 fiscal year ending on Sept. 30, but held off on actually doing so. The president’s cautious approach appears to have been tied to concerns over the optics of admitting more refugees at a time of rising numbers of migrants arriving at the U.S.-Mexico border in recent months, and to not wanting to look “too open” or “soft,” another U.S. official with knowledge of the matter told Reuters. Criticism was swift. “Facing the greatest refugee crisis in our time there is no reason to limit the number to 15,000. Say it ain’t so, President Joe,” said U.S. Senator Dick Durbin, the second highest ranking Democrat in the Senate. Advocates say the two groups of migrants, refugees and asylum seekers, are distinct and that resettlement was long neglected under Trump. Hours later as the complaints flowed in, White House spokeswoman Jen Psaki said in a statement the original announcement had been “the subject of some confusion” and that a final refugee cap for the year would be set by May 15. Psaki said, Biden’s “initial goal of 62,500 seems unlikely” between now and the end of the fiscal year on Oct. 1, “given the decimated refugee admissions program we inherited.” Republicans have blamed Biden for the situation at the border, faulting his moves to reverse other Trump-era hardline immigration policies. Biden pledged in February to increase the number of refugees admitted in the next fiscal year to 125,000. Under the presidential determination signed by Biden, the United States will offer refugee status to a wider part of the world than had been allowed by Trump by changing the allocation of refugee slots, the senior administration official said. Under Biden’s new plan, the 15,000 slots would be allocated this way: 7,000 for Africa, 1,000 for East Asia, 1,500 for Europe and Central Asia, 3,000 from Latin America and the Caribbean, 1,500 from the Near East and South Asia, and 1,000 for an unallocated reserve.
Fed official backs using capital buffer to reduce impact of future crises – The Federal Reserve should consider raising a required capital buffer when the economy is in good shape rather than easing capital rules to limit the impact of a downturn, according to the head of the Federal Reserve Bank of Boston. The countercyclical capital buffer – often called the CCyB – is a tool that allows the Fed to require banks with more than $250 billion of assets or $10 billion of nonbank liabilities to hold additional capital while economic conditions are strong to counteract the elevated potential for riskier lending. But the Basel III-related rule has never actually been used in the United States, with Fed governors consistently voting over the years to maintain the buffer level at zero percent. Boston Fed President Eric Rosengren proposed Monday that going forward, regulators should reconsider actually turning the buffer on while the economy is strong. Although Rosengren is not a member of the Federal Reserve Board of Governors, which votes yearly on whether to turn on the CCyB, his views could influence others on the board. “Rather than disrupt bank capital planning and rely on temporary relief from capital regulations, the CCyB provides a ‘shock absorber’ that, if appropriately implemented, would allow borrower financing to continue without these temporary extraordinary and less predictable measures,” he said during remarks at an event hosted by the Newton-Needham Chamber of Commerce. The Fed took a number of steps at the onset of the coronavirus pandemic to ensure that banks had sufficient capital to continue lending throughout the crisis. Those included restricting dividend payments and easing the supplementary leverage ratio, which requires banks with more than $250 billion of assets to maintain an extra cushion of high-quality capital against their total assets. “While these measures were needed at the time, and thus appropriate, in my view they reflect a capital regime that is not sufficiently flexible during economic downturns,” said Rosengren. “Investors in banks, and bank management teams, would prefer to avoid the attendant uncertainty around capital planning, and bank regulators would prefer to not suspend bank regulations in economic downturns.” His views on the CCyB differ from those of Fed Vice Chairman for Supervision Randal Quarles, who has long said that the CCyB is effectively turned on in the U.S. because bank capital levels are already so high.
FDIC has tough task persuading unbanked to deposit stimulus checks – As the government urges the unbanked to open accounts to deposit pandemic relief funds, some experts highlight a somewhat obvious challenge for the effort. If someone was unwilling to become a bank customer before, why would they change their mind now? The Federal Deposit Insurance Corp. and Internal Revenue Service have been encouraging more consumers to open low-cost checking accounts following enactment of the Biden administration’s American Rescue Plan. The FDIC announced a public awareness campaign April 6 with television, radio and digital ads in Atlanta and Houston touting the benefits of federally insured deposit accounts. To pull it off, however, the FDIC will have to convince some in lower-income and minority communities, who have historically been reluctant about joining a traditional financial institution, that they should trust a bank. “It’s a challenge to try and really reestablish, or establish, trust with any institution,” Leonard Chanin, a deputy to FDIC Chair Jelena McWilliams, said at an event this past week to kick off the #GetBanked campaign. He said a lack of trust was one of the “fundamental” reasons why many individuals in poor communities choose not to open bank accounts. “It’s not clear there’s any simple path to achieve that.”But observers say the FDIC campaign offers hope by giving unbanked consumers concrete steps to identify and open safe and affordable accounts. The agency’s last unbanked survey in 2019 reported that just over 7 million households lack access to a bank.The agency’s television ad urges consumers to visit FDIC.gov/getbanked, where customers will have the option to use the FDIC’s BankFind tool to find insured bank accounts near them. The same page also links users to a similar page from Bank On, a nonprofit-led effort to certify certain affordable accounts that are endorsed by the American Bankers Association.”If you don’t have a message that includes some sort of a way for people to act upon something – if you can’t give them an easy way to do what you want them to do – then you’re not likely to have an effective message,” said Wendy Melillo, an associate professor of journalism at American University who has studied public awareness campaigns.
First Republic reports earnings spike from stimulus programs – Loan growth and wealth management revenue fueled by stimulus cash and a recovering economy pushed quarterly profit higher at First Republic Bank in San Francisco. The $155.8 billion-asset bank’s first-quarter earnings rose 53% from a year earlier to $316 million. The results included $14.6 million in reserves the company released during the quarter. New loan originations increased by 52% to $15.7 billion, largely because of mortgages and a surge in Paycheck Protection Program loans. And revenue in the bank’s wealth management business rose by nearly 19% to $157 million. Deposits were up 37%, though executives said they expect some money to leave the bank when the extended tax deadline in May arrives. While First Republic said it expects loan growth in the “mid-teens” this year, analysts expressed concerns that a housing supply crunch could stymie new mortgage originations. Mortgages represented about 44% of the bank’s new loans. First Republic CEO and Chairman Jim Herbert said during a Tuesday conference call that the housing shortage “won’t be much of a factor,” expressing optimism that more homes will go on the market as more COVID-19 vaccines are distributed and the economy continues to bounce back. “As soon as COVID fades into the background we’ll pick up volume,” Herbert said. “It’s already beginning to do so.” There was less than a two-month supply of homes for sale in the U.S. in January, the lowest amount since the National Association of Realtors began releasing data in 1982. The supply inched up in February, to roughly 1.03 million houses. While that’s still down nearly 30% from a year earlier, Herbert said there are signs that things are returning to normal. In New York, volumes “have picked up considerably in the early part of the year,” he said.
MBA Survey: “Share of Mortgage Loans in Forbearance Decreases to 4.66%” — Note: This is as of April 4th. From the MBA: Share of Mortgage Loans in Forbearance Decreases to 4.66%: The Mortgage Bankers Association’s (MBA) latest Forbearance and Call Volume Survey revealed that the total number of loans now in forbearance decreased by 24 basis points from 4.90% of servicers’ portfolio volume in the prior week to 4.66% as of April 4, 2021. According to MBA’s estimate, 2.3 million homeowners are in forbearance plans…”The share of loans in forbearance decreased for the sixth straight week, dropping by 24 basis points – one of the largest decreases in the history of the series. The forbearance share also decreased significantly for all three investor categories, with the rate for Ginnie Mae loans down an impressive 45 basis points. Overall, forbearance exits increased to their fastest pace since early November,” said Mike Fratantoni, MBA’s Senior Vice President and Chief Economist. “Almost 32 percent of borrowers in forbearance extensions have now exceeded the 12-month mark. In terms of performance, more than 88% of homeowners who have exited into deferral plans, modifications, or repayment plans were current on their loans at the end of March, compared to 92% of all homeowners.”Fratantoni added, “The accelerating economic recovery in March helped more homeowners recover and become current on their mortgages, in addition to helping other homeowners with more stable financial situations exit forbearance. Homeowners who are still facing hardships and need to extend their forbearance term should contact their servicers.”This graph shows the percent of portfolio in forbearance by investor type over time. Most of the increase was in late March and early April, and has trended down since then. The MBA notes: “Total weekly forbearance requests as a percent of servicing portfolio volume (#) increased relative to the prior week: from 0.04% to 0.05%.”
Mortgage forbearances hit lowest level in a year – Economic stabilization drove one of the biggest mortgage recoveries on record, according to the Mortgage Bankers Association. The number of mortgages in coronavirus-related forbearance fell for the sixth week in a row, dropping 24 basis points between March 29 and April 4. Home loans in forbearance plans represent 4.66% – about 2.3 million homeowners – of all outstanding mortgages, down from 4.9% the week prior. It’s the lowest forbearance rate since exactly one year earlier when the share rose to 3.74% on April 5, 2020, the largest fall since July and one of the largest in the history of the series, according to MBA’s SVP and chief economist Mike Fratantoni. The percentage of forborne loans at independent mortgage bank servicers dropped to 4.89% from 5.18% and depositories declined to 4.8% from 5.03%. “Overall, forbearance exits increased to their fastest pace since early November,” Fratantoni said in a press release. “The accelerating economic recovery in March helped more homeowners recover and become current on their mortgages, in addition to helping other homeowners with more stable financial situations exit forbearance.” Each investor category saw major declines in forborne mortgage share. Ginnie Mae loans – which are Federal Housing Administration, Department of Veterans Affairs and U.S. Department of Agriculture Rural Housing Service products – plummeted 45 basis points to 6.33% from 6.78%. Conforming mortgages – those purchased by Fannie Mae and Freddie Mac – continue to lead in the recovery, going to 2.52% from 2.72%. Meanwhile, private-label securities and portfolio loans – products not addressed by the coronavirus relief act – dropped to 8.65% from 8.8%. A 13.2% share of all forborne mortgages sits in the initial forbearance stage, while 82% shifted to extended plans and the remaining 4.8% re-entered forbearance after exiting previously. Forbearance requests as a percentage of servicing portfolio volume edged up slightly to 0.05% from 0.04% the week earlier. Call center volume as a percentage of portfolio volume increased to 8.5% from 8.1%. The MBA’s sample for this week’s survey includes a total of 48 servicers with 25 independent mortgage bankers and 21 depositories. The sample also included two subservicers. By unit count, the respondents represented about 74%, or 36.9 million, of outstanding first-lien mortgages.
Black Knight: Number of Homeowners in COVID-19-Related Forbearance Plans Decreased Slightly –This data is as of April 13th. From Black Knight: Forbearances Improve for Seventh Straight Week The country saw a modest decrease in the number of active forbearance plans this week, falling by just 1,000 but still marking the seventh consecutive week of improvement.This mid-month lull in improvement was expected – they’ve become commonplace during the recovery, with the strongest rates of improvement seen early and late in the month as mortgages are reviewed for extension/removal from forbearance. With 380,000 loans still slated for these reviews by the end of this month, we could still see additional forbearance improvement in late April/early May.Plan starts hit their highest level in three weeks, but this was primarily due to re-starts, as a portion of the nearly 500,000 homeowners who’d left forbearance in recent weeks likely reached out to their servicers to reinstate their plans. New plan starts remain near post-pandemic lows.Despite the marginal improvement this week, the number of outstanding plans is still down by 296,000 (-11.4% month-over-month) marking considerable improvement in recent weeks. As of April 13, there are now 2.3 million homeowners in COVID-19-related forbearance plans, representing 4.4% of all mortgage-holders.We’ll continue to monitor the situation, and will have another report published here next Friday, April 23.The number of loans in forbearance continues to decline.
MBA: Mortgage Applications Decrease in Latest Weekly Survey –From the MBA: Mortgage Applications Decrease in Latest MBA Weekly Survey: Mortgage applications decreased 3.7 percent from one week earlier, according to data from the Mortgage Bankers Association’s (MBA) Weekly Mortgage Applications Survey for the week ending April 9, 2021…. The Refinance Index decreased 5 percent from the previous week and was 31 percent lower than the same week one year ago. The seasonally adjusted Purchase Index decreased 1 percent from one week earlier. The unadjusted Purchase Index decreased 1 percent compared with the previous week and was 51 percent higher than the same week one year ago. Purchase and refinance applications declined, with most of the pullback coming earlier in the week when rates were higher. Treasury yields started last week high – close to the prior week’s level at over 1.7 percent – before decreasing 6 basis points,” said Joel Kan, MBA’s Associate Vice President of Economic and Industry Forecasting. “Refinance activity has now decreased for nine of the past 10 weeks, as rates have gone from 2.92 percent to 3.27 percent over the same period. Last week’s index level was the lowest in over a year, as mortgage rates continue to trend higher. Many borrowers have either already refinanced at lower rates or are unwilling – or unable – to refinance at current rates.” Added Kan, “The third straight week of declining purchase activity is a sign that rising home prices and tight supply is constraining home sales – especially in the lower price tiers. Purchase applications were still above last year’s pandemic-impacted low point, but fell behind the level of activity seen the same week in 2019.” The average contract interest rate for 30-year fixed-rate mortgages with conforming loan balances ($548,250 or less) decreased to 3.27 percent from 3.36 percent, with points decreasing to 0.33 from 0.43 (including the origination fee) for 80 percent loan-to-value ratio (LTV) loans. The first graph shows the refinance index since 1990. With low rates, the index remains elevated, but falling since rates are above the lows.The second graph shows the MBA mortgage purchase index. According to the MBA, purchase activity is up 51% year-over-year unadjusted.
NMHC: Rent Payment Tracker Shows Households Paying Rent Increased 1.9% YoY in Early April – From the NMHC: NMHC Rent Payment Tracker Finds 79.8 Percent of Apartment Households Paid Rent as of April 6 – The National Multifamily Housing Council (NMHC)’s Rent Payment Tracker found 79.8 percent of apartment households made a full or partial rent payment by April 6 in its survey of 11.6 million units of professionally managed apartment units across the country. This marks one year of tracking rent payment data following the onset of the pandemic. This is a 1.9 percentage point increase from the share who paid rent through April 6, 2020 and compares to 82.9 percent that had been paid by April 6, 2019. This data encompasses a wide variety of market-rate rental properties across the United States, which can vary by size, type and average rental price. “This month’s data is more evidence of a recovering economy and the resilience of the multifamily industry,” said Doug Bibby, NMHC President. “While we are not out of the woods yet, there is light at the end of the tunnel. The recently passed American Rescue Plan included $26 billion in rental assistance as well as billions more of housing resources that will prove critical to keeping families safely and securely housed and the nation’s rental housing sector stable. This graph from the NMHC Rent Payment Tracker shows the percent of household making full or partial rent payments by the 6th of the month compared to 2019 and to the first COVID year. Although payments are down from 2019, rent payments are up from last year. This is mostly for large, professionally managed properties. The second graph shows full month payments through March compared to the same month the prior year. This shows a decline in rent payments year-over-year. There are some timing issues month to month, but full month rent payments have declined year-over-year through March.
Housing Starts increased to 1.739 Million Annual Rate in March – From the Census Bureau: Permits, Starts and Completions: Privately-owned housing starts in March were at a seasonally adjusted annual rate of 1,739,000. This is 19.4 percent above the revised February estimate of 1,457,000 and is 37.0 percent above the March 2020 rate of 1,269,000. Single-family housing starts in March were at a rate of 1,238,000; this is 15.3 percen above the revised February figure of 1,074,000. The March rate for units in buildings with five units or more was 477,000. Privately-owned housing units authorized by building permits in March were at a seasonally adjusted annual rate of 1,766,000. This is 2.7 percent above the revised February rate of 1,720,000 and is 30.2 percent above the March 2020 rate of 1,356,000. Single-family authorizations in March were at a rate of 1,199,000; this is 4.6 percent (plus/minus 1.9 percent) above the revised February figure of 1,146,000. Authorizations of units in buildings with five units or more were at a rate of 508,000 in March. The first graph shows single and multi-family housing starts for the last several years. Multi-family starts (red, 2+ units) increased in March compared to February. Multi-family starts were up 29% year-over-year in March. Single-family starts (blue) increased in March, and were up 41% year-over-year (starts slumped at the beginning of the pandemic). The second graph shows total and single unit starts since 1968. The second graph shows the huge collapse following the housing bubble, and then the eventual recovery (but still not historically high). Total housing starts in March were well above expectations, and starts in January and February were revised up.
Comments on March Housing Starts –Earlier: Housing Starts increased to 1.739 Million Annual Rate in MarchThis was the highest level for starts since June 2006. Total housing starts in March were above expectations, and starts in January and February were revised up. Single family starts increased in March, and were up 41% year-over-year (starts declined at the beginning of the pandemic). The volatile multi-family sector is up year-over-year (apartments were under pressure from COVID). The housing starts report showed total starts were up 19.4% in March compared to February, and total starts were up 37.0% year-over-year compared to March 2020. Low mortgage rates and limited existing home inventory have given a boost to single family housing starts. The first graph shows the month to month comparison for total starts between 2020 (blue) and 2021 (red). Starts were up 37.0% in March compared to March 2020. The year-over-year comparison will be easy again in April, May and June. 2020 was off to a strong start before the pandemic, and with low interest rates and little competing existing home inventory, starts finished 2020 strong. Starts have started 2021 strong (February was impacted by the harsh weather). Below is an update to the graph comparing multi-family starts and completions. Since it usually takes over a year on average to complete a multi-family project, there is a lag between multi-family starts and completions. Completions are important because that is new supply added to the market, and starts are important because that is future new supply (units under construction is also important for employment). These graphs use a 12 month rolling total for NSA starts and completions. The blue line is for multifamily starts and the red line is for multifamily completions. The rolling 12 month total for starts (blue line) increased steadily for several years following the great recession – then mostly moved sideways. Completions (red line) had lagged behind – then completions caught up with starts- then starts picked up a little again late last year, but have fallen off with the pandemic. The last graph shows single family starts and completions. It usually only takes about 6 months between starting a single family home and completion – so the lines are much closer. The blue line is for single family starts and the red line is for single family completions. Single family starts are getting back to more normal levels, but I still expect some further increases in single family starts and completions on a rolling 12 month basis – especially given the low level of existing home inventory.
New Residential Building Permits: Up 2.7% in March – — The U.S. Census Bureau and the Department of Housing and Urban Development have now published their findings for March new residential building permits. The latest reading of 1.766M was up 2.7% from the February reading and is above the Investing.com forecast of 1.750M.Here is the opening of this morning’s monthly report, including a note regarding revisions: Privately-owned housing units authorized by building permits in March were at a seasonally adjusted annual rate of 1,766,000. This is 2.7 percent (plus/minus 1.7 percent) above the revised February rate of 1,720,000 and is 30.2 percent (plus/minus 1.8 percent) above the March 2020 rate of 1,356,000. Single-family authorizations in March were at a rate of 1,199,000; this is 4.6 percent (plus/minus 1.9 percent) above the revised February figure of 1,146,000. Authorizations of units in buildings with five units or more were at a rate of 508,000 in March. [link to report]Here is the complete historical series, which dates from 1960. Because of the extreme volatility of the monthly data points, a 6-month moving average has been included. Here is the data with a simple population adjustment. The Census Bureau’s mid-month population estimates show substantial growth in the US population since 1960. Here is a chart of housing starts as a percent of the population. We’ve added a linear regression through the monthly data to highlight the trend.
NAHB: Builder Confidence Increased to 83 in April — The National Association of Home Builders (NAHB) reported the housing market index (HMI) was at 83, up from 82 in March. Any number above 50 indicates that more builders view sales conditions as good than poor.From the NAHB: Builder Confidence Edges Up as Strong Demand Offsets Supply-Side Challenges: Strong buyer demand pushed builder confidence up in April even as builders continued to grapple with rising lumber prices and supply chain issues and consumers faced higher home prices due to a lack inventory. The latest NAHB/Wells Fargo Housing Market Index (HMI) released today shows that builder confidence in the market for newly built single-family homes rose one point to 83 in April. “The supply chain for residential construction is tight, particularly regarding the cost and availability of lumber, appliances, and other building materials. Though builders are seeking to keep home prices affordable in a market in need of more inventory, policymakers must find ways to increase the supply of building materials as the economy runs hot in 2021.””While mortgage interest rates have trended higher since February and home prices continue to outstrip inflation, housing demand appears to be unwavering for now as buyer traffic reached its highest level since November,” The HMI index gauging current sales conditions increased one point to 88 and the gauge charting traffic of prospective buyers posted a three-point gain to 75. The component measuring sales expectations in the next six months fell two points to 81.Looking at the three-month moving averages for regional HMI scores, the Northeast rose six points 86 and the South moved up one point to 83. The West held steady at 90 and the Midwest fell two points to 78. This graph show the NAHB index since Jan 1985.This was at the consensus forecast, and a very strong reading.Housing and homebuilding have been one of the best performing sectors during the pandemic.
Hotels: Occupancy Rate Down 15% Compared to Same Week in 2019 –Note: The year-over-year occupancy comparisons are easy, since occupancy declined sharply at the onset of the pandemic. However, occupancy is still down significantly from normal levels. The occupancy rate is down 15% compared to the same week in 2019.From CoStar: STR: US Hotels Achieve Highest Weekly Demand Level Since Start of COVID-19: The U.S. hotel industry posted its highest demand and occupancy levels since the beginning of the pandemic, according to STR’s latest weekly data through April 10.
April 4-10, 2021:
Occupancy: 59.7%
Average daily rate (ADR): US$112.22
Revenue per available room (RevPAR): US$66.99
Reflecting the country’s almost 2-point improvement in occupancy from the previous week, more than 50% of properties posted a weekly occupancy above 60%. For more, see STR’s U.S. Market Recovery MonitorThe following graph shows the seasonal pattern for the hotel occupancy rate using the four week average.The red line is for 2021, black is 2020, blue is the median, and dashed light blue is for 2009 (the worst year since the Great Depression for hotels prior to 2020). Occupancy is now above the horrible 2009 levels.
Retail Sales Increased 9.8% in March – On a monthly basis, retail sales increased 9.8 percent from February to March (seasonally adjusted), and sales were up 27.7 percent from March 2020. From the Census Bureau report: Advance estimates of U.S. retail and food services sales for March 2021, adjusted for seasonal variation and holiday and trading-day differences, but not for price changes, were $619.1 billion,an increase of 9.8 percent from the previous month, and 27.7 percent above March 2020.This graph shows retail sales since 1992. This is monthly retail sales and food service, seasonally adjusted (total and ex-gasoline).Retail sales ex-gasoline were up 9.7% in March. The stimulus checks boosted retail sales significantly in March.The second graph shows the year-over-year change in retail sales and food service (ex-gasoline) since 1993. Retail and Food service sales, ex-gasoline, increased by 27.4% on a YoY basis. Sales in March were slightly above expectations, and sales in January and February were revised up.
Why March’s big jump in real retail sales augurs well for big employment gains through summer –Yesterday I wrote that the steep decline in new jobless claims in the past 4 weeks likely presages another big monthly employment gain, on the order of 1 million or more jobs.Another very big positive for the next few months in employment is the massive, stimulus-fueled jump in retail sales.As I have pointed out many times, real retail sales (blue in the graph below, /2 for scale) tend to lead employment (red) by about 3-4 months. Here’s the long term YoY look from 1993 on, averaged quarterly to cut down on noise:I’ve also included aggregate hours (gold) in the above. Hours tend to be cut more than jobs in recessions, and increase faster in recoveries. The pandemic has been somewhat unique in that, for obvious public health reasons, jobs were cut entirely rather than just hours. Note also the “China shock” in the first few years after 1999, when both jobs and hours continued to be cut, even after sales had rebounded.But saying that there is likely to be a big YoY jump in jobs in the next several months is hardly surprising, given the 22 million loss in jobs last April. So the below graph compares the absolute data, sales on the left scale, and employment on the right: Again, the brief lag with which employment follows sales is obvious. The most important takeaway is that, if the big March gain in sales isn’t taken back in the next month or two, then there’s likely to be a similarly large jump in employment by the end of summer. A gain of another 4 to 6 million jobs, to close to the pre-pandemic peak, is quite possible.
After a vicious year of bankruptcies, some retailers are still at risk. 13 companies, including Rite Aid, Belk, and Neiman Marcus, could be the next to default. -Apparel and department stores are the most at risk for defaulting on their loans in 2021, analysts with Moody’s Investors Service said in an April 7 report. After a brutal year in 2020, in which dozens of retailers filed for bankruptcy, more filings could be coming, but not as many as last year, the analysts said. Apparel stores accounted for about half of defaults in 2020, and the sector is still “in the eye of the storm,” as it confronts long-term pressures, like declining mall traffic, the analysts said. Although the 2021 forecast “marks a vast improvement over the prior year, it is still historically high relative to prior recoveries, pointing to significant ongoing risk for an industry not yet out of the woods,” the report said.The analysts identified 13 stores at the highest risk of defaulting, and most of them are apparel stores. Rite Aid, the US pharmacy chain with 2,500 stores in 19 states, cut its full-year forecast for 2021, and it has $1.5 billion in outstanding debt rated high risk. Moody’s said its competitive disadvantage and near-term maturities are putting it in danger of default. “Debt-strapped” Party City eased its heavy burden last year when it announced a bond restructuring, Moody’s said. While the party retailer is still at risk of default because of ongoing challenges from low demand, the risk isn’t “immediate,” the analysts said. Women’s clothing store Talbots is among apparel retailers at risk. Talbots doesn’t have much cash on hand, and it’s debt is coming due soon, analysts said. Belk, a private apparel retailer with locations in 16 states, already marked the first bankruptcy of 2021. Plus, it has a lot of debt and not a lot of cash on hand. Men’s Wearhouse was among the long-struggling companies that defaulted in 2020, along with retailers like J.C. Penney and J. Crew. . Moody’s said the company’s outlook is currently stable, though it’s still at risk amid continued sector challenges. Neiman Marcus was also among retailers that filed for bankruptcy in 2020, as it was under “inexorable” pressure from the pandemic. The department store chain was “one of the highest-profile companies to succumb to bankruptcy” in 2020, analysts said, but it “emerged from Chapter 11 in September after shedding more than $4 billion of debt.” The company’s debt rating remains below investment-grade, however, keeping it at risk of default. J. Jill, owned by Jill Acquisition, restructured its debt in 2020, giving the company “additional time to recover from coronavirus-driven disruption in the apparel retail industry,” Moody’s said at the time. Though the women’s apparel retailer still has risky debt on hand with weak liquidity, Shoes for Crews, owned by SHO Holding, extended the deadline for its debt maturity last year during the pandemic. Still, the maker of slip-resistant, safety footwear for workers is at risk of default, as it faces the continued challenges of the apparel industry and is strapped with debt. Outerstuff, the maker of major league sports apparel for youth, is one of the several retailers facing challenges as an apparel store. The private company is at risk of default as it has an “unsustainable capital structure at current levels of performance, small revenue scale, narrow product concentration primarily in licensed children’s sports apparel in North America with a small, but growing, adult and international presence, and reliance on licensing arrangements from several sports leagues for a significant majority of revenue,”Moody’s said
BLS: CPI increased 0.6% in March, Core CPI increased 0.3% —From the BLS: The Consumer Price Index for All Urban Consumers (CPI-U) increased 0.6 percent in March on a seasonally adjusted basis after rising 0.4 percent in February, the U.S. Bureau of Labor Statistics reported today. The March 1-month increase was the largest rise since a 0.6-percent increase in August 2012. Over the last 12 months, the all items index increased 2.6 percent before seasonal adjustment.The gasoline index continued to increase, rising 9.1 percent in March and accounting for nearly half of the seasonally adjusted increase in the all items index. The natural gas index also rose, contributing to a 5.0-percent increase in the energy index over the month. The food index rose 0.1 percent in March, with the food at home index and the food away from home index both also rising 0.1 percent. .The index for all items less food and energy rose 0.3 percent in March. The shelter index increased in March as did the motor vehicle insurance index, the recreation index, and the household furnishings and operations index. Indexes which decreased over the month include apparel and education..The all items index rose 2.6 percent for the 12 months ending March, a much larger increase than the 1.7-percent reported for the period ending in February. The index for all items less food and energy rose 1.6 percent over the last 12 months, after increasing 1.3 percent over the 12 month period ending in February. The food index rose 3.5 percent over the last 12 months, while the energy index increased 13.2 percent over that period. CPI and core CPI were slightly above expectations. I’ll post a graph later today after the Cleveland Fed releases the median and trimmed-mean CPI.
Consumer Price Index: March Headline at 2.62% — The Bureau of Labor Statistics released the March Consumer Price Index data this morning. The year-over-year non-seasonally adjusted Headline CPI came in at 2.62%, up from 1.68% the previous month. Year-over-year Core CPI (ex Food and Energy) came in at 1.65%, up from 1.28% the previous month and below the Fed’s 2% PCE target. Here is the introduction from the BLS summary, which leads with the seasonally adjusted monthly data: The Consumer Price Index for All Urban Consumers (CPI-U) increased 0.6 percent in March on a seasonally adjusted basis after rising 0.4 percent in February, the U.S. Bureau of Labor Statistics reported today. The March 1-month increase was the largest rise since a 0.6-percent increase in August 2012. Over the last 12 months, the all items index increased 2.6 percent before seasonal adjustment.The gasoline index continued to increase, rising 9.1 percent in March and accounting for nearly half of the seasonally adjusted increase in the all items index. The natural gas index also rose, contributing to a 5.0-percent increase in the energy index over the month. The food index rose 0.1 percent in March, with the food at home index and the food away from home index both also rising 0.1 percent.The index for all items less food and energy rose 0.3 percent in March. The shelter index increased in March as did the motor vehicle insurance index, the recreation index, and the household furnishings and operations index. Indexes which decreased over the month include apparel and education.The all items index rose 2.6 percent for the 12 months ending March, a much larger increase than the 1.7-percent reported for the period ending in February. The index for all items less food and energy rose 1.6 percent over the last 12 months, after increasing 1.3 percent over the 12 month period ending in February. The food index rose 3.5 percent over the last 12 months, while the energy index increased 13.2 percent over that period. Read more The first chart is an overlay of Headline CPI and Core CPI (the latter excludes Food and Energy) since the turn of the century. The highlighted two percent level is the Federal Reserve’s Core inflation target for the CPI’s cousin index, the BEA’s Personal Consumption Expenditures (PCE) price index.
Monthly consumer inflation rate increases by most in 10 years; real wages decline, but real aggregate wages increase -Seasonally adjusted consumer prices rose 0.6% in March. This was the biggest single month gain since June 2009, coming out of the Great Recession: Leaving aside the pandemic, since the 1980s recessions have only happened when CPI less energy costs (red) had risen to close to or over 3%/year, usually driven by increases in the price of oil by more than 40% YoY. Even with this month’s spike, YoY inflation ex-energy is only up 1.9%: Because in the first few months of the pandemic during the lockdowns there was a spurt of deflation as shown above in the first graph, in the below graph I’ve normed the values to 100 as of May of last year. In the 9 months since, total inflation has been up 3.5% (for a 4.7% annual rate), while inflation ex-energy has risen 2.0%, (for a 2.7% annual rate): This is still not enough to be of concern on a transient basis. Now let’s take a look at how inflation has affected real wages. Because wages are “stickier” than prices, typically as recessions beat down prices (or at least price increases), in real terms wages rise, either during or just after a recession. That was the case for the coronavirus recession as well. As prices increase with renewed demand, and employers are able to add workers from the larger pool of the unemployed and underemployed, real wages decelerate and even decline. That was the case for March. Real wages declined -0.5%, and are -3.1% off their all-time high set last April: They are still 0.9% above their previous 1973 peak. As more low-wage employees in service industries like dining and entertainment are called back to work, the YoY% change in real wages has decreased from over 7% last April to 1.9% in March: A further decline in real wages is quite likely. As a result, YoY real wage increases have declined from over 5% last I suspect we will see an actual YoY decline in real wages by the end of this year. A bright spot is that real *aggregate* payrolls for nonsupervisory workers did increase: These are now only -2.1% below their pre-pandemic peak, and equivalent to where they were in July 2019. If vaccinations succeed in controlling the pandemic, it is quite likely that these make a new all-time high by the end of the year as well.
Cleveland Fed: Key Measures Show Small Uptick in Inflation in March — The Cleveland Fed released the median CPI and the trimmed-mean CPI this morning: According to the Federal Reserve Bank of Cleveland, the median Consumer Price Index rose 0.2% March. The 16% trimmed-mean Consumer Price Index also rose 0.2% in March. “The median CPI and 16% trimmed-mean CPI are measures of core inflation calculated by the Federal Reserve Bank of Cleveland based on data released in the Bureau of Labor Statistics’ (BLS) monthly CPI report”. Note: The Cleveland Fed released the median CPI details for March here. Motor fuel was up 185% annualized in March. This graph shows the year-over-year change for these four key measures of inflation. On a year-over-year basis, the median CPI rose 2.0%, the trimmed-mean CPI rose 2.1%, and the CPI less food and energy rose 1.6%. Core PCE is for February and increased 1.4% year-over-year. Note: We saw negative Month-to-month (MoM) core CPI and CPI readings in March, April and May 2020. We also saw negative MoM PCE and core PCE reading in March and April 2020. Ignore a jump in YoY inflation in March, April and May!
Applications for New Businesses Have a Double-WTF Moment — The historic over-night explosion of layoffs last spring, the tsunami of free money from the government for people and businesses alike, whether they needed it or not, whether they were fraudulent or not, and people’s reactions to that free money have upended all kinds of economic dynamics. And the double-spike in applications to start new businesses is one of them.The 440,165 applications filed in March with the IRS for an “Employer Identification Number” (EIN) were up 47% from February 2020, the last month before the Pandemic. In Q1, applications jumped by 62% from a year ago. In July last year, business applications had nearly doubled year-over-year, producing a historic spike that faded through December, then re-spiked in January for a double-WTF moment – and we’ll get into potential reasons in a moment. This data from the Census Bureau is not based on surveys, but on actual applications by new businesses for a federal EIN, with which the IRS tracks businesses for tax purposes. Excluded are EIN applications that are not related to typical business formations, such as EIN applications “for tax liens, estates, trusts, or certain financial filings, applications with no state-county geocodes, applications from certain agricultural, public entities, and applications in certain industries (e.g. private households, civic and social organizations).”From the information in the EIN application, the Census Bureau estimates which businesses have a “high propensity” of having a significant payroll (“High-Propensity Business Applications” or HBA) and might therefore become job-creating machines.In March, there were 153,186 applications that the Census Bureau deemed to be HBAs, up 35% from February last year. In Q1, HBA applications jumped by 47% in Q1 compared to last year. That massive spike last July faded through December, but then applications re-spiked in January. Note that it took this spike to get to and surpass the number of applications before the Financial Crisis: Brick-and-mortar retail took a horrendous beating during the lockdowns, as large retailers that sold food and everything else, such as Walmart and Costco, were allowed to stay open, while retailers that didn’t sell food had to close. These retailers that had to close had already been beaten down before the Pandemic by the competition from ecommerce. Many big-box stores filed for bankruptcy. Little shops went quietly, walking away from their lease, maybe working out a deal with the landlord, and then closing the shop.The chart below of total business applications (red), high-propensity business applications (purple), and business applications with planned wages (green), all on the same scale, shows the reality that most business applications are for businesses that won’t have a significant payroll. They might employ the owner and eventually maybe a few other people, and often enough, they remain one-man or one-woman shops throughout their existence. That’s a great way to go, but they essentially create just one job: The chart above shows the top seven industries, by number of business applications in March, plus the increase from 2019:
- Retail (red): 81,469, nearly double from 2019
- Professionally services (green): 54,385, +38% from 2019
- Construction (black): 38,312, +16%
- Transportation & warehousing (light blue): 37,092, +83% Many are trying to ride the red-hot ecommerce boom with its final-mile delivery requirements, and the boom in deliveries of food and meals.
- Administration and support (yellow): 30,480, +50%
- Accommodation and food services (gray): 25,540, +66%
- Health Care and Social Assistance (brown): 24,674, +33%
US farmers celebrate as corn exports near records. – Reuters reports US corn exports “have blown past nearly every benchmark” as China, the world’s largest food and ag importer, appears to be ramping up purchases of US farm goods. What’s mildly funny is how China has begun to purchase large amounts of farm goods from the US under the Biden administration. According to official US export data Wednesday, February’s corn exports recorded 6.3 million tons. The amount topped “2008’s record for the month by 17% and is the largest monthly volume since July 2018,” said Reuters. A few months back, December’s corn exports exploded to 13-year highs. The first-quarter outlook already suggests record volumes. Reuters’ projections indicate weekly export data for March could reach an all-time high, possibly topping north of 9 million tons. The largest-ever export volume for a given month was 7.75 tons in May 2018. China has primarily driven strong US corn exports. By Mar. 25, Beijing booked around 23.2 million tons of US corn for the 2020/21 year. The previous high for US corn exports to China was 5.15 million in 2011/12.In January, we first noted that China customs data showed that grain imports soared to record highs in 2020 after tight domestic corn supplies pushed prices to multi-year peaks, driving demand for cheaper imports.The USDA forecasted 2020/2021 corn exports at a record 66 million tons, and there’s a chance in the upcoming growing season, the number could be much higher due to China’s increasing demand. This is happening as corn prices have nearly doubled since August.
LA Area Port Traffic: Strong Imports in March — Note: Import traffic was heavy in February and March – ships were backed up waiting to unload in LA. “some vessels are spending almost as much time at anchor as it takes to traverse the Pacific Ocean.” They are still backed up in April! Container traffic gives us an idea about the volume of goods being exported and imported – and usually some hints about the trade report since LA area ports handle about 40% of the nation’s container port traffic. The following graphs are for inbound and outbound traffic at the ports of Los Angeles and Long Beach in TEUs (TEUs: 20-foot equivalent units or 20-foot-long cargo container). To remove the strong seasonal component for inbound traffic, the first graph shows the rolling 12 month average. On a rolling 12 month basis, inbound traffic was up 4.8% in March compared to the rolling 12 months ending in February. Outbound traffic was down 0.1% compared to the rolling 12 months ending the previous month. The 2nd graph is the monthly data (with a strong seasonal pattern for imports). Usually imports peak in the July to October period as retailers import goods for the Christmas holiday, and then decline sharply and bottom in February or March depending on the timing of the Chinese New Year. 2021 has started off incredibly strong for imports. Imports were up 98% YoY in March (collapsed early last year due to pandemic), and exports were down 1.5% YoY.
Industrial Production Increased 1.4 Percent in March -From the Fed: Industrial Production and Capacity Utilization -In March, total industrial production increased 1.4 percent. The gain in March followed a drop of 2.6 percent in February, which largely resulted from widespread outages related to severe winter weather in the south central region of the country. For the first quarter as a whole, total industrial production rose 2.5 percent at an annual rate. In March, manufacturing production and mining output increased 2.7 percent and 5.7 percent, respectively. The output of utilities dropped 11.4 percent, as the demand for heating fell because of a swing in temperatures from an unseasonably cold February to an unseasonably warm March.At 105.6 percent of its 2012 average, total industrial production in March was 1.0 percent higher than its year-earlier level, but it was 3.4 percent below its pre-pandemic (February 2020) level. Capacity utilization for the industrial sector increased 1.0 percentage point in March to 74.4 percent, a rate that is 5.2 percentage points below its long-run (1972 – 2020) average. This graph shows Capacity Utilization. This series is up from the record low set in April, but still below the level in February 2020.Capacity utilization at 74.4% is 5.2% below the average from 1972 to 2020.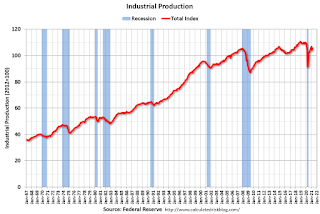 The second graph shows industrial production since 1967.Industrial production increased in March to 105.6. This is 3.4% below the February 2020 level.The change in industrial production was below consensus expectations.
Empire State Mfg Survey: Strong Growth in April -This morning we got the latest Empire State Manufacturing Survey. The diffusion index for General Business Conditions at 26.3 was an increase of 8.9 from the previous month’s 17.4. The Investing.com forecast was for a reading of 19.5.The Empire State Manufacturing Index rates the relative level of general business conditions in New York state. A level above 0.0 indicates improving conditions, below indicates worsening conditions. The reading is compiled from a survey of about 200 manufacturers in New York state.Here is the opening paragraph from the report.Business activity grew strongly in New York State, according to firms responding to the April 2021 Empire State Manufacturing Survey. The headline general business conditions index climbed nine points to 26.3, a multi-year high. New orders and shipments grew at a solid clip, and unfilled orders increased. Delivery times were the longest on record, and inventories were notably higher. Employment levels and the average workweek both expanded modestly. Input prices rose at the fastest pace since 2008, and selling prices climbed at a record-setting pace. Looking ahead, firms remained optimistic that conditions would improve over the next six months, expecting significant increases in employment and prices. [full report] Here is a chart of the current conditions and its 3-month moving average, which helps clarify the trend for this extremely volatile indicator:
Philly Fed Mfg Index: Strongest in Almost 50 Years -The Philly Fed’s Manufacturing Business Outlook Survey is a monthly report for the Third Federal Reserve District, covers eastern Pennsylvania, southern New Jersey, and Delaware. While it focuses exclusively on business in this district, this regional survey gives a generally reliable clue as to the direction of the broader Chicago Fed’s National Activity Index.The latest Manufacturing Index came in at 50.2, up 7.5 from last month’s 44.5. The 3-month moving average came in at 41.1, up from 38.4 last month. Since this is a diffusion index, negative readings indicate contraction, positive ones indicate expansion. The Six-Month Outlook came in at 66.6, up 7.5 from the previous month’s 59.1. The 50.2 headline number came in above the 42 forecast at Investing.com. Here is the introduction from the survey: Manufacturing conditions in the region strengthened further this month, according to firms responding to the March Manufacturing Business Outlook Survey. The indicators for general activity and new orders rose sharply, and the shipments and employment indexes also increased. Price pressures also rose, according to the surveyed firms. All of the survey’s indexes for future conditions increased, as the firms indicated more widespread optimism about growth over the next six months. (Full Report) The first chart below gives us a look at this diffusion index since 2000, which shows us how it has behaved in proximity to the two 21st century recessions. The red dots show the indicator itself, which is quite noisy, and the 3-month moving average, which is more useful as an indicator of coincident economic activity. We can see periods of contraction in 2011, 2012, and 2015, and a shallower contraction in 2013. The contraction due to COVID-19 is clear in 2020.
Weekly Initial Unemployment Claims decreased sharply to 576,000 – The DOL reported: In the week ending April 10, the advance figure for seasonally adjusted initial claims was 576,000, a decrease of 193,000 from the previous week’s revised level. This is the lowest level for initial claims since March 14, 2020 when it was 256,000. The previous week’s level was revised up by 25,000 from 744,000 to 769,000. The 4-week moving average was 683,000, a decrease of 47,250 from the previous week’s revised average. This is the lowest level for this average since March 14, 2020 when it was 225,500. The previous week’s average was revised up by 6,500 from 723,750 to 730,250. This does not include the 131,975 initial claims for Pandemic Unemployment Assistance (PUA) that was down from 152,419 the previous week. The following graph shows the 4-week moving average of weekly claims since 1971. The dashed line on the graph is the current 4-week average. The four-week average of weekly unemployment claims decreased to 683,000.The previous week was revised up.Regular state continued claims increased to 3,731,000 (SA) from 3,727,000 (SA) the previous week.Note: There are an additional 7,053,575 receiving Pandemic Unemployment Assistance (PUA) that decreased from 7,554,290 the previous week (there are questions about these numbers). This is a special program for business owners, self-employed, independent contractors or gig workers not receiving other unemployment insurance. And an additional 5,160,267 receiving Pandemic Emergency Unemployment Compensation (PEUC) down from 5,634,967. Weekly claims were much lower than the consensus forecast.
Uber reports rides are skyrocketing as people get vaccinated – Uber said Monday that it recorded its highest monthly gross bookings in company history in March from Uber and Uber Eats as more Americans got vaccinated. The company’s ride hailing business had its best month since March 2020 with an annualized run rate of $30 billion, up 9 percent from the month prior. At the same time, Uber’s food delivery business reached an annual run rate of $52 billion in March. Combined, it created the most bookings in company history. “As vaccination rates increase in the United States, we are observing that consumer demand for Mobility is recovering faster than driver availability, and consumer demand for Delivery continues to exceed courier availability,” Uber said in a filing with the Securities and Exchange Commission. The company announced last week that it will spend $250 million trying to entice drivers to get back on the road to meet the spike in demand. Uber claimed in Monday’s filing that it is on track to reach profitability in quarterly adjusted earnings by the end of this year. The company lost nearly $6.8 billion lost year.
Why Work at Home Is Not Likely to Thrive After the Covid Era – Yves Smith – Many white collar workers seem to be enthusiastic about the work from home trend, now freed of time-eating commutes, office politics, and hovering bosses. It’s hardly a secret that Covid-induced fear of commuter trains, busses and elevators has led CEOs to revamp operations and allow employees who can to work remotely. It has already radically reshaped the residential real estate market, with professionals who have extra cash hoovering up houses in exurbs or other states with lower costs of living but reasonable amenities. But is this shift a lasting development? Remote work is hardly a new concept, as outsourcing and offshoring of lots of tasks, such as coding, call centers, and legal research attests. Despite the press and broker enthusiasm for this shift, it’s likely to wind up being rolled back significantly post-Covid. Some of the reasons why: CEOs overwhelmingly dislike work from home. A Wall Street Journal survey late last year found that by more than a 2:1 margin, CEOs thought the costs and risks of working from home outweighed the benefit. And the minority camp consisted of CEOs who said they’d made it work, or were willing to have work at home continue post-Covid on a limited basis. Illustrative quotes:
- “There’s sort of an emerging sense behind the scenes of executives saying, ‘This is not going to be sustainable.'” – Laszlo Bock, chief executive of human-resources startup Humu and former HR chief at Google
- “I don’t see any positives. Not being able to get together in person, particularly internationally, is a pure negative.” – Reed Hastings, co-chief executive of Netflix Inc., on working from home
- “We tried it … It’s just not the same. You just cannot get the same quality of work.” – Rajat Bhageria, CEO of robotics startup Chef Robotics, on what the company learned in attempting to work remotely
The overwhelming majority of academic studies on work from home have found those employees are less productive. The only exception was one in the US from the employees themselves, who have incentives to score themselves well if they enjoy their new freedom.1 But their perception isn’t the one that counts. It’s that of the higher ups.”Productive” isn’t just the worker’s perception that he is executing his tasks more efficiently at home; his bosses and co-workers may incur frictions in defining his tasks, coordinating them, and reviewing his output that can considerably or more than offset any perceived increase of his efficiency in isolation. A survey of small and medium-sized US firms found that working from home reduced productivity by 20% on average; a Japanese study found a decline of 30% to 40%. Some of the reasons why:
Hawaii to roll out ‘vaccine passport’ program by summer – Hawaii Gov. David Ige (D) on Friday approved a “vaccine passport” program for inter-island travel that could begin as early as May and expand to out-of-state travel by the summer, Forbes reports. The outlet reports Hawaii is working with the developers of multiple apps including Clear, CommonPass and FirstVitals to help with their pre-flight vaccination verification program. This requirement can be avoided if an individual provides a negative COVID-19 test with 72 hours of departure. The vaccine passport program is seen by tourism officials as a way to speed up the state’s recovery, Forbes notes. “Businesses have lost a lot of money during this whole period here so there’s a lot to recoup,” president and CEO of the Hawaii Tourism and Lodging Association, Mufi Hannemann, told local media. The idea of vaccine passports has become a hot-button issue for many politicians, with critics calling them discriminatory or privacy violations. Multiple GOP-led states such as Florida, Texas and Idaho have banned the use of vaccine passports, either only by the state or by private businesses as well. The Biden administration has so far said it will not enact a federal vaccine mandate nor will it maintain a federal database on vaccine status. However, Forbes notes that many private businesses such as cruise lines and concert venues have created vaccine verification systems of their own in an effort to reopen. New York became the first U.S. state to launch a vaccine passport program when it launched the Excelsior Pass in late March. The pass can be used at entertainment venues and will allow for larger crowd sizes at concerts and weddings.
Meatpacking plants increased COVID-19 cases in US counties – An estimated 334,000 COVID-19 cases are attributable to meatpacking plants, resulting in $11.2 billion in economic damage, according to a new study led by a researcher at the University of California, Davis. The study was published in the journal Food Policy. It found that beef- and pork-processing plants more than doubled per capita infection rates in counties that had them. Chicken-processing plants increased transmission rates by 20 percent. The study looked specifically at large meatpacking plants generating more than 10 million pounds per month. Researchers said both the economic impact and infection rate estimate is conservative. The study looked at infection rates within a county and did not account for cases that might have been contracted at a meatpacking plant but spread to other counties. “Similarly, our study likely understates true economic losses,” The study looked at lost wages and mortality and did not include long-term health care costs, or costs for measures put in place to protect worker safety. “While we did see an initial ramp up in cases attributable to meatpacking facilities, over time infection rates were the same per capita as counties without them, partly because meatpacking plants implemented a lot of protocols to protect employees,” said Saitone. A variety of factors can drive county-level COVID-19 transmission rates. Saitone said the research controlled for those potential drivers, such as the number of nursing homes or correctional facilities in a county. It also considered stay-at-home orders and other regulations, population density, demographics, economic factors and health characteristics. The study looked at infections within 150 days after the first documented COVID-19 case in each county. Increased COVID-19 transmission rates have prompted some critics to call for a smaller, more geographically dispersed industry to make it less susceptible to a pandemic and massive disruptions in the food supply chain. Researchers caution that such a move would come at a price, adding costs to a system designed to eliminate them and ultimately increasing food prices. Economists instead suggest research and investigation into the automation and technological innovations that made the poultry segment of the industry more resilient to the COVID-19 pandemic.
Experts baffled by spike in Utah livestock shootings during pandemic — Utah has recorded a spike in livestock shootings during the COVID-19 pandemic, according to a report by The Salt Lake Tribune. Utah rancher Eric Lyman told the outlet that he lost two cows and three calves to shootings in the summer of 2020. He never learned who was behind the shootings. “The frustrating part is that somebody would take a gun and shoot something that’s just standing there looking at them,” Lyman told The Salt Lake Tribune. “For no rhyme or reason.” Leann Hunting, director of animal industry at the Utah Department of Agriculture, told the paper that there were nearly 50 such killings in the state in 2020. In a normal year, she said, Utah would only see one or two. It’s unclear why the killings are happening, though Hunting wondered that if the pandemic-driven meat shortage could be a cause for some of the shootings. “To graph it, it is just an enormous spike,” Hunting said. Livestock shootings are a big loss financially for ranchers. “They act like it’s just one cow, but that one cow has potential of probably raising 15 calves if she was a young cow,” Tracy Hatch, president of the Utah Cattlemen’s Association, told the Tribune. “So you start doing the math on that: $800 a head times 15, you’re looking at $12,000 just because of one animal.”
Pricey Learning Pods Are Now Helping Vulnerable Students. Will the Trend Survive the Pandemic? – Like many New York City charter schools, Brooklyn’s Ascend network started off the year fully remote. But just a few months in, it became clear: Remote learning wasn’t working for certain students. Attendance dipped, and teachers struggled to reach students at the network’s K-12 schools. Many of the children come from some of the poorest neighborhoods in Central Brooklyn, and some live in vulnerable housing situations. They needed a safe, supervised place for effective virtual schooling. “We have students in transitional home situations, and we have students who really needed an optimal learning space,” School leaders heard the feedback from teachers like Etienne, and by November decided to change tracks.They transformed some of their Brownsville classrooms into learning pods – making space on campus for small groups of students to attend virtual school with the help of a learning proctor or “pod leader” who supported them throughout the school day. Some teachers volunteered to be pod leaders. Others were led by furloughed school food service workers, as well as paraprofessionals, who were hired and trained by an outside agency. Roughly 380 of the network’s 5,000 students had enrolled in 15 learning pods across its Brooklyn campuses, as of March. From the start, learning pods raised questions around equity. Small private pods, many gathering in homes, began popping up across the country, with some as pricey as$13,000 per semester. These kinds of pods often excluded lower-income families, and didn’t always feel inclusive to families of children with disabilities who might need special support. Many education observers worried that these self-created groups would widen already existing educational disparities in a year defined by disrupted, and often, less instructional time for most children.A handful of groups like are looking for ways to make pods more equitable, such as the Center on Reinventing Public Education, which is tracking and researching pods run by schools or community organizations across the country.The Seattle-based group, which has received funding from the Bill & Melinda Gates Foundation, says it sees “public education as a goal, not as a set of fixed institutions.” (The Bill & Melinda Gate Foundation is also a Chalkbeat funder.)According to a database assembled by the organization,there are at least 330 district and community-supported learning pods, based on national media searches and referrals. The database has identified 14 pods in New York State, six of which are in New York City – including the citywide Learning Bridges child care program, run by the Department of Education. Though the data is limited by publicly available information, it offers a snapshot of how learning pods are becoming more popular among school districts and in nonschool spaces such as churches, recreation centers and non-profit organizations across the country.
As pandemic surges in Michigan, Governor Whitmer refuses to close schools – COVID-19 has spiraled out of control in the state of Michigan, which is leading the United States into yet another surge of the pandemic. Immediate action is required to save thousands of lives over the coming weeks, and workers around the world must also study the situation here and learn the political lessons in order to avert similar catastrophes everywhere. Michigan’s seven-day moving average of daily new cases has now even surpassed the peak of the fall/winter surge, reaching its highest level ever, 7,602 new cases reported per day, on Friday, April 9. The state’s test positivity rate is now 16 percent, the highest in the US mainland, and its daily case rate of 70.2 per 100,000 people is far higher than the second highest rate, 43.0, in New Jersey. The new surge in Michigan is being fueled by the B.1.1.7 variant, which is 50 to 75 percent more contagious than the original strain and disproportionately affects young people. B.1.1.7 is now the dominant variant circulating in the United States. In Michigan, it accounts for an estimated 70 percent of new cases, which some doctors have characterized as a “new pandemic.” Michigan’s rate has increased by a factor of seven since bottoming out at around 1,100 new cases per day in mid-February. Throughout this period, the number one vector for transmission by far was K-12 school buildings, which are open for face-to-face learning on a district-by-district basis across the state. This is according to the Michigan Department of Health and Human Services’ own figures. In fact, the rise in school-related outbreaks preceded the rise in cases statewide, showing that schools are actually driving the pandemic and not simply reflecting it. After the virus spread rapidly through school buildings, the infected teachers, students and workers brought it home to their families and into their communities. Hundreds more outbreaks also took place at school sporting events. Together, schools, sports and day cares have been the source of 40 percent of the state’s total recorded outbreaks during the new surge. The next most likely places to catch COVID-19 were factories and construction sites, followed by nursing homes, retail businesses and office settings. Hospitals are again filling up, as they did last spring and fall, but this time the largest rise in COVID-19 hospitalizations took place among those aged 19 and under. By last Wednesday, hospitals across the state had already started canceling surgeries and implementing “surge protocols” to make room for rising numbers of COVID-19 patients. Over the weekend, non-COVID-19 patients of all kinds waited for hours as Detroit’s emergency rooms were overwhelmed by the surge. Under these conditions, Governor Gretchen Whitmer and her medical adviser held an astonishing press conference on Friday morning in which they reviewed this catastrophic situation in great detail, presented the numbers using charts and graphs, and then proceeded to announce that there would be no change in policy in Michigan – no new restrictions or lockdowns of any kind.
Ontario shuts down in-person classes as COVID-19 cases surge –The government of the Canadian province of Ontario on Monday announced that all schools will pivot to remote learning after spring break, following record highs of COVID-19 cases and hospitalizations.”We are seeing a rapidly deteriorating situation with a record number of COVID cases and hospital admissions threatening to overwhelm our health care system,” Ontario Premier Doug Ford said in a statement. “As I have always said we will do whatever it takes to ensure everyone stays safe. By keeping kids home longer after spring break we will limit community transmission, take pressure off our hospitals and allow more time to rollout our COVID-19 vaccine plan,” he continued. The statement said that the move is in response to the rise in COVID-19 cases, the increasing risk posed by coronavirus variants and the “massive spike” in hospital admissions. Officials said that while schools have been “safe places for learning” throughout the pandemic and have “demonstrated low rates of in-school transmission” with proper measures in place, the move is necessary because “increasing rates of community spread pose a threat to the health and safety of school communities.” All publicly funded and private elementary and secondary schools in the province will transition to teacher-led remote learning when students return from break on April 19. Officials ordered private schools holding instruction this week to pivot to remote learning by Thursday. According to the statement, the number of coronavirus hospitalizations in the province has increased by 22.1 percent between April 4 and Saturday. In that same period, the number of COVID-19 patients in intensive care has also increased from 494 to 605. “This was not a decision we made lightly, as we know how critical schools are to Ontario students. Our priority has always been to keep schools open, however sharply rising community transmission can put our schools and Ontario families at risk,” Ontario Minister of Education Stephen Lecce said in a statement.
Colorado high school lays off all teachers, tells them to reapply for their own jobs – Dozens of teachers at Mitchell High School in Colorado Springs, CO, a city of just over 460,000 on the eastern foot of the Rocky Mountains, were informed in January by the District 11 Board of Education that they will be laid off at the end of the school year and forced to re-apply for their jobs. In response, the union which claims to represent educators, the Colorado Springs Education Association (CSEA), has simply told its membership to look for new jobs in nearby districts, as no timeline has been given for the reposting of the Mitchell High School positions. School officials maintain that they have the right to carry out the mass firing because they must “implement comprehensive changes” that will address the fact that students have been performing poorly on standardized tests for four years and the school has been placed on “performance watch.” An additional pretext for the firings stems from alleged concerns over low participation among Mitchell High School students for the SAT, an unmandated, non-state exam for college admissions that institutions of higher education are increasingly waiving as an entrance requirement. Because state-required standardized exams have been suspended across Colorado due to the COVID-19 pandemic, the city’s school board is seizing upon the SAT participation rate to carry out its attack. While many districts and states use tests like the SAT as a supplement to other methods of evaluating students, it is widely known that results are highly linked to students’ socioeconomic background because the exam can only be mastered through expensive private tutoring programs or academic coaches. Mitchell High School serves a low-income, highly transient population. A third of its students come from Spanish-speaking homes, and one in every five is enrolled in English-language-learning classes. Many students are either undocumented or moving in and out of the district as their parents follow seasonal and itinerant work opportunities. Both in terms of participation and performance, this student body is destined to “fail” compared to those from wealthier and more stable backgrounds. The effect of the mass teacher layoffs – which will cause many highly-skilled veteran educators to find work elsewhere – will be to intensify the feeling of vulnerability and crisis already plaguing young people as a result of the pandemic, which has infected more than 480,000 and killed 6,210 in the surrounding county. The teacher turnover rate – already high because of the difficult conditions at Mitchell High School – will rise further, deepening the educational crisis facing these students.
Forgiving $50K in school loans would free 36 million student borrowers from debt: data – More than 36 million people would be freed from debt if the Biden administration cancels $50,000 in student debt per borrower, according to data put out Tuesday from the Education Department. Sen. Elizabeth Warren (D-Mass.), a vocal proponent of the cancellation proposal being pushed by progressives, released the data after requesting answers from the Education Department earlier this month. The 36 million borrowers who would have their debt completely forgiven account for 45 million federal student loan borrowers overall. The data also shows that 9.8 million federal student loan borrowers who were in default or more than three months behind on their debt at the end of 2019 would have their debt forgiven. That’s almost all of the 10.3 million federal student loan borrowers who were in that position. Warren’s release of the data marks the latest salvo in progressives’ push to convince President Biden to take unilateral action to scrap $50,000 in student debt per borrower. Biden has set his sights lower, saying he might target $10,000 in debt while still questioning his legal authority to cancel the debt by executive action. Should the president forgive that amount of loans, 15 million borrowers would completely have their debt forgiven, including 4.6 million people who were in default or delinquent at the end of 2019. “I do think in this moment of economic pain and strain that we should be eliminating interest on the debts that are accumulated, No. 1. And No. 2, I’m prepared to write off the $10,000 debt,” Biden said in February. White House chief of staff Ron Klain said earlier this month that Biden had requested information from Education Secretary Miguel Cardona regarding his legal authority to cancel student loan debt. “He hasn’t made a decision on that either way. In fact, he hasn’t yet gotten the memos that he needs to start to focus on that decision,” Klain said.
France Moves to Ban Short-Haul Flights –France moved one step closer this weekend to banning short-haul flights in an attempt to fight the climate crisis.A bill prohibiting regional flights that could be replaced with an existing train journey of less than two and a half hours passed the country’s National Assembly late on Saturday, as Reuters reported.”We know that aviation is a contributor of carbon dioxide and that because of climate change we must reduce emissions,” Industry Minister Agnes Pannier-Runacher told Europe 1 radio, according to Reuters.The measure now has to pass the French Senate, then return to the lower house for a final vote. It would end regional flights between Paris’s Orly airport and cities like Nantes and Bordeaux, The Guardian explained. It would not, however, impact connecting flights through Paris’s Charles de Gaulle/Roissy airport.The bill is part of a legislative package which aims to reduce France’s emissions by 40 percent of 1990 levels by 2030, Reuters reported. It is a watered-down version of a proposal suggested by France’s Citizens’ Convention on Climate, BBC News explained. This group, which was formed by President Emmanuel Macron in 2019 and included 150 ordinary citizens, had put forward a ban on flights that could be replaced with an existing train journey of under four hours.However, the journey length was lowered after protests from KLM-Air France, which had suffered heavy losses due to the coronavirus pandemic, and regions who were concerned about being left out of national transit networks, as The Guardian explained.”We have chosen two and a half hours because four hours risks isolating landlocked territories including the greater Massif Central, which would be iniquitous,” transport minister Jean-Baptiste Djebbari said, as The Guardian reported.However, some environmental and consumer groups objected to the changes. The organization UFC-Que Choisir compared plane routes with equivalent train journeys of under four hours and found that the plane trips emitted an average of 77 times more carbon dioxide per passenger than the train journeys. At the same time, the train alternatives were cheaper and only as much as 40 minutes longer.”[T]he government’s choice actually aims to empty the measure of its substance,” the group said, according to The Guardian. The new measure also opens the French government to charges of hypocrisy. It bailed out Air France-KLM to the tune of a seven-billion euro loan last year, though it did require the airline to drop some domestic routes as a condition. Then, days before the measure passed, it more than doubled its stake in the airline, BBC News reported. However, Pannier-Runacher insisted to Europe 1 radio that it was possible to balance fighting climate change and supporting struggling businesses.
German Cabinet Approves Uniform COVID Measures Nationwide – On Tuesday, cabinet members approved legal changes to grant the federal government more power to enforce coronavirus regulations in German states.The changes to the German Infection Protection Act must now be passed in the parliament, the Bundestag.If approved, the new “federal emergency brake” means that any region in any state with a high incidence of COVID-19 cases would be legally required to implement a uniform set of rules set out by the federal government.The government, led by Chancellor Angela Merkel’s Christian Democrats (CDU), wants to fast-track approval. However, the timeline for enacting the new regulations remains unclear. “Let’s finish it this week,” Ralph Brinkhaus, CDU parliamentary leader, said in the German media on Monday. “The situation is serious and we also have to take it seriously,” Merkel told a press conference Tuesday.”The third wave of the pandemic has a tight grip” on Germany, Merkel said, adding that the current system of regulations decided between the federal government and states is not enough to to stop the third wave.”We must not ignore the cries for help from the medical profession. They need us,” Merkel said. “Our fight against the pandemic needs to be stricter and more resolute,” she added. “The nationwide emergency brake is long overdue,” said Merkel, while emphasizing that Germany is “approaching the light at the end of the tunnel.”Restrictions would be enforced in a district or city where the seven-day incidence rate of new COVID cases crosses 100 per 100,000 population for at least three consecutive days. When the incidence rate drops below this level for three consecutive days, the restrictions will be lifted. Gatherings of people from different households will be limited. Contact with one person outside of the household is permitted, with a maximum of five people being allowed together. Retail stores, including hardware stores, must close. Supermarkets and drug stores may remain open. Theaters, museums, zoos, public pools and gyms must remain closed. Restaurants are limited to takeout, and touristic travel in hotels is not allowed.
.
include(“/home/aleta/public_html/files/ad_openx.htm”); ?>


