by Zillow
It has taken three long years to cut the U.S. negative equity rate roughly in half since its peak in Q1 2012. But the real hard work is just beginning, because it will likely take many more years to whittle down the next half.

Overview
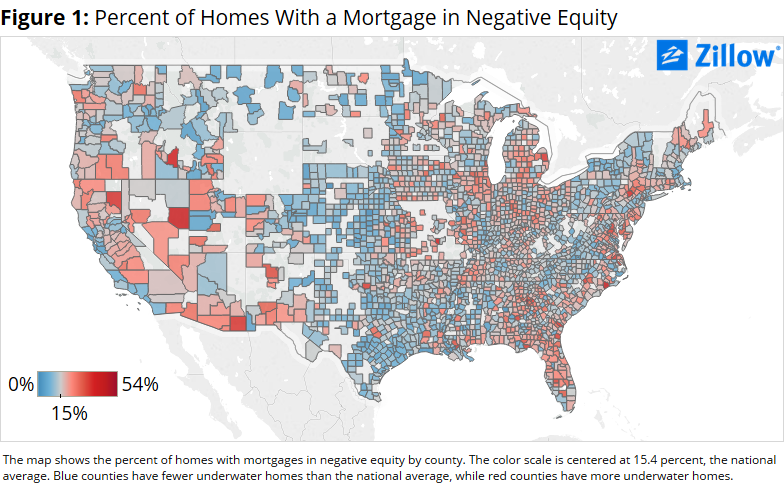
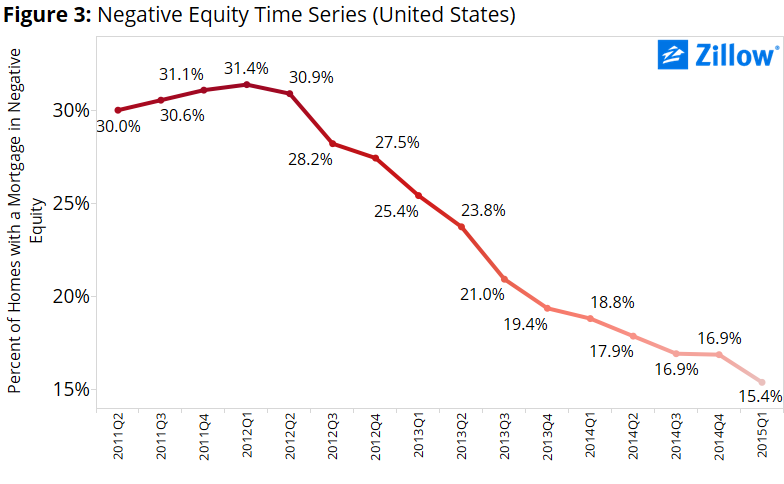
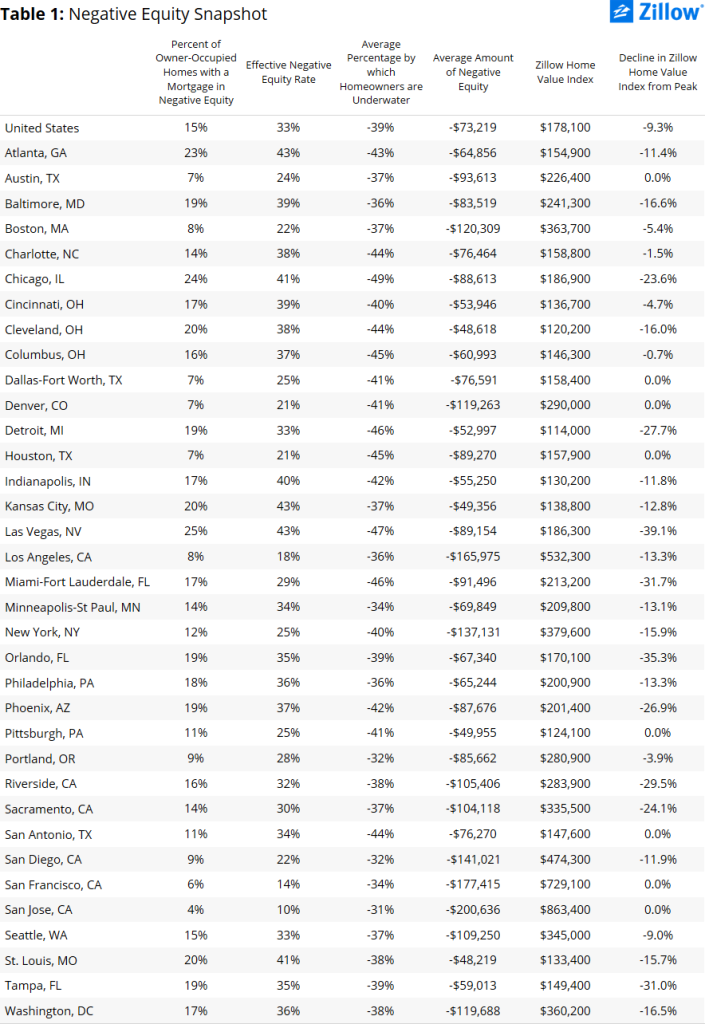
After a brief pause at the end of 2014, the national negative equity rate resumed its decline in the first quarter of 2015, falling to 15.4 percent in Q1 from 16.9 percent in Q4 2014 (figure 1). To date, almost 8 million mortgaged homeowners have been freed from negative equity since its peak.
But 7.9 million Americans remain underwater, with more than half of them (51.9 percent) underwater by more than 20 percent. And as the pace of home value growth fades, so too do hopes for a speedy re-surfacing among those deeply underwater homeowners.
The Zillow Home Value Forecast predicts U.S. home values will grow by just 2 percent through April 2016, well below recent annual growth rates above 8 percent just a year ago. Looking farther ahead, more than 100 economists and experts surveyed in the latest Zillow Home Price Expectations Survey said they expect home values to grow, on average, by a cumulative 19.2 percent through 2019. For the more than 4 million homeowners underwater by more than 20 percent, simply waiting for home values to rise enough to lift them into positive equity will require tremendous patience. It will likely take through the end of this decade, at least, for them to get back to even.
But at least those homeowners near the 20 percent underwater line may see some light at the end of the tunnel, however faint. For the 11.8 percent (roughly 930,000) of underwater homeowners who owe more than double their home’s value to the bank, there is virtually no hope that home value appreciation alone will clear them of negative equity. And the only other ways to clear negative equity from the books – foreclosure or short sale – are perhaps more unpleasant to consider than being in negative equity itself.
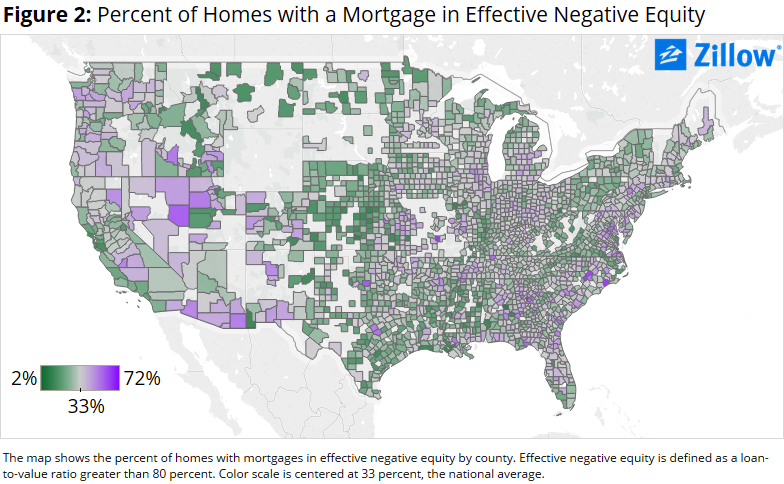
Of course, reaching positive equity – even barely – isn’t the end of the battle. Realistically, a homeowner needs roughly 20 percent equity in their home to afford the taxes and fees associated with listing and selling it and still have enough left over to afford a reasonable down payment on another home. When including these homeowners with less than 20 percent equity in their home, the national “effective” negative equity rate is 33 percent (figure 2). Put another way, a third of all homeowners with a mortgage don’t have enough equity to list their home for sale and buy another.
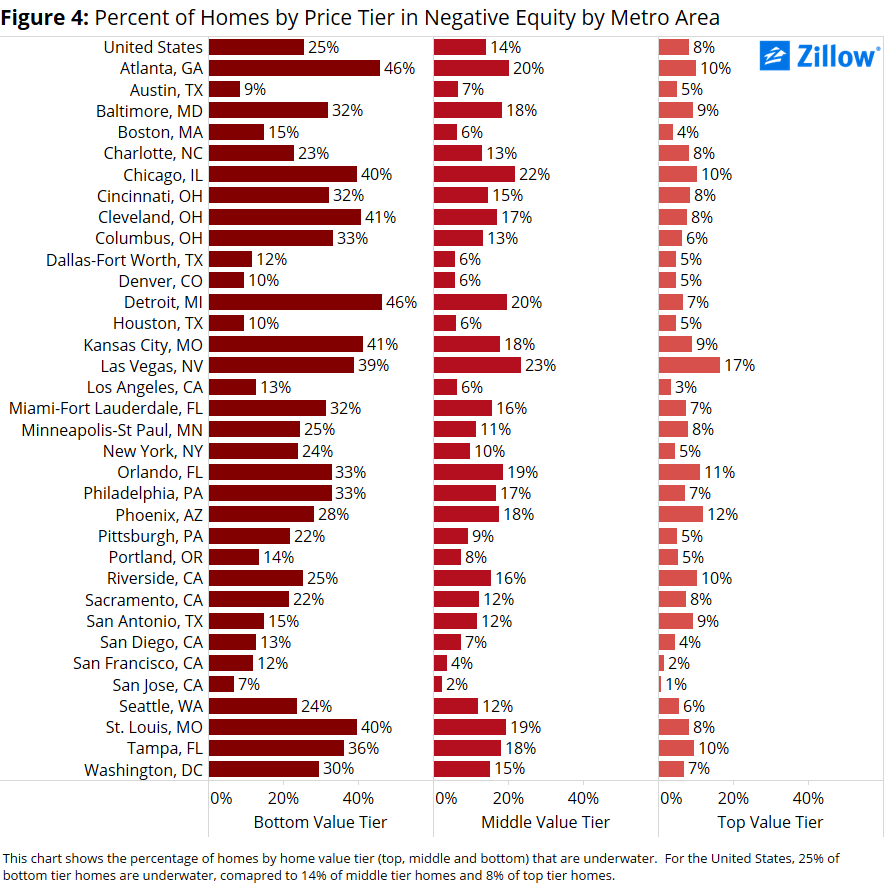
To top it all off, negative equity is not equally distributed. Homes valued in the bottom one-third of all homes are three times more likely to be underwater as homes in the top third. The negative equity rate among bottom-tier homes is 25 percent, compared to 8 percent among top-tier homes.
And this logjam at the bottom is having ripple effects throughout the entire housing market.
Potential first-time buyers are having difficulty finding affordable homes for sale because those homes are stuck in negative equity. In part, this keeps these younger potential buyers renting for longer, contributing to the persistently high rental demand that keeps pushing rents up nationwide, adding to a growing rental affordability crisis.
And owners of those more affordable homes can’t move up the chain, either, because they’re stuck underwater in the entry-level home they bought years ago. This contributes to lackluster demand for middle- and upper-tier homes, and weak sales volumes all around. At the same time, competition is fierce for those homes that are available, particularly at the lower end, which helps contribute to price volatility.
We’ve come a long way. Sadly, for millions of American homeowners, there’s still a very long way to go.
Fits & Starts
Since peaking in Q1 2012 at 31.4 percent, the U.S. negative equity rate fell consistently for 10 straight quarters, before stalling in Q4 2014. The negative equity rate was flat at 16.9 percent in both Q3 2014 and Q4, before falling again in Q1 to its current rate of 15.4 percent (figure 3).
Slightly stronger quarter-over-quarter home value growth between Q4 2014 and Q1 2015 likely helped re-start the decline in the negative equity rate. Between Q3 and Q4 of last year, home values grew just 0.51 percent, compared to 0.74 percent quarter-over-quarter growth between the end of Q4 2014 and the end of Q1 2015.
Still, that quarterly growth rate is anemic compared to fairly consistent quarterly growth of 2 percent or more from mid-2013 and into the early part of 2014. It’s unlikely that the national negative equity rate will rise going forward, but as home value growth continues to slow, it is more likely to fall in fits and starts, and not as uniformly as it did between 2012 and 2014. The Zillow Negative Equity Forecast predicts the U.S. negative equity rate will fall to 14.1 percent by the end of Q1 2016.
Location, Location, Location
Negative equity is not only unequally distributed by home value, it’s also unequally concentrated in certain areas of the country. In the red-hot Bay Area, for instance, negative equity is the lowest in the country. In the San Francisco metro, the negative equity rate was 6.1 percent in Q1, the second-lowest negative equity rate among the top 35 largest metros, behind only the San Jose metro at 3.8 percent.
But other parts of the country, particularly the Midwest, are still struggling with negative equity rates well above the national average. Among the largest 35 metros, three of the five with the highest negative equity rates (Chicago, 23.7 percent; St. Louis, 20.4 percent; and Cleveland, 19.9 percent) were in the Midwest.
Additionally, the discrepancies between negative equity among top- and bottom-tier homeowners in different markets can be very striking. For example, 46 percent of bottom-tier homeowners in Detroit are underwater, compared to 7 percent of top-tier owners. In Atlanta, 46 percent of bottom-tier owners in Atlanta are underwater, compared to only 10 percent of owners in the top tier (figure 4).
Still, while the level of negative equity varies dramatically from market-to-market, it is at least falling uniformly again. Between Q4 and Q1 2015, negative equity fell in all 35 of the country’s largest markets. Between Q3 and Q4 2014, negative equity rose or was flat in 12 of those 35.
A Deep Problem
As noted above, 11.8 percent of homeowners in negative equity nationwide owe more than twice what their home is worth to the bank. But again, that number varies dramatically from market to market, and in many, the rate of very deep negative equity is much higher, upwards of 15 percent or more (figure 5).
Of the largest 35 metro areas, San Antonio (16.2 percent), Charlotte (15.6 percent), Detroit (15.6 percent) and Chicago (15.4 percent) have the highest rates of underwater homeowners owing more than twice their home’s value to the bank.
But all is not lost. Just 10.4 percent of underwater homeowners in Riverside, Calif., once the poster child for negative equity and falling home values, owe more than twice their home’s value to the bank, below the national average.
Outlook
While it’s undoubtedly great news that the level of negative equity is falling, the depth of negative equity remains incredibly worrisome. Millions of Americans are so far underwater, it’s likely they may not regain equity for up to a decade or more at this pace. And because negative equity is concentrated so heavily at the lower end, it gums up the works for the rest of the market.
Potential first-time buyers will have difficulty finding affordable homes for sale because those homes are stuck in negative equity. And owners of those homes can’t move up the chain because they’re stuck underwater in the entry-level home they bought years ago. The logjam at the bottom is having ripple effects throughout the market, and as home value growth slows, it will be years before it gets cleared up.
In the meantime, we’ll be left with volatile prices, limited inventory, tepid demand, elevated foreclosures and a whole lot of frustration.
About the author
Svenja Gudell is the Senior Director of Economic Research at Zillow. To learn more about Svenja, click here.


