
Written by Gary
Closing Market Commentary For 01-13-2015
Markets dropped 400 points from today’s highs marking one of the largest market swings since October, 2014.
By 4 pm the averages were in the red, recovering fractionally from the session lows even though WTI oil climbed back up to yesterday’s highs (and resistance) which should have pushed the averages back up. Tomorrow’s market casino is going to be interesting.

The long-term upward trend has not been broken but there some that are calling for a ‘correction’ that has some meat to it. But until then, the trend is your friend. Even with oil falling as far as it has, we are close to a bottom I think, if $40 is to believed. That bottom action should release the pent up energy being stored by reluctant investors and send the markets much higher.
At this point I see no recession in the next 12 months, the U.S. Financial’s are tattered, but not failing and the ‘Grexit’ most likely will not happen. The EU is still in shambles of sorts, depending where you look, and unless someone starts a war we should see some more upside.
However, if WTI oil drops into the 30’s all bets are off. My personal trading is going to hold until the uptrend is broken. The last correction fell ~8% BELOW the trend line and yet recovered and climbed to new historic highs. Normally, that would be considered a breakout and a serious sell signal – but it wasn’t, so be careful on the next ‘dip’.
World Bank lowers outlook for global economic growth
The World Bank cut its outlook for global growth Tuesday, saying a strengthening U.S. economy and plummeting oil prices won’t be enough to offset deepening trouble in the eurozone and emerging markets.
The Washington-based development institution expects the global economy to expand 3% this year, up from 2.6% in 2014, but still slower than its earlier 2015 forecast of 3.4%.
The bank’s economists see oil prices, which have lost more than half their value in the last six months, providing uneven benefits to major oil importers.
The tumble in oil has bolstered the U.S. recovery by giving consumers more money to spend, leading the bank to revise up its growth projection for the world’s largest economy by 0.2 percentage point to 3.2%. But the price plunge is failing to spur stronger growth in importers such as Europe and Japan, while also exacerbating financial problems in major oil exporters.
Kaushik Basu, the World Bank’s chief economist, said the global economy is being pulled by a single engine–the U.S. economy.
“This does not make for a rosy outlook for the world,” he said. “It is really not enough.”
We are just above the trend line floor, below the 50 DMA and touching the 100 DMA. It would appear we are at a crossroad and need to see how this market plays out before making any rash decisions. If you are a swing-trader and guess right, 50-50 chance, you could make a bundle jumping in right now.
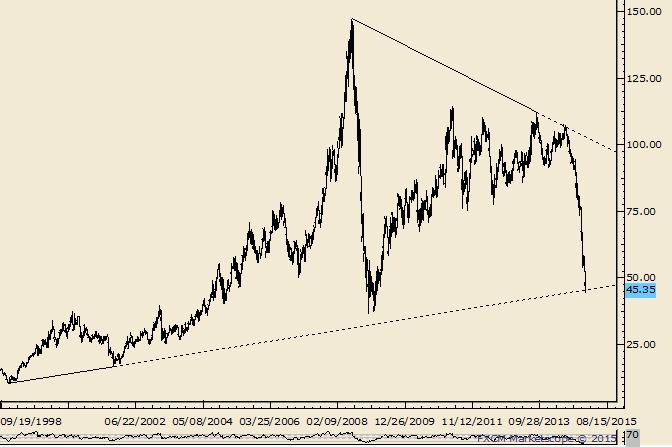
Crude Tests Line from 1998 and 2001 Lows
By Jamie Saettele, CMT, Sr. Technical Strategist
Chart Prepared by Jamie Saettele, CMT using Marketscope 2.0
-“With crude in freefall, it’s a good time to step back and look at where massive support could reside. Well, the line that extends off of the 2001 and 2008 lows intersects a lower parallel this month and the next at the 78.6% retracement of the advance from 2008 at 53. While the market is clearly extreme and therefore prone to a reversal now, 53 looks great for a significant low.”
-Crude was able to find minor support near 53 but the market now trades with a 4 handle. The line that extends off of the 1998 and 2001 lows has been reached. A weekly close above the line would be a positive.
Our medium term indicators are leaning towards sell portfolio of non-performers at the close and the session market direction meter has been swinging from 30% bearish to 30% bullish and back all session. At the close the short-term direction meter is 35 % Bullish. We remain mostly conservatively bullish, neutral in other words. Right now now I am getting very concerned any downtrend could get very aggressive in the short-term and any volatility may also promote sudden reversals. The SP500 MACD has turned down, but remains below zero at -2.74. I would advise caution in taking any position during this uncertain period and I hope you have returned your ‘dogs’ to the pound.
Having some cash on hand now is not a bad strategy as market changes are happening everyday. As of now, I do not see any leading indicators that are warnings of a ‘long-term’ reversal in the near-term. There may be one later in 2015, but any market fluctuations we see now are more of a internal market rectification than a bear market.
Investing.com members’ sentiments are 45 % Bearish. (The Sheeples may be right for a change.)
Investors Intelligence sets the breath at 51.9 % bullish with the status at Bear Confirmed. (Chart Here ) I expect a market reversal at or before ~25.0 should the markets start to descend.
StockChart.com Overbought / Oversold Index ($NYMO) is at -13.58. (Chart Here) But anything below -30 / -40 is a concern of going deeper. Oversold conditions on the NYSE McClellan Oscillator usually bounce back at anything over -50 and reverse after reaching +40 oversold.
This $NYA200R chart below is the percentage of stocks above the 200 DMA and is always a good statistic to follow. It can depict a trend of declining equities which is always troubling, especially when it drops below 60% – 55%. Dropping below 40%-35% signals serious continuing weakness and falling averages.
StockChart.com NYSE % of stocks above 200 DMA Index ($NYA200R) is at 48.47 %. (Chart Here) The next support is ~37.00, ~25.00 and ~15.00 below that. December, 2011 was the last time we saw numbers in the 20’s.
Many indicators are showing markets leveling off or rounding indicating market softness that could lead to lower values and investor’s should watch carefully. The SP500 MACD, $BPNYA, $BPSPX, $TNX and the $NYA all show rounding off the tops which in the past has lead to a downturn.
Also, the SP500 10 DMA has crossed over the 20 DMA (12-11-14) always indicating a ‘correction’ underway. The 50,100, 145 and 200 DMA are all going flat which is never a good omen for a continuing bull run. Watch for the 50 DMA to cross over the 100,145 and 200 DMA to indicate how deep the correction will be.
These are not ‘leading’ indicators as such, but depicting ‘trends’ in the making showing data accumulated over the past several months, but needs to be watched.
StockChart.com NYSE Bullish Percent Index ($BPNYA) is at 57.50. (Chart Here) Next stop down is ~57, then ~44, below that is where we will most likely see the markets crash.
StockChart.com S&P 500 Bullish Percent Index ($BPSPX) is at 68.60. (Chart Here) In support zone and rising. ~62, ~57, ~45 at which the markets are in a full-blown correction.
StockChart.com 10 Year Treasury Note Yield Index ($TNX) is at 18.90. (Chart Here) 10-year Treasury yield drops below 2% for first time in 7 months
StockChart.com Consumer Discretionary ETF (XLY) is at 70.43. (Chart Here)
Chris Ciovacco says, “As long as the consumer discretionary ETF (NYSEARCA:XLY) holds above [66.88], all things being equal, it is a good sign for stocks and the U.S. economy.” This chart clearly shows that dropping below 65.00 / 62.75 (and staying there) should be of a great concern to bullish investors.
StockChart.com NYSE Composite (Liquidity) Index ($NYA) is at 10,637. (Chart Here) Markets move inverse to institutional selling. We are above the resistance (10,301) but is this a test of the next resistance (triple top) at ~11,900, watch to see if these numbers decline back down. Next stop down is 10600, 9750, then 9250, and 8500.
If you want to receive occasional Trader Alert ‘Tweets’ click here: 
The DOW at 4:00 is at 17614 down 27 or -0.15%. (Historical High 18,103.45)
The SP500 is at 2023 down 5 or -0.26%. (Historical High 2,093.55)
SPY is at 202.00 down 0.57 or -0.28%.
The $RUT is at 1181 up 0.54 or 0.05%.
NASDAQ is at 4662 down 3 or -0.07%. (Historical High 5132.52)
NASDAQ 100 is at 4166 down 4 or 0.09%.
How the Popular ‘VIX’ Gauge Works
$VIX ‘Fear Index’ is at 20.56 up 0.96 or 4.90%. Bullish Movement
(Follow Real Time Market Averages at end of this article)
The longer trend is up, the past months trend is net neutral, the past 5 sessions have been net positive and the current bias is negative and trending sideways.
Brent crude falls below $50 as Goldman cuts outlook
WTI oil is trading between 46.76 (resistance) and 44.21 (support) today. The session bias is trending up and is currently trading down at 46.43. (Chart Here)
Brent Crude is trading between 48.51 (resistance) and 46.41 (support) today. The session bias is trending up and is currently trading down at 48.31. (Chart Here)
The general consensus is that gold prices will actually fall in the next twelve months (Sept to Aug. 2015). Goldman Sachs estimates that gold will fall to $1,050 an ounce, a drop of nearly 19%.
Gold fell from 1244.38 earlier to 1227.51 and is currently trading down at 1233.60. The current intra-session trend is trending down. (Chart Here)
Dr. Copper is at 2.604 falling from 2.712 earlier. (Chart Here)
The Consequences Of A Strengthening U.S. Dollar
Will 2015 be the Year of the Greenback?
The US dollar is trading between 92.61 (highest since 2005 and ~92 is a very substantial resistance with 92.53 representing a triple top) and 62.03 and is currently trading up at 92.47, the bias is currently elevated and trading sideways. (Chart Here)
Resistance made in Aug., 2013 (~85.00) has been broken and now is support. This support has gotten much stronger since August, 2014 and isn’t likely to fall easily. The current level (~91 / 92) is the resistance (substantial) and could be a triple top of sorts. Historical chart Here.
The markets are still susceptible to climbing on ‘Bernankellen’ vapor, use caution!
“Investors should remember that excitement and expenses are their enemies. And if they insist on trying to time their participation inequities, they should try to be fearful when others are greedy and greedy only when others are fearful.” – Warren Buffett
If you would like to get advanced buy/sell tweets, sign-up in the column to the right of this post by clicking on the ‘Follow‘ button. Write me with suggestions and I promise not to bite.
Real Time Market Numbers
To contact me with questions, comments or constructive criticism is always encouraged and appreciated:
Written by Gary


