
by Cliff Wachtel, FX Empire
Strategic lessons for investors in stock indexes, forex and other global markets, both technical and fundamental outlooks, lessons about what’s really moving markets now and what we need to watch in the future. Don’t be fooled by the prevailing calm.

Summary
- Technical Outlook: Short Term Neutral with bearish bias, medium term bullish
- Fundamental Outlook: There are only a few events this week with market moving potential, but some important lessons for the coming week and beyond
- Lessons: Including five reasons stocks fell last week, likely market movers this week
- Concluding Thoughts Why daily charts suggest a flat trading range with at least another modestly lower test of support for the coming week, the fundamentals that could support or oppose that move, and what you must keep monitoring
The following is a partial summary of conclusions from our weekly fxempire.com analysts‘ meeting about the weekly outlook for global equities, currencies, and commodity markets.
TECHNICAL PICTURE
We look at the technical picture first for a number of reasons, including:
Chart Don’t Lie: Dramatic headlines and dominant news themes don’t necessarily move markets. Price action is critical for understanding what events and developments are and are not actually driving markets. There’s nothing like flat or trendless price action to tell you to discount seemingly dramatic headlines – or to get you thinking about why a given risk is not being priced in.
Support, resistance, and momentum indicators also move markets, especially in the absence of surprises from top tier news and economic reports.
Overall Risk Appetite Medium Term Per Weekly Charts Of Leading Global Stock Indexes

Must-Know Market Movers To Watch And Lessons For Week Of June 16, 2014
Weekly Charts Of Large Cap Global Indexes Feb 24 2013 To Present With 10 Week/200 Day EMA In Red: LEFT COLUMN TOP TO BOTTOM: S&P 500, DJ 30, FTSE 100, MIDDLE: CAC 40, DJ EUR 50, DAX 30, RIGHT: HANG SENG, MSCI TAIWAN, NIKKEI 225
Key For S&P 500, DJ EUR 50, Nikkei 225 Weekly Chart: 10 Week EMA Dark Blue, 20 WEEK EMA Yellow, 50 WEEK EMA Red, 100 WEEK EMA Light Blue, 200 WEEK EMA Violet, DOUBLE BOLLINGER BANDS: Normal 2 Standard Deviations Green, 1 Standard Deviation Orange.
Source: MetaQuotes Software Corp, www.fxempire.com, www.thesensibleguidetoforex.com
Key Points: Medium Term Bullish Per Weekly Sample Index Charts
Our sample of weekly charts for leading global stock indexes shows all of our sample leading US and European indexes down together for the first time in a while, driven by a combination of fundamental factors discussed below, as well as nearby overhanging technical resistance of big round numbers (like 2000 on the S&P 500 and 17,000 on the DJIA).
There is no evidence that this is anything more than a normal technical correction, aided by some minor bearish fundamentals that provided an excuse for the week’s minor pullback (S&P 500 -0.7%, DJIA -0.9%, Nasdaq -0.2%, Russell 2000 -0.01%).
Of course there are plenty of reasons for a sustained pullback, however they’re just the same ones we’ve had on the scene for years while the market kept rising anyway (weak recovery with indexes at multi-year or all-time highs, EU crisis risk due to failure to make meaningful reforms, etc.).
Thus these don’t explain or justify a reversal of the current bull market as long as the real drivers of its recovery remain in place: low returns and interest rates, central banks dovish, and no crisis threats. The EU’s flaws and risks are being ignored, and no one cares enough about the various bullying by Russia or China to endanger profitable business with either with meaningful sanctions.
Meanwhile all of our sample US and European indexes retain strong medium term upward momentum as per their weekly charts, as demonstrated by their remaining firmly in their double Bollinger® band buy zones and their 10-200 week EMAs ascending in unison with no sign of the shorter duration, more sensitive EMAs even flattening out, never mind turning lower and threatening to cross below the longer term EMAs
Investors will likely be watching for a near term bottom to form before considering new longs that could fuel another assault on yet another all-time high above these level on the US indexes (which of course influence EU indexes).
Short Term Per Daily Charts: Bearish/Neutral
The only big lesson is that given the past week’s lower close, the S&P 500 and most other leading US and European indexes in our sample are now in the double Bollinger® band neutral zone, which suggests a horizontal trading range for the coming days.
There is no really meaningful support until we start hitting 50 day moving averages (at around 1900 on the S&P 500, so a test to that level (not even a 2% drop from Friday’s close) is still no big deal at all, and would not surprise us, especially given the fundamental picture described below, which is unlikely to inspire a new burst of optimism.
Fundamental Picture: Top Lessons, Market Movers
Five Reasons Why US, EU Stocks Fell
The consensus at this time is that prime market drivers this week for stocks were a combination of:
The looming overhead technical resistance (for example 2000 on the S&P 500, 17,000 for the DJIA), which had investors waiting for an excuse to take profits. That excuse came from:
- Rising expectations of rising rates in the UK, perhaps aided (or at least not opposed) by disappointing US retail sales. Both came on Thursday, but most of the dive in US indexes was done before the retail data came out.
- Rising oil prices due to Iraq tension, which shot up $2 (also on Thursday), presumably on Iraq tensions. Oil prices closed the week near a 9 month high ~$113 (Brent crude price) on fears that unrest could yet cut Iraq oil production further. If the conflict spreads to Iraq’s oil producing areas, Brent crude could easily hit $125 and higher.
- The IMF warned that global housing prices were well above historical averages, particularly in urban cores around Asia and South America.
- The world bank cut its US GDP forecast estimates to 2.8% from 3.2%, citing America’s harsh winter and the knock-on effect of the Ukraine crisis.
- Lack of enough positive news to balance the above negative factors
If you’re not convinced that these were reasons should drive much of a reaction, you’re not alone. The minor pullbacks on the indexes suggest that markets felt the same way.
US Retail Sales
No huge deal, still progress, but the below forecast result emphasize the “slow” part of the “slow but steady” recovery theme. The miss also somewhat undermines the recent solid jobs figures, as these should in theory generate spending. It also undermines the excuse that earlier retail weakness was weather related, now that weather should no longer hinder shoppers’ spending.
Bullish Lessons
Despite the drop in so many global stock markets last week, there are some developing bullish stories worth watching.
Goldman Getting More Bullish
Goldman Sachs’ top economist Jan Hatzius believes the economy is now growing at an above-trend pace, despite Q1’s disappointing contraction. His reasons include:
- The firm’s current activity indicator (CAI), which grew at an annualized rate of 3.4% in May. He believes that the CAI is a much more reliable economic activity indicator than real GDP because it is timelier, more broadly based, less noisy, and thus less likely to need revisions later in the year.
- Improvement in the housing sector because:
- The negative impact of the 100bp increase in 30-year mortgage rates last summer should now be over
- The 40bp drop in rates since the start of the year could provide a modest increase in coming quarters.
- Optimism on household formation. From 2006 to 2012, the share of 18-34 year olds who live with their parents increased by nearly 5 percentage points, equivalent to an extra 3½ million individuals. He expects that the slow reversal of this blow to household formation to continue over the next 5 years and thus household growth should outpace population growth as this cohort makes up for lost time.
Relative Improvement in NFIB Small Business Confidence Index
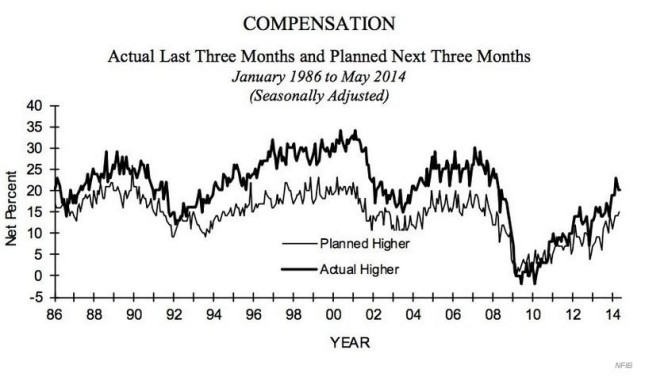
The NFIB’s small business confidence index not only beat forecasts, its 96.6 reading was the highest since 2007. While such sentiment readings aren’t the most reliable leading indicators, the fact that planned compensation increases noted in the report reached their highest level since the start of the Great Recession, and rising wages should translate into rising consumer spending, which makes up about 70% of US GDP.
This idea is supported by the chart below, which indicates a rising number of businesses citing “labor quality” as their single biggest problem.
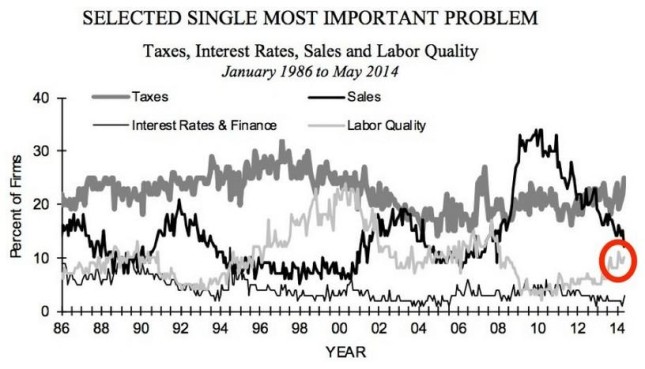
Source: NFIB (via Business Insider)
That said, note that this latest reading was still far below readings expected during an expansion.
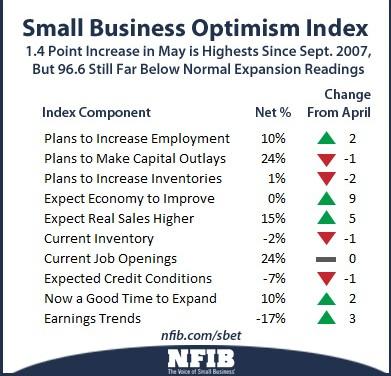
Source: http://www.nfib.com/surveys/small-business-economic-trends/
A brief look at the above components of the index shows plenty of pessimism:
- 0% expect the economy to improve
- Earnings trends outlook was down 17%
- Only 10% thought it was a good time to expand
In sum, we’ve improvement, but it’s strictly a relative gain.
Potential Coming Week Market Movers To Watch
Top Calendar Events To Watch
We’ve another typical late month economic calendar week that’s light on top tier events with market moving potential. The FOMC meeting has the most potential to move markets, for reasons we discuss in some depth here. The German sentiment and inflation data are more relevant than usual for the coming months as they could be influential in deciding the ECB’s next easing steps. Weak results could be bullish for stocks and other risk assets as they could be seen as reducing German opposition to sooner, larger additional stimulus. Events to watch include:
Tuesday
EU: Germany ZEW economic sentiment report
US: Building permits, CPI, Housing starts
Wednesday
EU: German 10 year bond auction
US: FOMC rate statement, economic projections, press conference
Thursday
EU: Euro group meetings
US: New jobless first time claims, Philly Fed Mfg Index
Friday
EU: German PPI, current account, ECOFIN meetings
Concluding Thoughts
Daily index charts suggest that we’re likely in a horizontal trading range in the coming days, with the odds favoring a modest test of support lower, most likely only about 2%. At that point we hit our first real support, and whether or not we get a bounce will depend on the week’s few top tier news and economic data offerings.
Beyond Calendar Events
As always, we need to watch for anything that suggests the pillars of the current bull market are threatened. Those pillars are:
- Continued low rates and extraordinarily dovish central bank policy, which both limit options for yield seeking investors and inflate risk asset prices. Note that we would NOT include indications of a rate hike of 25 bps/ year as such a threat, though the first hints of any hikes could spook markets in the short term.
- Absence of economic crisis threats. The EU remains the most likely source of that by far, although the most likely near term threat to markets is further oil price spikes from the spreading of fighting in Iraq to oil producing areas.
To be added to Cliff’s email distribution list, just click here, and leave your name, email address, and request to be on the mailing list for alerts of future posts. For information on a free intro to currencies video course based on my award winning book, see here.
DISCLOSURE /DISCLAIMER: THE ABOVE IS FOR INFORMATIONAL PURPOSES ONLY, RESPONSIBILITY FOR ALL TRADING OR INVESTING DECISIONS LIES SOLELY WITH THE READER.


