by Poly, Zentrader
This is an excerpt from this week’s premium update from the The Financial Tap, which is dedicated to helping people learn to grow into successful investors by providing cycle research on multiple markets delivered twice weekly. Now offering monthly & quarterly subscriptions with 30 day refund. Promo code ZEN saves 10%.

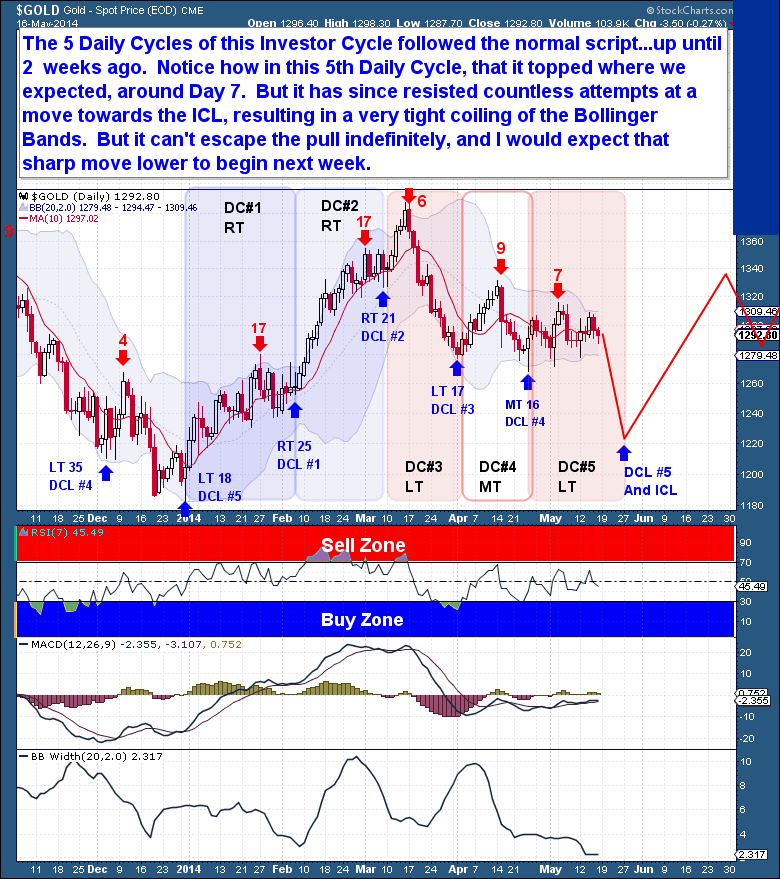
The waiting game for the declining portion of this Daily Cycle has certainly been frustrating. Generally, by this point, the severe decline towards the next scheduled DCLICL would have been well and truly in progress. Along with the powerful rally out of any ICL, the drop and collapse in the latter portion of an Investor Cycle are the two most dependable events within any Cycle.
Instead, what we have now is an asset that has stubbornly resisted the pull of a looming Cycle Low. Since topping on just Day 7 (as expected Left Translated), we’ve seen a 10 day sideways chop, instead of the typical relentless Cycle Low selling. And there have been opportunities for a sell-off too, as the majority of those sessions involved early morning declines that were successfully offset with a rush of buying support.
The upshot of this indecisive action is that the Bollinger Bands have now contracted to levels that are rarely seen. And whenever similar conditions have existed in the past, we find that the eventual breakout (in either direction), always ends up being powerful and explosive. Although gold’s ability to withstand the pull of the Cycle Low (too date) is bullish, it is very rare to see powerful (Bollinger Band) moves resolve themselves in any direction other than where the path of least resistance is found. And that means that the expectation of a fall to a Cycle Low is still valid, but now the tight Bollinger Bands are indicating that goal will be achieved much quicker than previously thought.
Generally by this point, at least ever since gold peaked in 2011, the miners would comfortably be leading gold lower by this point. That’s because gold has been locked in a bear market and the miners are overly sensitive and leveraged to gold’s movements. So when the expectation (bear market) is for lower gold prices, it’s the miners that are typically sold in advance of this decline.
So it’s impressive and comforting to see the miners holding up so well here. When I look at the precious metals bullish percent chart, I notice that 30% of miners are still showing bullish P&F charts. This too is revealing, because it’s typically only during a bull market that we see such a decent level of miners maintaining a bullish chart.
During the last gold ICL, the miners made deeper lows, while gold did not. I believe this is because the miners were anticipating a continuation (bear market) of the series of failed gold Cycles. But now, with gold having formed a double bottom the last time, I believe this “relative strength” is an indication that the miners expect an end to gold’s bear market. In that case, we should now see the miners hold above the prior ICL lows set back in December.


