
4 Rules For Using Double Bollinger Bands , The Most Useful Technical Indicator (Continued)
by Cliff Wachtel, FX Empire
Part 1 Is An Introduction To Double Bollinger Bands, Here, Part 2, Is A Continuation That Presents Specific Rules And Examples
This is part of FXEmpire’s continuing series of special features on trader education, and provides a solid basis for understanding double Bollinger bands. For more detailed coverage, and examples, see Chapter 8 of the book, The Sensible Guide To Forex, or its video course version here.

The Four Rules for Using Double Bollinger Bands (DBBs) & Examples
Repetition is the foundation of learning, so here’s a relatively short summary of how to actually use and apply Double Bollinger Bands (DBBs).
We’ll be referring to different parts of Chart 2 below, a weekly chart of the S&P 500, which covers the period from August 17, 2008 to October 3 2010
DBBs work in any time frame, although like other technical indicators, their signal is more meaningful in longer time frames in which random short term noise and money don’t distort the real trend.

4 Rules For Using Double Bollinger Bands, The Most Useful Technical Indicator Part 2
CHART 2: S&P 500 Weekly Chart August 17, 2008 to October 3 2010
Source: MetaQuotes Software Corp, www.fxempire.com, www.thesensibleguidetoforex.com
RULE 1: Go Short Or Stay Short When Price Is In Or Below The DBB “Sell Zone” (DBBSZ)
The DBB Sell Zone (DBBSZ) is the bottom area bounded by the lower red and yellow Bollinger bands
As long as price remains within or below the lower 2 BBs, the downward momentum is strong enough to trust, so that there is a high probability that the trend will continue. When price drops into this area, it is a signal (pending confirmation, as per Part 1) to enter new short positions, and to maintain them until price makes a decisive (confirmed) move above this zone. Exit and take profits when price makes a decisive move above this zone.
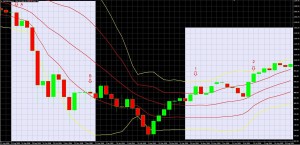
CHART 3: S&P 500 Weekly Chart Sept. 7th – Dec. 14th 2008 – Framed By Arrows A and B Within Highlighted Area
Source: MetaQuotes Software Corp, www.fxempire.com, www.thesensibleguidetoforex.com
For example in Chart 3 above (a magnified version of the left side of Chart 2 above) from the week of September 7th (arrow A) until the week of December 14th (arrow B), the odds favored maintaining short positions for those trading off weekly charts.
Get Confirmation
Because the downtrend needs strong momentum to enter the buy or sell zones, Double Bollinger Bands are distinctly lagging indicators and thus by themselves not suited for catching short-lived though perfectly tradable trends. As noted in Part 1, you’ll want some additional technical confirmation, and at times will need to focus on developing news that could become market moving. Politically driven events can be especially unpredictable and merit extra caution.
For example, if you would have solely relied on DBBs during the Greek stage of the EU debt crisis that occurred in the spring of 2010, you would not have gone short the index until the trend was mostly finished, as shown in Chart 4 below.
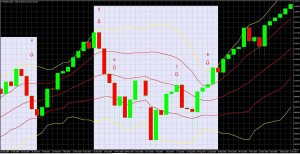
S&P 500 Weekly Chart April 25 – August 1, 2010 – Framed By Arrows 5 And 7 Within Center Highlighted Area
Source: MetaQuotes Software Corp, www.fxempire.com, www.thesensibleguidetoforex.com
As with any breakout move, you need to have your criteria for distinguishing between a decisive break above the DBBSZ, and a false breakdown such as the choppy price action we see from candles 6 to 7 in Chart 4 above. Those criteria for defining a sustained move can be as simple as a given number of candlesticks that stay above the DBBSZ, or a more complex combination of indicators like a moving average crossover.
RULE 2: Go Long, Stay Long, When Price Is In Or Above The DBB “Buy Zone” (DBBBZ)
The DBB Buy Zone (DBBBZ) is the top area or quarter, in bounded by the upper red and yellow Bollinger bands
As long as price remains within or above the upper 2 DBBs, the upward momentum is strong enough so that there is a high probability that the trend will continue higher. This is the time to enter new long positions. Exit and take profits when price moves below this zone.
For example, look at the SP 500 index weekly chart below (Chart 5), in which we zoom in on the section of Chart 2 above that covers the period from May 3, 2009, to January 24, 2010 highlighted by arrows 1-4.
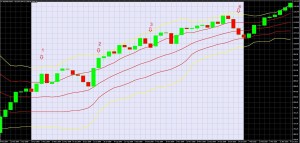
CHART 5: S&P 500 Weekly Chart March 8 2009 – April 4, 2010
Highlighted area: April 19, 2009 – 31 January 2010
Source: MetaQuotes Software Corp, www.fxempire.com, www.thesensibleguidetoforex.com
Note the following:
- Even if you used no other indicator but DBBs, and simply went long when the index entered the buy zone and exited when it dipped below, you’d have caught most of the uptrend and avoided most of the pullbacks. However you could even improve on that performance.
- The period from May 3 to July 19, 2009, highlighted by arrows 1-2 (candles dates are the start of the week), illustrates the importance of getting some kind of confirmation that the move into the buy (or sell zone) is likely to follow through and last long enough to profit with little more than a conservative trailing stop loss.
- If you had entered and exited long positions during this period based only on when the index was above or below the buy zone, your odds of success were low, with results ranging from small gains to larger losses, depending on your entry and exit criteria.
- In contrast, those with more conservative, slow to enter and quick to exit strategies, in the worst case had only minimal losses.
- The period from July 19 2009 through January 24 2010, highlighted by arrows 2-4, shows what can happen when your entry and exit signals strike the right balance between the risk and reward, as discussed in Part 1. Even those with more conservative criteria, slow to enter, quicker to exit, would have caught most of the uptrend.
- For example, those who waited for a second confirming close in the buy zone (arrow 2), or even a third, and then exited at some point around the first weekly close below the buy zone, would have caught most of the move.
- A conservative trailing stop loss would have been especially helpful avoiding some of the downward choppy action between arrows 3 and 4, while waiting for a second weekly close in the zone would have gotten them back in to catch much of the final, slower uptrend at the end of 2009.
In sum, if you had used only DBB signals, going long when the index was in the buy zone and exiting when it closed below it, you’d have caught most of the uptrend during the period of May 3 2009 to January 24 2010 and been out for most of the pullbacks. Using confirming indicators and trailing stop losses could have improved your performance and kept you out of choppy periods like May-June 2009 (arrows 1-2) and October 2009 (arrow 3 and the 5 weeks after).
RULE 3: Don’t Trade Trends Based On DBBs When Price Is In The Neutral Zone/ The Neutral Zone Signals A Flat Trading Range
When price is in the neutral middle zone, which is bounded by the 1 standard deviation Bollinger Bands (in red), the trend’s momentum isn’t strong enough, so the odds of its continuing aren’t high enough for a low risk bet on its continuing. Therefore we don’t trade it, unless we have enough other technical or fundamental evidence that suggests otherwise the trend (up or down) is likely to continue.
When price is in the neutral zone:
- Trend Traders Should Cease Trading: Wait for the next entry into the buy or sell zone when momentum is strong enough.
- Switch To Range-Trading Strategies: As we discuss in our book, in these situations it’s especially helpful to also look at the range using a shorter term time frame, typically a fourth or fifth of your normal time frame. For example, those using weekly charts consult daily charts, and those using daily charts consult 4-6 hour charts.
See Chart 6 below for examples when this did and didn’t work during the EU Crisis (Greek Stage) of 2010.
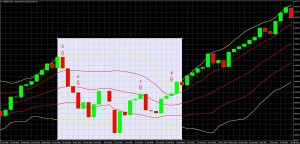
Chart 6: S&P 500 Weekly Chart, January 31, 2010 – February 20, 2011
Red Arrows Highlighting weekly candles of April 25 (5), 2010, May 16, (6), August 1 (7), Sept. 12 2010 (8)
Source: MetaQuotes Software Corp, www.fxempire.com, www.thesensibleguidetoforex.com
- When It Didn’t Work – Arrows 5 to 6: For example, in late April 2010, according to this Rule 3, I should not have been short until the week of May 16 (arrow 6) at earliest, when price entered the Sell Zone. Following this rule, you’d have missed the move. I caught only by making a judgment call to do so, because there was a growing chance that the EU might not bail out Greece in time to avoid a market collapse, so I didn’t wait to start taking at least a partial short position – the fundamentals (and other technical signals I was watching) were enough to justify ignoring Rule 3, and I took a small short position early. My fundamental thesis was that if the collapse of just 1 major bank (Lehman brothers) crashed markets in September of 2008, imagine what a national default (and wave of defaults that could follow as no one would lend to the other weak EU economies) could do. This time I was right. However this was a judgment call that could have easily gone against me.
So that was a classic case of when to consider ignoring rule 3, and of the need to find that balance between using too little evidence to see the full picture, and using so much that it paralyses you and prevents you from taking action. In the spring of 2010 DDBs were just not enough.
- When It Did – Arrows 6-8: However, Rule 3 would have worked well in keeping you out of much of the choppy range bound action into the spring and early summer of 2010, highlighted by arrows 6-8 in Chart 6 above. It’s harder to trade profitably when there is no clear trend.
- As a general rule, I follow Rule 3. If I violate it, it’s with small, phased entries and other risk management tools I discuss in Chapter 5 of my book.
Rule 4: Minimize Risk – Enter At Cheaper Ends Of Buy/Sell Zones, Take Partial Positions
This rule attempts to reduce the risk of buying at the top or selling at the bottom that comes when chasing a strong trend, while minimizing the risk (and loss potential) that instead of catching a bargain, you catch a ‘falling knife’ that becomes a loss. This rule is not easy to implement. Your success depends on how well you read the other technical and fundamental evidence, and how well you are able to weigh all the evidence and distinguish between opportunities to catch a bargain instead of a falling knife.
This is often easier said than done.
After you have a confirmed move into the buy zone, try to buy near the bottom of the zone. When you have a confirmed move into the sell zone, try to open a short near the top of it. We prefer doing this using limit orders in order to remove the emotion that might cause you to hesitate out of fear of missing a better price or fear that you’re entering at the start of a deeper pullback. As long as your stop loss is set close enough beyond these zones, if the trade moves against you your losses will be limited to acceptable amounts per your personal maximum loss rules.
Additional steps to cut risk include:
Enter your full planned position in stages. For example, a third as it gets close, a third if it hits your ideal entry point, and a final third when the asset bounces back into the buy or sell zone. Again these can be done with preset limit orders, although on shorter time frames or in times of volatility the bands could move a lot and force you to regularly modify your limit orders.
If you have the time to actively monitor the position, you can attempt to further reduce risk by:
- waiting to open a new long position until price starts to bounce back up into the buy zone
- waiting to open a new short position until price starts to bounce back down into the sell zone
The Key Qualification To Rule 4: No Major Evidence Of Trend Exhaustion
If you believe the evidence suggests a deeper pullback (or rally in the case of short positions) could come, stand aside, don’t trade. Typically the evidence is some kind of news that suggests the reversal has a good chance of persisting. For example, look at Chart 7 below.
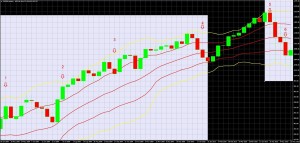
Chart 7: S&P 500 WEEKLY CHART April 26 2009 to May 23 2010
Highlighted areas April 26 2009 to January 31 2010, April 18 to May 23 2010
Source: MetaQuotes Software Corp, www.fxempire.com, www.thesensibleguidetoforex.com
The rule worked well if you bought at the cheap end of the buy zone during the week of Sept. 27 2009 (arrow 3), there you caught a bargain. However if you bought at the close of the week of April 25, 2010 (arrow 5), you caught a falling knife, as a threatened Greek default set off a sharp 4 week pullback. The key was to recognize that the fundamentals were so bad that they outweighed the suggested bargain of Rule 4. Again, that’s easier said than done. Sometimes you’ll be right, sometimes not.
What would have saved you? In addition to reasonable stop losses (which we ALWAYS USE, RIGHT?), rule 4 also suggests taking partial positions when entering strong trends, like 1/3rd of your total planned position if you can’t wait for the retracement to the cheaper end of your buy or sell zone, another 1/3rd if/when you get the retracement, and another 1/3rd when if you get a bounce back into the buy or sell zone. A stop loss that was near strong support and that kept your loss within you maximum loss guidelines (typically 1%-3% of your capital at most), and a small position would usually have prevented a loss beyond those guidelines. Of course even a stop loss doesn’t guarantee against larger than planned losses if price gaps beyond it.
CONCLUSION AND SUMMARY
Double Bollinger Bands are incredibly useful, but like any technical indicator, must be used in combination with other evidence, the precise nature of which depends on your style of trading and timeframe. Here’s a brief summary of the 4 rules for using DBBs.
RULE 1: Go Short, Stay Short When Price Is In Or Below The DBB “Sell Zone” (DBBSZ)
When price is in the sell zone, downward momentum is strong enough for the odds to be in favor of continued downtrend.
RULE 2: Go Long, Stay Long When Price Is In Or Above The DBB “Buy Zone” (DBBZ)
When price is in the buy zone, upward momentum is strong enough for the odds to be in favor of continued downtrend.
RULE 3: Don’t Trade Trends Based On DBBs When Price Is In The Neutral Zone
When price is in the middle, neutral zone, momentum isn’t strong enough for trend trading in your current time frame.
Your choices are to:
- In your current time frame, avoid trend trading altogether. Take a break or switch to range trading strategies and systems.
- Switch to trading a trend in shorter time frames.
Rule 4: Minimizing Risk: Enter Longs At Bottom Of BBBZ, Shorts At Top Of DBBSZ, Or Enter In Stages
Qualification: do not attempt ‘bargain hunting’ if there is significant evidence that the trend is not merely testing support but in fact reversing. If your full range of fundamental and technical evidence suggests a reversal may be forming, then avoid the trade, or take only partial positions until the trend resumes, and use stop losses to minimize damage if in fact the trend you’re playing breaks down.
For More In Depth Training On Double Bollinger ® Bands
For more detailed coverage, and examples, see Chapter 8 of the book, The Sensible Guide To Forex, or its video course version here.
To be added to Cliff’s email distribution list, just click here, and leave your name, email address, and request to be on the mailing list for alerts of future posts.
DISCLOSURE /DISCLAIMER: THE ABOVE IS FOR INFORMATIONAL PURPOSES ONLY, RESPONSIBILITY FOR ALL TRADING OR INVESTING DECISIONS LIES SOLELY WITH THE READER.


