
Written by Sig Silber
NOAA acknowledges their forecast of an El Nino has been premature and they may have overestimated the intensity of such an event. They are now

more or less saying: “better late than never”. Questions remain on the impact of an El Nino that will arrive late and weak but which may last longer than the NOAA Seasonal Outlook suggests.The new seasonal update was issued by NOAA on Thursday November 20. I have been waiting for two or three months for NOAA to acknowledge that their assessment of the warm event in the Pacific has been too simplistic. On Thursday they finally cried “Uncle” and bit the bullet which is most obvious in their discussion of the 30 day Outlook (December).
The problems with their analysis have been obvious to me based on:
- the lack of agreement for a couple of months between the 6 – 14 day Outlooks and the Monthly Outlook issued on the third Thursday of each month and updated at the end of month.
- the incoherence among the analogs they issue with each 6 -14 Day Outlook during weekdays. I analyze those analogs in each report and they have been at odds with each other which to me raised red flags. I am not sure if an analysis of those analogs is available anywhere other than this weekly report.
- when I have looked at the information in their weekly ENSO discussion, it has not been very convincing to me. I have discussed some of their Hovmoller diagrams each week and other related information such as the Southern Oscillation and it has not convinced me that an El Nino of any strength would impact the U.S. Lower 48 in the early part of this winter.
Usually I take the NOAA discussion, remove the redundancy (part of which is caused by issuance of a 30 day and long-lead discussion), and divide the processed discussion into seven parts: Ocean conditions, 30 day, three month, and 14 month each of the last three divided into temperature related and precipitation related. Then I incoporate those six parts of the discussion that can be associated with outlook maps with the appropriate maps.
Today I am going to present the NOAA discussion as one section of this report separate from the associated maps. To make it as easy to follow as possible, I have reorganized the NOAA discussion a bit to present the ocean discussion first and removed some of the redundancy and other technical parts of the NOAA discussion that may be of less interest e.g. which models were relied on. I am starting my report with that edited NOAA discussion as I think it presents a more coherent picture of the complex situation that presents itself to meteorologists. At a later time, I will divide the discussion and place it with the appropriate maps in Part II of this report for continued reference as we move through December. A new seasonal outlook will be issued on December 18 and the early December Outlook will be updated on November 30.
So let’s get started. It is a long discussion but very informative and I think NOAA has in general done a good job in explaining the issues. I have highlighted some of the key items in the discussion and interjected editorial comments. Then we will discuss the new maps.
“CURRENT ATMOSPHERIC AND OCEANIC CONDITIONS
ATMOSPHERIC AND OCEANIC CONDITIONS IN THE TROPICAL PACIFIC REMAIN MOST CONSISTENT WITH AN ENSO-NEUTRAL STATE. SST ANOMALIES HAVE INCREASED IN RECENT WEEKS AND ARE NOW ABOVE +0.5 IN ALL THE ENSO CRITICAL REGIONS OF THE PACIFIC, WITH ANOMALIES OF +0.7C, +0.6C, +0.9C AND +0.6C IN THE NINO 4, 3.4 Editor’s Note: 0.6C in Nino 3.4 is the criteria for minimal El Nino Condition but by itself does not define an El Nino which can only be defined after the fact. When we take a look at the current location of the Kelvin Wave, it will be clear why there are anomalous warm conditions along the Eastern Equator, 3, AND 1+2 REGIONS RESPECTIVELY. SSTS ALONG THE EQUATOR ARE ABOVE +0.5 C EVERYWHERE FROM ABOUT 160 E TO JUST SHY OF THE SOUTH AMERICAN COAST, WITH SOME REGIONAL ANOMALIES IN EXCESS OF +1.0 C. OCEAN SUBSURFACE TEMPERATURE ANOMALIES REMAINED FAIRLY STEADY IN THE PAST MONTH, AND RANGE FROM +1.0 TO +4.0 C AT BETWEEN 100 AND 200 METERS DEPTH, EXCEPT NEAR SOUTH AMERICA WHERE ABOVE NORMAL OCEAN TEMPERATURES ARE CONFINED TO THE UPPER 50 METERS OR SO. WITH THE EXCEPTION OF THE SOI, THE USUAL ATMOSPHERIC RESPONSE TO EL NINO ARE NOTABLY ABSENT FROM RECENT OBSERVATIONS. RECENT OLR ANOMALIES SUGGEST THAT CONVECTION IS NEAR TO BELOW NORMAL OVER THE CENTRAL EQUATORIAL PACIFIC IN AREAS THAT USUALLY SEE ABOVE-NORMAL CONVECTION DURING EL NINOS. BOTH LOWER AND UPPER LEVEL WIND ANOMALIES DURING THIS PERIOD REMAIN NEAR NORMAL. WITHOUT LARGE SCALE ATMOSPHERIC ANOMALIES NORMALLY ASSOCIATED WITH EL NINO PRESENT, ENSO-NEUTRAL STILL BEST DESCRIBES THE CURRENT CONDITIONS IN THE PACIFIC.
SIGNIFICANT EXTRA-TROPICAL ANOMALIES THAT MAY HAVE AN IMPACT ON THE CLIMATE OVER NORTH AMERICA INCLUDE A LARGE AREA OF POSITIVE SST ANOMALIES IN THE WESTERN NORTH PACIFIC BASIN THAT PROJECTS ONTO A POSITIVE PDO, ALTHOUGH ANOMALIES HAVE WEAKENED CONSIDERABLY IN THE LAST MONTH. SST ANOMALIES ALONG THE ATLANTIC SEABOARD HAVE DECREASED CONSIDERABLY IN THE PAST MONTH, AND ARE NOW BELOW NORMAL FROM VIRGINIA SOUTHWARD, WITH POSITIVE SST ANOMALIES HOLDING ON IN THE NORTH.Special note: In the last two Reports I have presented an abstract of a paper that suggests that the AMO has peaked and is now declining and will gradually go negative. It is not the only paper where that has been the conclusion. The changes taking place which are measured by the AMO and PDO are far more important to the economy of the U.S. and World than minor perturbations to the ENSO Cycle along the Equator. Cycles which last in the order of 60 years have more of an impact than sub-decadal cycles like ENSO over the 60 year period even though the amplitude of the sea surface temperature anomalies in the 60 year cycles are less than the anomalies in extreme years within the sub-decadal ENSO cycle.
IMPRESSIVELY POSITIVE ANOMALIES IN THE AREAL EXTENT OF SNOW COVER WERE OBSERVED DURING THE MONTH OF OCTOBER IN BOTH NORTHERN EURASIA AND CANADA. THE AREAL EXTENT OF SNOW COVER IN LATE OCTOBER IS THE THIRD HIGHEST SINCE THE LATE 1960’S, ONLY EXCEEDED BY OCTOBER VALUES IN 1976 AND 2002.
THERE IS FAIRLY GOOD CONSENSUS AMONG BOTH STATISTICAL AND DYNAMICAL MODELS FOR ABOVE-NORMAL SSTS TO PERSIST IN THE NINO 3.4 REGION THROUGH THE BOREAL WINTER. MOST OF THE TROPICAL ATMOSPHERIC RESPONSE TO EL NINO IS USUALLY WELL ESTABLISHED BY THIS LATE IN THE YEAR, SO IN SPITE OF THE CONSENSUS OF PREDICTIONS, THE EL NINO IS EXPECTED TO BE WEAK, IF IT DEVELOPS AT ALL. THE CURRENT CONSENSUS OF OPINION AMONG FORECASTERS AT CPC AND IRI IS FOR A 60% CHANCE OF EL NINO DEVELOPMENT. THE MULTI-MODEL AVERAGE OF NINO 3.4 SSTS IS FOR ANOMALIES OF CLOSE TO +1.0 C BY EARLY 2015. A CALIBRATED CONSENSUS OF BOTH STATISTICAL MODELS AND THE CFSV2 PREDICTIONS SUGGESTS AN EARLIER PEAK TO NINO 3.4 SSTS OF JUST OVER +0.7 C, IN NDJ 2014-15, DECREASING SLOWLY AFTERWARD AND REACHING +0.5 C BY MAM 2015.Special Note: If this turns out to be correct, this warm event may not even be categorized as an El Nino because the duration was too short. But I suspect that NOAA is incorrect on the duration of the length of time that the ONI Index will indicate El Nino Conditions in fact I think they may be off by as much as a full year. In fact their major problem may be that they are early by a year in their analysis.
MOST MODELS RUN AS PART OF THE NMME AND IMME PERSIST ABOVE-NORMAL SSTS ALONG THE WEST COAST OF NORTH AMERICA THROUGH AT LEAST LATE SPRING 2015. THE AREAL EXTENT AND MAGNITUDE OF THESE PREDICTED ANOMALIES PROJECT ONTO A POSITIVE PDO PATTERN AND ARE LARGE ENOUGH TO POTENTIALLY HAVE AN IMPACT ON CLIMATIC CONDITIONS OVER NORTH AMERICA IN THE NEXT SEVERAL SEASONS.30-DAY OUTLOOK DISCUSSION FOR DECEMBER 2014
THE OUTLOOK FOR DECEMBER 2014 IS DECIDEDLY UNCERTAIN AT THIS POINT. THERE ARE SEVERAL COMPETING INFLUENCES THAT ARE YET TO BE CLEARLY RESOLVED IN EITHER THE STATISTICAL OR DYNAMICAL TOOLS.
LET’S FIRST BEGIN WITH THE DYNAMICAL MODEL GUIDANCE. MONTHLY FORECASTS FROM THE NMME AND IMME ARE FAIRLY MILD ACROSS MUCH OF THE CONUS, ESPECIALLY THE NORTHERN AND WESTERN PORTIONS. THIS IS A REASONABLE SOLUTION GIVEN THE GENERAL WARM ENSO SIGNAL. HOWEVER, THERE IS LITTLE INDICATION THAT A ROBUST ENSO RESPONSE IN THE EXTRATROPICS CAN BE SUSTAINED ABSENT SOME REASONABLY CANONICAL EQUATORIAL CONVECTIVE ANOMALIES CONSISTENT WITH AN EL NINO. CURRENTLY, THE CONVECTIVE STATE OF THE EQUATORIAL PACIFIC IS SOMEWHAT INCONSISTENT WITH WHAT WOULD OTHERWISE BE EXPECTED. SO IN THIS SENSE, MODEL GUIDANCE INITIALIZED WEEKS AGO THAT INDICATE AN ENSO-LIKE FOOTPRINT OVER NORTH AMERICA ARE SOMEWHAT SUSPECT. ADDING TO THE UNCERTAINTY IS THE FACT THAT MORE RECENT GUIDANCE FROM THE CFS AND ECMWF THAT EXTENDS AT LEAST THROUGH THE MIDDLE OF DECEMBER INDICATES A DIFFERENT PATTERN FOR THE FIRST TWO WEEKS OF THE MONTH, WITH ABOVE-NORMAL TEMPERATURES CENTERED IN THE EASTERN CONUS (WITH THE CFS WARMER THAN THE ECMWF), AND NEAR- TO BELOW-NORMAL TEMPERATURES CENTERED OVER PARTS OF THE WEST. THIS LATER GUIDANCE IS SLIGHTLY PREFERRED, BUT THE TYPICAL LOW FORECAST SKILL IS UNDERSTOOD.
Special Note: Now we are finally learning what might be driving our weather in the short term. See the below reference to the Madden-Julian Oscillation (MJO)
CURRENT AND FORECAST STATE OF THE MJO MAY HAVE SOME IMPLICATIONS FOR THE MONTHLY FORECAST. THIS, TOO, IS UNCERTAIN SINCE THERE DOES NOT SEEM TO BE A STRONG ATMOSPHERIC RESPONSE IN THE SUBTROPICS YET, CASTING DOUBT ON WHETHER THE ONGOING EVENT WILL SUBSTANTIALLY MODULATE NORTH AMERICAN CLIMATE. SHOULD A ROBUST MJO PROPAGATE FROM THE INDIAN OCEAN TO THE PACIFIC, THE RESPONSE LATER IN THE MONTH COULD BALANCE OUT A WARMER SIGNAL INDICATED EARLY BY THE FORECAST EVOLUTION OVER THE NEXT WEEK OR TWO.
FINALLY, THERE ARE SIGNS IN THE CURRENT MEDIUM RANGE GUIDANCE THAT RELOADING OF ANOMALOUSLY COLD AIR IN WESTERN CANADA COULD OCCUR BY LATE NOVEMBER. THIS IS BEST SUPPORTED BY THE LATEST CANADIAN AND ECMWF ENSEMBLE AND DETERMINISTIC GUIDANCE. SUCH A SCENARIO CASTS MORE DOUBT ON THE WARM ENSO RESPONSE OVER SOUTHERN CANADA AND THE NORTHERN CONUS.
IN LIGHT OF THE AFOREMENTIONED DISCUSSION, THERE IS RELATIVELY LITTLE COVERAGE ON THE 0.5 LEAD MONTHLY TEMPERATURE MAP. ABOVE-NORMAL TEMPERATURES ARE FAVORED FOR THE IMMEDIATE WEST COAST BASED ON GOOD MODEL CONSENSUS AND STATISTICAL GUIDANCE BASED ON PACIFIC SSTS. UNCERTAINTY INCREASES IN THE PACIFIC NORTHWEST SOMEWHAT. ABOVE-NORMAL TEMPERATURES ARE FAVORED IN THE NORTHEASTERN CONUS AT THE INTERSECTION OF SIGNALS FROM ENSO, MJO, AND RECENT MODEL GUIDANCE. CONFIDENCE HERE IS STILL FAIRLY LOW AS INDICATED BY MEAGER PROBABILITIES. BELOW-NORMAL TEMPERATURES ARE WEAKLY FAVORED FOR THE SOUTH-CENTRAL CONUS WHERE THE ENSO SIGNAL IS STRONGEST AND THERE IS MORE SUPPORT FROM MODEL GUIDANCE.
Special note: Not for the first week of December according ot the 6 – 14 Day Outlook Issued today November 24.
THE NORTHWARD EXTENSION IS BASED ON THE DISTINCT POSSIBILITY THAT ANOTHER ARCTIC AIRMASS MOVES SOUTHWARD EAST OF THE ROCKIES EARLY IN THE MONTH. IF THIS OCCURS, EVEN AN EMERGENCE OF A STATIONARY ENSO SIGNAL LATER IN THE MONTH WOULD STILL NOT UNDO THE ODDS FOR BELOW-NORMAL TEMPERATURES OVER THE INDICATED REGION.
FOR PRECIPITATION, A GENERAL CONSENSUS OF ENSO IMPACTS AND MODEL GUIDANCE IS USED, WITH LOW PROBABILITIES INDICATING THE LOW CONFIDENCE IN LIGHT OF THE ABOVE FACTORS. IF ROBUST MJO IMPACTS ARE REALIZED EARLY IN THE MONTH, ABOVE-MEDIAN PRECIPITATION MIGHT EXTEND FARTHER NORTH INTO PARTS OF THE OHIO VALLEY AT THE EXPENSE OF RAINFALL NEAR THE GULF COAST. UNCERTAINTY IS ALSO ESPECIALLY HIGH OVER THE PACIFIC NORTHWEST, WHERE THERE ARE MULTIPLE CONFLICTING SIGNALS.
DISCUSSION FOR THREE MONTH DEC/JAN/FEB SEASONAL OUTLOOKS
THE TEMPERATURE OUTLOOK FOR DECEMBER-JANUARY-FEBRUARY (DJF) 2014-15 INDICATES ELEVATED CHANCES OF ABOVE-NORMAL MEAN TEMPERATURES FOR ALASKA, THE WESTERN CONUS, AND IN PARTS OF NEW ENGLAND. THE CHANCES OF BELOW-NORMAL MEAN TEMPERATURES ARE ELEVATED ALONG THE SOUTHERN PART OF THE COUNTRY FROM EASTERN NEW MEXICO TO THE SOUTHEASTERN ATLANTIC COAST AND FLORIDA.
PROGNOSTIC DISCUSSION OF OUTLOOKS – DJF 2014 TO DJF 2015
THE DJF 2014-15 PRECIPITATION OUTLOOK INDICATES ENHANCED CHANCES OF BELOW-MEDIAN PRECIPITATION FOR PARTS OF THE PACIFIC NORTHWEST, NORTHERN ROCKIES, GREAT LAKES AND OHIO VALLEY. INCREASED PROBABILITIES FOR ABOVE-MEDIAN PRECIPITATION AMOUNTS ARE FORECAST FROM SOUTHERN AND CENTRAL CALIFORNIA EASTWARD ACROSS THE SOUTHWEST, SOUTHERN PLAINS, AND ALONG THE GULF AND SOUTHERN ATLANTIC COASTS NORTHWARD TO INCLUDE THE EASTERN SEABOARD TO SOUTHERN NEW ENGLAND. THE PROBABILITIES FOR ABOVE-MEDIAN PRECIPITATION ARE ALSO ENHANCED OVER PARTS OF COASTAL SOUTHERN ALASKA, WHILE PARTS OF INTERIOR ALASKA HAVE ENHANCED CHANCES OF BELOW-MEDIAN PRECIPITATION AMOUNTS.
THE TEMPERATURE AND PRECIPITATION OUTLOOKS FROM DJF 2014-15 THROUGH MAM 2015 ARE INFLUENCED BY THE POTENTIAL IMPACTS OF A WEAK EL NINO. THE LIKELY MARGINAL STRENGTH OF EL NINO RESULTS IN ONLY SLIGHTLY ENHANCED CHANCES OF CLIMATIC ANOMALIES IN THE REGIONS USUALLY INFLUENCED BY ENSO, AND IS WELL SHORT OF THE CONFIDENCE ASSOCIATED WITH A STRONGER EVENT. LARGE-SCALE INDICATORS, SUCH AS THE POSITIVE PDO Editor’s Note: Probably more significant than what is going on along the Equator. AND NEGATIVE SOI CURRENTLY ARE CONSISTENT WITH EL NINO CONDITIONS AND MAY INDICATE THE EVENTUAL ESTABLISHMENT OF THE USUAL TELECONNECTION PATTERNS ASSOCIATED WITH EL NINO IN SPITE OF THE CURRENTLY DISORGANIZED EQUATORIAL ATMOSPHERIC STATE.
FOR OUTLOOKS FROM AMJ THROUGH DJF 2015-16, DECADAL TRENDS DUE TO CHANGES IN THE CLIMATE BASE STATE AND THE CON (HEAVILY INFLUENCED BY TRENDS) ARE THE PRIMARY SOURCE OF TEMPERATURE AND PRECIPITATION SIGNALS.
TEMPERATURE
THE OUTLOOK FOR DJF 2014-15 INDICATES ELEVATED CHANCES FOR ABOVE-NORMAL TEMPERATURES IN ALASKA, MOST OF THE WESTERN CONUS, AND FOR PARTS OF NEW ENGLAND. THERE IS NOTABLY HIGH SPREAD AMONG TOOLS FOR TEMPERATURES IN THE CENTRAL AND EASTERN CONUS, WITH SOME TOOLS AND DYNAMIC MODELS FAVORING BELOW NORMAL TEMPERATURES, WHILE OTHERS FAVOR ABOVE. THIS MAY, IN PART BE RELATED TO THE DIFFERING STRENGTHS OF THE EL NINO PREDICTIONS FROM THE MODELS. STRONGER EL NINO EVENTS TEND TO BE ASSOCIATED WITH ABOVE-NORMAL TEMPERATURES IN THE UPPER MID-WEST AND GREAT LAKES, WHILE WEAK EVENTS SHOW COOLER AND MORE VARIABLE TEMPERATURE CONDITIONS. GIVEN THE EXPECTED WEAK NATURE OF THIS EL NINO, THE WARMER SOLUTIONS AMONG THE TOOLS WERE LARGELY DISCOUNTED. SNOW COVER THROUGHOUT THE NORTHERN HEMISPHERE WAS WELL ABOVE THE LONG-TERM NORMALS IN OCTOBER, AND SOME RECENT RESEARCH SUGGESTS THAT THIS MAY INCREASE LIKELIHOOD OF BELOW-NORMAL TEMPERATURES IN EASTERN NORTH AMERICA. THE CA–SST TOOL SUGGESTS A NEGATIVE AO/NAO WHICH IS ALSO ASSOCIATED WITH BELOW-NORMAL TEMPERATURES IN THE EASTERN CONUS. CONSIDERING THESE FACTORS, THE REGION FAVORING BELOW-NORMAL TEMPERATURES WAS EXPANDED SOMEWHAT FROM WHAT WAS INDICATED ON LAST MONTH’S OUTLOOK, AND THE CHANCES FOR ABOVE-NORMAL TEMPERATURES IN THE NORTHERN GREAT PLAINS HAVE DIMINISHED TO NO HIGHER THAN LONG TERM CLIMATOLOGY. BELOW-NORMAL TEMPERATURES ARE NOW FAVORED THROUGHOUT MUCH OF THE SOUTHERN HALF OF THE CONUS FROM THE SOUTHERN ROCKIES EASTWARD, WHERE WEAK EL NINO COMPOSITES ALSO LEND SUPPORT.
THE PATTERN OF FORECAST TEMPERATURE PROBABILITIES FAVORED IN DJF EXTENDS TO THE LATE WINTER MONTHS AND THEN GRADUALLY DIMINISHES INTO SPRING, 2015. BEFORE LARGELY VANISHING BY AMJ 2015. PREDICTED ANOMALIES FOR MJJ AND BEYOND ARE LARGELY DETERMINED BY RECENT TRENDS, ALTHOUGH SOME REVISIONS WERE MADE TO THE FORECAST IN THE WESTERN CONUS. THE REGION OF ENHANCED CHANCES FOR ABOVE-NORMAL TEMPERATURES WAS EXPANDED IN THE LATE SPRING TO REFLECT NORTH PACIFIC SSTS PREDICTED BY THE MOST DYNAMIC MODELS AS WELL AS THE CA–SST WHICH FAVOR WARM CONDITIONS. THE PREDICTED SSTS PROJECTS ON TO THE POSITIVE PDO INDEX, AND CORRELATES WEAKLY WITH ABOVE-NORMAL TEMPERATURES IN THE WESTERN CONUS, SO THE REGION OF ENHANCED CHANCES OF ABOVE-NORMAL TEMPERATURES WAS EXPANDED IN PARTS OF THE WEST RELATIVE TO PREVIOUS OUTLOOKS IN AMJ AND MJJ 2015. SIGNALS FROM TRENDS PREDOMINATE DURING THE SUMMER MONTHS, RESULTING IN ELEVATED CHANCES FOR ABOVE-NORMAL TEMPERATURES FOR MUCH OF ALASKA, AND AS WELL AS MUCH OF THE CONUS EXCEPT FOR INTERIOR PORTIONS.
TREND-RELATED SIGNALS GRADUALLY DIMINISH INTO THE FALL AND WINTER SEASONS, UNTIL BY DJF 2015-16 ELEVATED CHANCES FOR ABOVE-NORMAL TEMPERATURES ARE RESTRICTED ONLY TO REGIONS IN THE SOUTHWEST, SOUTHERN ROCKIES, AND TEXAS AS WELL AS NEAR NEW ENGLAND, AND IN NORTHERN ALASKA. SUBSTANTIALLY ENHANCED PROBABILITIES OF ABOVE-NORMAL TEMPERATURES ARE FORECAST FOR NORTHERN ALASKA FROM ASO 2015 THROUGH OND 2015 DUE TO THE LIKELY ANOMALOUS DELAY IN ARCTIC OCEAN AND BERING SEA SEA-ICE COVER FOR OCTOBER AND NOVEMBER IN THE LAST DECADE RELATIVE TO 1981-2010.
PRECIPITATION
THE ELEVATED CHANCES FOR A WEAK EL NINO EVENT INFLUENCES THE PRECIPITATION OUTLOOK MAPS THROUGH FMA 2015. DYNAMICAL MODEL FORECAST GUIDANCE FROM THE NMME AND IMME AND THEIR PARTICIPANT MODELS GENERALLY SUPPORT WARM EVENT COMPOSITES. PRECIPITATION FORECASTS FROM THE GLOBAL SST BASED CONSTRUCTED ANALOG TOOL WAS ALSO CONSIDERED.
THE CHANCES FOR ABOVE-MEDIAN PRECIPITATION AMOUNTS ARE ELEVATED FOR CENTRAL CALIFORNIA, ACROSS THE SOUTHWEST, PARTS OF THE SOUTHERN GREAT BASIN, THE SOUTHERN PLAINS AND THE SOUTHEAST CONUS FROM DJF 2014-15 THROUGH FMA 2015. THE NMME SUGGESTS WETTER CONDITIONS FOR CENTRAL CALIFORNIA ON THE MOST RECENT RUNS THAN RUNS FOR THE SAME SEASON ISSUED LAST MONTH. THE PRECIPITATION FORECAST FOR CENTRAL CALIFORNIA WAS REVISED TO REFLECT THIS INFORMATION. EL NINO COMPOSITES ALSO WEAKLY SUPPORT AN INCREASE IN THE ODDS FOR ABOVE AVERAGE PRECIPITATION NORTHWARD ALONG THE EASTERN SEABOARD TO SOUTHERN NEW ENGLAND WITH LIMITED SUPPORT FROM THE NMME AND IMME MODEL GUIDANCE.
ENHANCED PROBABILITIES FOR BELOW-MEDIAN PRECIPITATION ARE INDICATED FOR THE PACIFIC NORTHWEST THROUGH MAM 2015, AND FROM THE CENTRAL MISSISSIPPI VALLEY INTO THE GREAT LAKES REGION FROM DJF 2014-15 THROUGH MAM 2015. THE AREA AND CONFIDENCE IN THE FORECAST FAVORING BELOW-MEDIAN PRECIPITATION IS REDUCED SOMEWHAT IN RELATION TO THE OUTLOOKS ISSUED A MONTH AGO IN THE PACIFIC NORTHWEST DUE TO WEAK SUPPORT FROM THIS MONTHS NMME AND IMME. PROBABILITIES OF ABOVE-MEDIAN PRECIPITATION ARE ENHANCED FOR PARTS OF SOUTHERN ALASKA THROUGH FMA 2015, ALTHOUGH THIS AREA IS SOMEWHAT SMALLER THAN IN PREVIOUS OUTLOOKS FOR THE SAME SEASON DUE TO THE LACK OF SUPPORT FROM RECENT MODEL RUNS. SOME RECENT EXAMINATION OF PRECIPITATION IN PAST INSTANCES OF WEAK EL NINO CONDITIONS SUPPORT ENHANCED CHANCES OF BELOW-MEDIAN PRECIPITATION AMOUNTS IN PARTS OF CENTRAL ALASKA IN DJF AND JFM.
RECENT DYNAMIC FORECASTS FROM THE NMME SUGGEST ABOVE-MEDIAN PRECIPITATION FOR THE SOUTHERN ROCKY MOUNTAINS AND PARTS OF THE SOUTHERN GREAT PLAINS IN THE LATE SPRING, CONTRADICTING THE FORECAST ISSUED LAST MONTH, WHICH WERE PRIMARILY BASED ON TREND AND BEYOND THE LAST LEAD OF THE DYNAMIC MODELS INITIALIZED LAST MONTH. IN VIEW OF THIS NEW INFORMATION, THE FORECAST FOR AMJ AND MJJ 2015 WAS REVISED TO EQUAL CHANCES FOR PRECIPITATION TERCILES FOR THE SOUTHERN HIGH PLAINS. DECADAL TRENDS POINT TO ELEVATED CHANCES FOR BELOW-MEDIAN PRECIPITATION IN THE PACIFIC NORTHWEST DURING THE JAS AND ASO 2015 SEASONS. TRENDS IN PARTS OF THE SOUTHEAST CONUS INDICATE ELEVATED CHANCES FOR BELOW-MEDIAN PRECIPITATION AMOUNTS IN DJF 2015-16.”
Here is the new Early December Temperature Outlook. It will be updated by NOAA prior to my next week’s report.

Here is the Early Outlook for December Precipitation. It will be updated by NOAA prior to my next week’s report.

Three-Month Outlook – Important because it is the heart of the Winter Season
First the prior December/Jan/Feb Temperature Outlook.

And here is the newly issued Temperature Outlook for those same three months.

There is not much change other than the removal of the warmer than climatology across the Northern Tier which is addressed in the NOAA discussion.
Here is the prior 14 Month (a year if you consider the middle month of each three-month outlook to be representative of that three-month period)
Temperature Outlook

And here is the updated Seasonal Temperature Outlook. You can find a version of these maps which you can click on to enlarge here.
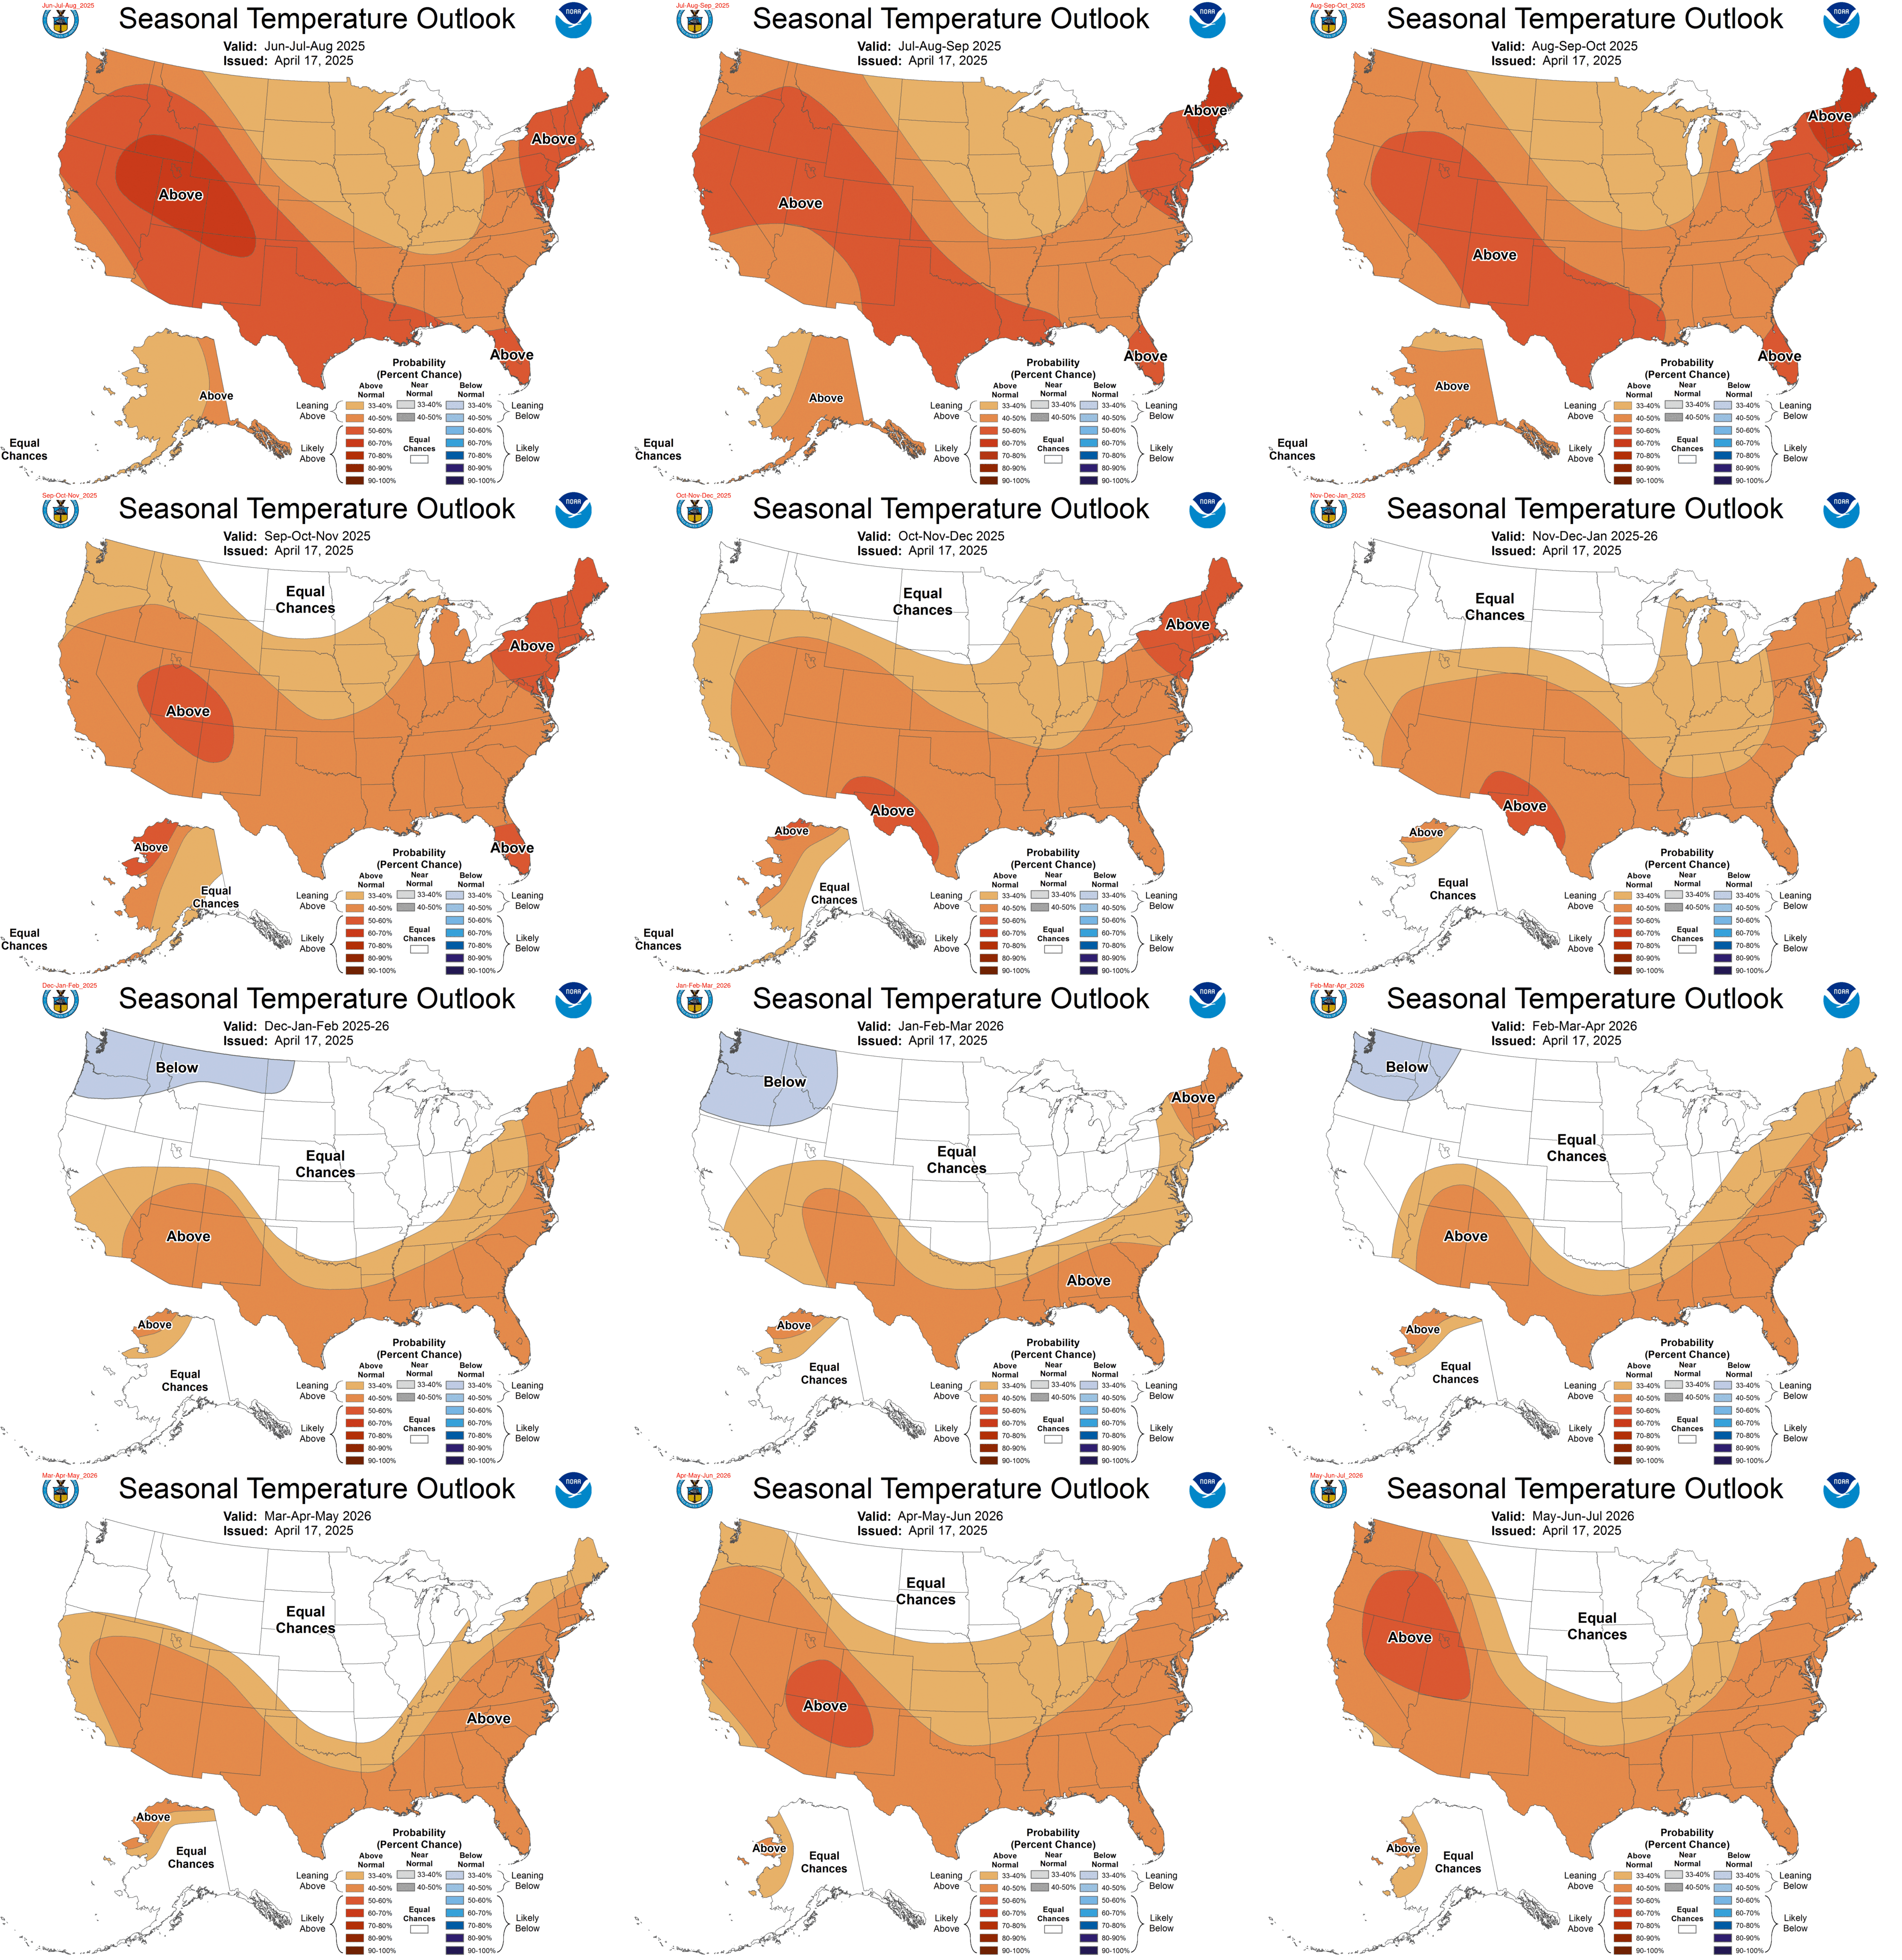
To compare the two you have to keep in mind that one month has gone by and one month is added at the end. These maps are overlapping three-month periods. So to compare the prior with the new you ignore the first map in the prior and mentally shift the remaining maps to the left and fill in the right-hand gap created with the left-most map from the next row. When you do that you see that there is essentially no change in this set of maps even though NOAA has revised their estimate of the onset and strength of this warm event in the Pacific along the Equator which if strong enough would eventually be labeled as an El Nino. It looks like the warmer Northeast has been extended by a couple of months next winter.
Now Let us Focus on Precipitation
First the prior Dec – February Precipitation Outlook

And then the newly issued Precipitation Outlook for Dec – Feb .

Despite the caveats in the NOAA discussion, this remains almost identical to the one issued last month. That seems strange.
Now let us look at the prior 14 months of Precipitation Outlook

Here is the updated 14 months of Seasonal Precipitation Outlook. You can also find these maps here where you can click on them to enlarge them.
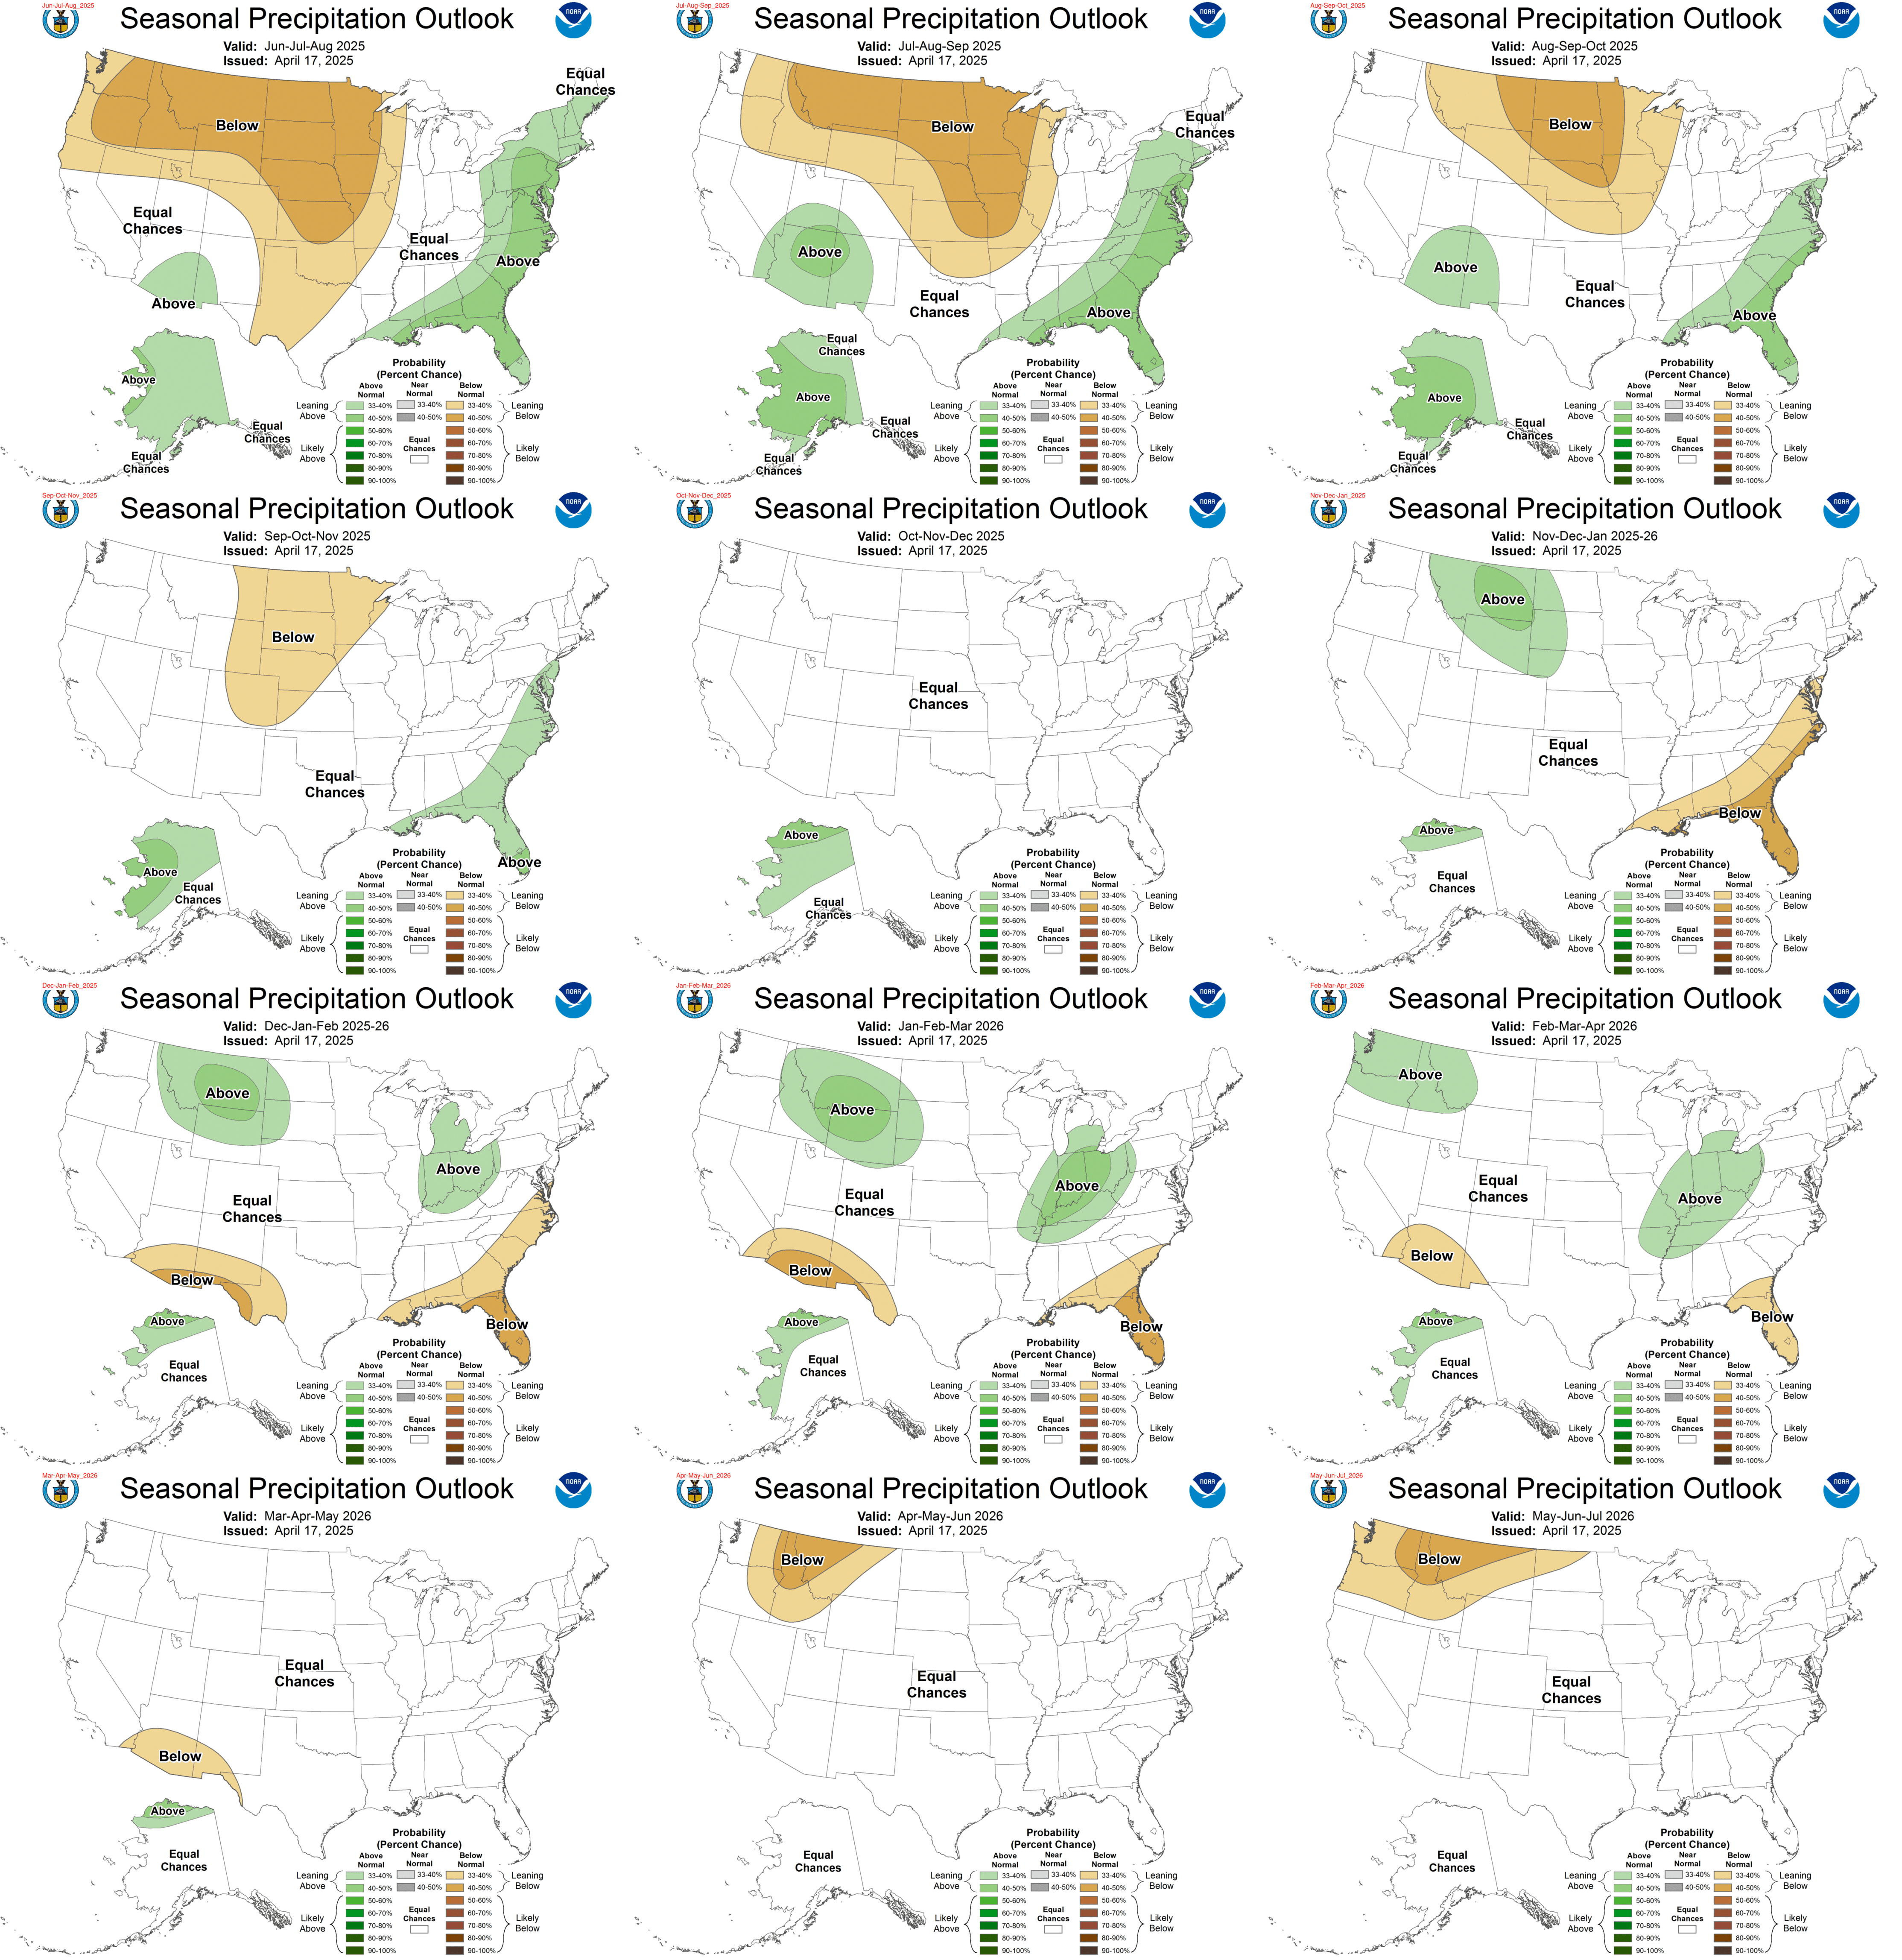
To compare the two you have to keep in mind that one month has gone by and one month is added at the end. These maps are overlapping three-month periods. So to compare the prior with the new you ignore the first map in the prior and mentally shift the remaining maps to the left and fill in the right-hand gap created with the left-most map from the next row. Although the NOAA assessment of the onset and strength of a potential El Nino has changed, there is not much change in these precipitation Outlook maps. The dry monsoon for next summer (which I never understood why such a forecast was being made) has been taken out of the Outlook and in the added Dec-Jan-Feb 2016 map, a dry period for the Southeast has been added. Comparing to the earlier three-month map which does not show it suggests this dry period is forecast for Feb 2016. It is small detail but January and February 13 and 14 months out fall in 2016 not 2015.
Short-term Outlook
Now let us take a look at the 8 – 14 day outlook that was issued today November 24, 2014.
I am only showing the “second week” namely the day 8 -14 outlook. The first week can be found in Part II of my report but 8 – 14 days covers most of the 6 – 14 day period and does not vary much from the first part of the outlook issued today except that the earlier part of the Outlook calls for colder than climatology for some northern states centered on North Dakota and Minnesota.
Here is the “Early” Temperature Outlook for December and yes I showed this map earlier in the report and I am showing it again to make for easy comparison with the short-term outlook.
And here is the 8 – 14 Day Temperature Outlook released today (but it will auto-update every day so it will be changing day by day so my comments may become out of sync with the map):

There is no resemblance here. It is just one week, of course.
And here is the monthly “Early” Precipitation Outlook for December. And yes it is a repeat of a map I show earlier in this report but repeated to make it easier to compare with the short-term outlook.
And here is the 8 – 14 Day Precipitation Outlook issued today (but it will auto-update and change every day so my comments may become out of sync with the map).

There is not much resemblance here. But again it is just one week of the month.
And excerpts from the NOAA discussion.
“6-10 DAY OUTLOOK FOR NOV 30 – DEC 04, 2014
THERE IS GOOD AGREEMENT AMONG TODAY’S MODEL FORECASTS OF THE 6-10 DAY MEAN 500-HPA HEIGHTS OVER NORTH AMERICA. A RIDGE IS FORECAST TO BE OVER THE NORTHEASTERN CONUS WITH A TROUGH OVER THE WEST. STRONG ZONAL 500-HPA FLOW IS FORECAST JUST NORTH OF THE U.S. CANADIAN BORDER, CUTTING OFF COLD AIR FROM THE WESTERN TROUGH. THE 500-HPA HEIGHTS OVER WEST-CENTRAL CANADA ARE FORECAST TO BE BELOW NORMAL, SETTING UP A SHARP GRADIENT BETWEEN THE EXPECTED COLD AIR OVER WESTERN AND CENTRAL CANADA, EXTENDING INTO EASTERN ALASKA AND RELATIVE MILD AIR OVER THE CONUS.
ABOVE-NORMAL HEIGHTS OVER THE EASTERN HALF OF THE CONUS LEAD TO ENHANCED CHANCES OF ABOVE-NORMAL TEMPERATURES, ESPECIALLY IN THE SOUTHEAST. MOST MODELS PREDICT RELATIVELY MILD AIR OVER MUCH OF THE WEST AS WELL, IN SPITE OF THE FORECAST FOR NEAR- TO BELOW- NORMAL 500-HPA HEIGHTS IN THE TROUGH. A SHARP GRADIENT JUST TO THE NORTH OF THE BORDER MAKES FOR UNCERTAIN CONDITIONS IN THE NORTHERN ROCKIES, PARTS OF THE PACIFIC NORTHWEST AND NORTHERN PARTS OF THE GREAT BASIN, WHERE ANY UNFORESEEN TROUGH AMPLIFICATION MAY ALLOW COLD AIR INTO THE REGION. BELOW-NORMAL TEMPERATURES ARE FAVORED FOR PARTS OF THE NORTHERN ROCKY MOUNTAINS EASTWARD TO THE UPPER MISSISSIPPI VALLEY. BELOW-NORMAL TEMPERATURES ARE FAVORED FOR INTERIOR EASTERN ALASKA UNDER BELOW NORMAL 500-HPA HEIGHTS, ALTHOUGH NEAR-NORMAL TEMPERATURES ARE MOSTLY FAVORED NEAR THE COASTS, WITH ABOVE NORMAL TEMPERATURES FAVORED IN THE SOUTHWEST AND THE ALEUTIANS WHERE ABOVE NORMAL SEA SURFACE TEMPERATURES HAVE RE-EMERGED IN RECENT WEEKS.
ENHANCED WESTERLY FLOW OVER THE PACIFIC LEAD TO ELEVATED CHANCES FOR ABOVE-MEDIAN PRECIPITATION AMOUNTS FOR MUCH OF THE WESTERN CONUS. EXPECTED SOUTHWESTERLY FLOW AT 500-HPA SHOULD OPEN MUCH OF THE EAST TO MOISTURE FROM THE GULF OF MEXICO, ENHANCING CHANCES FOR ABOVE-MEDIAN PRECIPITATION. A RELATIVELY NARROW REGION OF NEAR- TO BELOW-MEDIAN PRECIPITATION IS EXPECTED TO THE LEE OF THE ROCKIES WHERE LIMITED MOISTURE SUPPLY IN ZONAL FLOW MAY REDUCE PRECIPITATION AMOUNTS. THE GFS FAVORS BELOW-MEDIAN PRECIPITATION AMOUNTS IN MUCH OF ALASKA EXCEPT FOR IN THE ALEUTIANS.
FORECAST CONFIDENCE FOR THE 6-10 DAY PERIOD: ABOUT AVERAGE, 3 OUT OF 5, DUE TO GOOD MODEL AGREEMENT ON AN AMPLIFIED RIDGE IN THE EAST, BUT CONSIDERABLE UNCERTAINTY ASSOCIATED WITH POSSIBLE INFLUENCE OF COLD AIR IN THE BROAD TROUGH FORECAST OVER THE WEST.
8-14 DAY OUTLOOK FOR DEC 02 – 08 2014
02 – 08 2014
MODELS FORECASTS STRENGTHEN THE RIDGE PREDICTED OVER THE ATLANTIC, AND SHOW SUBSTANTIAL POSITIVE ANOMALIES JUST OFF THE NEW ENGLAND COAST. THE MODELS ALSO BEGIN TO DEVELOP ANOTHER WEAKER RIDGE OVER THE WEST COAST OF NORTH AMERICA. A BROAD, SHALLOW TROUGH IS FORECAST IN BETWEEN THESE FEATURES, WITH 500-HPA HEIGHTS MOSTLY FORECAST TO BE NEAR NORMAL OR SLIGHTLY ABOVE NORMAL. EXPECTED ZONAL UPPER-LEVEL FLOW KEEPS COLD AIR TRAPPED IN CENTRAL CANADA, ALTHOUGH, AS IN THE 6-10 DAY FORECAST, THERE IS A SHARP GRADIENT IN THE MODEL FORECASTS FOR TEMPERATURES NEAR THE NORTHERN ROCKIES AND NORTHERN GREAT PLAINS. TELECONNECTIONS ON THE STRONG NEW ENGLAND RIDGE SUGGEST MUCH COLDER TEMPERATURES IN THE NORTHERN PLAINS THAN THE MODELS INDICATE. HOWEVER MODELS ARE IN GOOD AGREEMENT ON THE GENERAL FLOW, SUGGESTING THAT TEMPERATURES WILL BE RELATIVELY MILD IN ZONAL FLOW. THE CONTRAST IN THESE TWO INDICATORS SUGGEST UNCERTAINTY IN TEMPERATURES ACROSS THE GREAT PLAINS FOR THE PERIOD.
THE TEMPERATURE AND PRECIPITATION PATTERN IS VERY SIMILAR TO THE PATTERN PREDICTED IN THE 6-10 DAY PERIOD. THE REGION OF GREATEST UNCERTAINTY IN TEMPERATURES FOLLOWS THE MEAN TROUGH AXIS WHICH IS FORECAST TO MOVES FROM THE WEST COAST TO THE GREAT PLAINS BETWEEN THE 6-10 DAY AND 8-14 DAY PERIOD.
FORECAST CONFIDENCE FOR THE 8-14 DAY PERIOD IS: ABOUT AVERAGE, 3 OUT OF 5, DUE TO FAIRLY GOOD AGREEMENT AMONG THE MODELS, BUT A WITH AN ANTICIPATED SHARP NORTH-SOUTH GRADIENT IN TEMPERATURES MAKING CONDITIONS UNCERTAIN NEAR THE EXPECTED LONG-WAVE TROUGH POSITION.”
Analogs to Current Conditions
Now let us take a more detailed look at the “Analogs” which NOAA provides related to the 5 day period centered on 3 days ago and the 7 day period centered on 4 days ago. “Analog” means that the weather pattern then resembles the recent weather pattern and was used in some way to predict the 6 – 14 day Outlook.
What are they telling us today?
Analog Centered Day | ENSO Phase | PDO | AMO | Other Comments |
| 1957 November 9 | El Nino | Neutral | + | Probably a Modoki |
| 1958 November 4 | El Nino | Neutral | + | Not recognized as an El Nino under Asian criteria |
| 1968 November 25 | El Nino | – | – | Modoki Type II |
| 1968 November 26 | El Nino | – | – | Modoki Type II |
| 1977 November 26 | El Nino | Neutral | – | |
| 1977 November 27 | El Nino | Neutral | – | |
| 1980 November 20 | Neutral | + | – | |
| 1980 November 21 | Neutral | + | – | |
| 1982 November 26 | El Nino | + | – | A late El Nino that arrived weak but became strong |
| 1989 November 27 | La Nina | + | – | After a powerful La Nina |
The analogs are finally signalling both El Nino and changes to the phases of the AMO and PDO. Of most interest is the 1982 El Nino which arrived late and weak but evolved into a very strong El Nino.
El Nino Discussion
Now let us look at the latest NOAA Hovmollers.
First Sea Surface Temperatures

Over to the left side of the graphic at 160E at the bottom you can see where there has been some warm surface water. Also you see more pockets of warmer water further east. Overall it does seem to be becoming more widespread.
You can see why the official ENSO indicators are flashing El Nino “conditions” because the warm water is where those readings are taken.

Of most interest to NOAA is 120 W to 170 W as that is where the ONI Index is measured. More information can be found here. If you look at the color coding in the above Hovmoller there are looking for shades where the redder the better re conditions being El Nino but so far it is just showing shades of tan and brown i.e. marginal especially when averaged over the entire area of interest. But that explains why we have a situation where some of the factors are in place for an El Nino but so far it is marginal at best.
And now the low-level wind anomalies.

If anything, this looks less impressive than last week which you can tell by looking at the bottom of the chart. The bottom shows the most recent readings as this type of graphic is read from top to bottom.
The Southern Oscillation Index (SOI) is not cooperating and you can find the daily and 30 and 90 day averages here. With the SOI there is always a cause and effect issue. Is the SOI a cause of or a result of warm water being to the east? The SOI is an imperfect index as the two reference points are not on the Equator. The 30 day average is now marginal for El Nino conditions. Today’s reading is -4.6

which is not an El Nino reading. You can not deduce anything from one day but it reminds us that situations can change rapidly. Given that -0.8 is often considered the threshold for El Nino conditions you can see that August and October were actually more favorable for the development of an El Nino than November. The 30 (important) and 90 day averages of the SOI are very close to what is associated with an El Nino but certainly not anything to get excited about.
And then the third part of the equation (there are more than three but I focus on three): Kelvin Waves.

And here we do have a signal of warm water moving east but it does not have the intensity of the the Kelvin Wave earlier this year but it does seem to be a bit more potent than the prior Kelvin wave. It is important to remember that warm water at the surface is more prone to evaporate thus transferring heat from the ocean into the atmosphere and thus dissipating the warm water anomaly at the sea surface. That is one reason why the El Nino phase of ENSO is generally short lived.
I believe that this Kelvin Wave is the only reason for continued optimism that we will have an El Nino this year but it will be late arriving if it arrives at all. At some point we would expect to see the upwelling phase showing on this graphic which indicates the reversal of the surface warming and probably the termination of this El Nino or its transformation into a Modoki i.e. a Central Pacific El Nino which behaves very differently in terms of weather impacts than a traditional/canonical El Nino. At this point there is no sign of an upwelling wave and even just a hint at the left hand side of the diagram of yet another downwelling wave forming. That will be clearer next week.
So this continues to look to me like a weak version of the 1982/1983 El Nino and may last longer than NOAA thinks but have different impacts than they think also. We shall see. I am still thinking the Japanese (and the Australians) sized this up from the start and that this is really more like a Modoki than a traditional El Nino and that weather patterns will be shifted some number of degrees further west than would be the case for a traditional El Nino.
I still do not see a traditional El Nino of any significant strength likely to happen this winter, especially the first half of the winter. It appears to be a very complicated situation. There are many possibilities on the table in my opinion:
- A short weak traditional El Nino which arrives late. (The NOAA projection)
- A weak traditional El Nino arriving late but being reinforced and turning into a long lasting stronger traditional El Nino. (Not forecast by NOAA but not inconsistent either) This would be somewhat like the 1982/1983 Super El Nino but not likely to be strong this year.
- A weak traditional El Nino that turns into a Modoki next year (The Japanese Forecast)
- Nothing much at all at least until next summer (seems to be where the Australia model was headed although their assessment recently has come more in line with that of NOAA)
- Other variations of the above all related to warmer water further east than usual in the ENSO cycle but not necessarily translating into the usual El Nino that would normally be here now if it fit the usual mold.
Click Here for the Econointersect Weather and Climate Page where you will find:
- NOAA and other agency graphics (including international agencies) that auto update. So this includes both short term- and seasonal “updates”. It will ALWAYS be up to date even if my commentary on the graphics is not. I update my commentary when it seems necessary and certainly every Monday but some of these graphics auto update every six hours. This section of the report has been reorganized to make it easier to follow.
- Economic and other Impacts of major weather events. Not sure there is any other place to obtain this information consistently other than very specialized subscription services.
- Information on Climate Cycles both those which are fairly short term i.e. less than a decade in duration and multi-decadal cycles.
- Economic and other Impacts of those Climate Cycles which are referred to by the IPCC as Internal Variability as opposed to secular Climate Change which is always in the same direction. Again I am not sure if there is another source for this information where it is pulled together in one place as I have.
- Information on Anthropogenic Global Warming science i.e. the secular change in our climate that overlays both short term weather and historical climate cycles as well as black swan events like volcanic eruptions. I prefer to call this Global Warming as it is the warming that triggers the other changes.
- Economic and other Impacts of Global Warming. The IPCC AR5 WG2 attempts to describe and quantify these and I have some excerpts from their report. Over time I will go beyond their report.
For now this is all in one article which may be a little difficult to navigate but that will soon change and the information will be accessed easily by topic. I have included a Table of Contents but so far have not implemented hyperlinks to move quickly to topics of most interest. For now you have to scroll down.


