
Econintersect Climate and Weather Update 13 October 2014
Written by Sig Silber
If this is what we get with an El Nino, I think I prefer La Nina. Some suggest that November will show a change in the Pacific so the seasonal update due out this Thursday will be interesting, but I am not sure that NOAA is ready just yet to get real. There seems to be a divide between how the Pacific is assessed by the U.S. as compared to Asia. Perhaps a review of the forecasting models may be in order.

Let’s begin by taking a close look at the 6 – 14 day outlook issued today, October 13, for the U.S.
I am only showing the “second week” namely the day 8 -14 outlook. The first week can be found in Part II of my report but 8 – 14 days covers most of the 6 – 14 day period and does not vary much from the first part of the outlook issued today.
Here is the updated temperature outlook for October issued on September 30.

And here is the 8 – 14 Day Temperature Outlook issued today.

There is no resemblance between the two. Of course a month forecast does not necessarily agree with a 9 day portion of a month but this does seem to be unusual.
And here is the updated October Precipitation Outlook issued on September 30.

And here is the Precipitation Outlook issued today.

As with temperature, there is no resemblance between this mid-month precipitation outlook and the full month outlook.
Let’s take a look at the key parts of the discussion which was released with today’s 6- 14 day Outlook.
“6-10 DAY OUTLOOK FOR OCT 19 – 23 2014
ANOMALOUS ONSHORE FLOW IN NORTHERN ALASKA AND THE ALASKA PANHANDLE FAVORS ABOVE MEDIAN PRECIPITATION IN THOSE AREAS, WHILE ANOMALOUS OFFSHORE FLOW FAVORS BELOW MEDIAN PRECIPITATION FOR MUCH OF SOUTHWESTERN ALASKA. ANOMALOUS TROUGHING OFF THE PACIFIC NORTHWEST COAST AND ONSHORE FLOW FAVOR ABOVE MEDIAN PRECIPITATION THERE, INCLUDING PORTIONS OF NORTHERN CALIFORNIA. MUCH OF THE REST OF THE CONUS IS FORECAST TO BE UNDER THE INFLUENCE OF ANOMALOUSLY HIGH SURFACE PRESSURE, SUPPRESSING PRECIPITATION AND INCREASING THE CHANCES FOR BELOW MEDIAN PRECIPITATION. THE EXCEPTION IS PORTIONS OF SOUTHERN FLORIDA, WHERE A TRAILING COLD FRONT IS FORECAST BY SOME OF TODAY’S MODELS TO SUPPORT POSSIBLE TROPICAL ACTIVITY. THE UNCERTAINTY IS VERY HIGH, HOWEVER, AND THERE’S A GOOD CHANCE ANY ACTIVITY WILL REMAIN DISORGANIZED. NEVERTHELESS, THE POTENTIAL FOR INCREASED RAINFALL IS THERE, FAVORING NEAR TO ABOVE NORMAL HEIGHTS FOR THE FLORIDA PENINSULA.
8-14 DAY OUTLOOK FOR OCT 21 – 27 2014
THE WEEK-2 FORECAST PATTERN IS VERY SIMILAR TO THE 6-10 DAY FORECAST PATTERN, THOUGH THE ANOMALIES ARE SOMEWHAT WEAKER AND UNCERTAINTY IS NATURALLY HIGHER. THE RIDGE OVER THE CENTRAL CONUS AND THE TROUGH OVER THE EAST ARE EXPECTED TO BE SHIFTED SLIGHTLY EASTWARD IN THE WEEK-2 PERIOD, COMPARED TO THE 6-10 DAY PERIOD. THE TEMPERATURE PROBABILITY FORECAST IS SIMILAR IN WEEK-2, WITH A COUPLE OF DIFFERENCES NOTED. IN ALASKA, THE PERSISTENCE OF ANOMALOUS NORTHERLY WINDS IS LESS CERTAIN, SO BELOW NORMAL TEMPERATURES ARE NO LONGER FAVORED IN SOUTHWESTERN ALASKA. THE TEMPERATURE PROBABILITY PATTERN IS ALSO SHIFTED A BIT EASTWARD, COMPARED TO THE 6-10 DAY PERIOD, AS THE PATTERN IS EXPECTED TO BE SHIFTED SLIGHTLY EASTWARD. THE PRECIPITATION PATTERN IS SIMILAR AS WELL. NEAR MEDIAN PRECIPITATION IS NOW FAVORED ALONG THE GULF COAST AND MID-ATLANTIC COAST DUE TO THE POTENTIAL FOR INCREASED STORM ACTIVITY FORECAST BY SOME OF TODAY’S MODELS ALONG A TEMPERATURE BOUNDARY FORECAST OVER THE AREA DURING WEEK-2.
Notice that with respect to temperature, the warmer than climatology area has expanded to cover the western two-thirds of the Lower 48 with the Southeast being colder than climatology. The precipitation outlook in the October 19 – October 27 period is very different from the recently issued full month outlook with a dry center of the Lower 48 with a wetter than climatology Northwest and Southeast.
Now let us take a more detailed look at the “Analogs” which NOAA provides related to the 5 day period centered on 3 days ago and the 7 day period centered on 4 days ago. “Analog” means that the weather pattern then resembles the recent weather pattern and was used in some way to predict the 6 – 14 day Outlook.
What are they telling us today?
Analog Centered Day | ENSO Phase | PDO | AMO | Other Comments |
| 1959 Oct 12 | Neutral | – | + | |
| 1974 Oct 13 | La Nina | – | – | |
| 1973 Oct 15 | La Nina | – | – | |
| 1980 Sept 28 | Neutral | + | – | |
| 1980 Sept 29 | Neutral | + | – | |
| 1995 Oct 16 | La Nina | + | – | Right before the AMO went positive |
| 1995 Oct 17 | La Nina | + | – | Right before the AMO went positive |
| 2009 Oct 23 | El Nino | – | + | Modoki Type II |
| 2009 Oct 24 | El Nino | – | + | Modoki Type II |
The analogs are providing a mixed picture but certainly not indicating El Nino conditions applied relative to the Analogs. Of course this can change quickly. The analogs now suggest a later than usual Fall rather than an earlier than usual Fall.
El Nino Update.
This from Australia
Neutral, but El Niño WATCH remains
Issued on Tuesday 7 October 2014
Tropical Pacific Ocean ENSO indicators remain within the neutral range, having failed to maintain sustained values typical of El Niño. However, given the persistent warmth in the tropical Pacific Ocean, models continue to suggest an El Niño remains possible during the last quarter of 2014.
Atmospheric indicators of El Niño have remained neutral over recent months. Tropical cloud patterns and trade winds have only had brief periods with El Niño-like values since May. Despite a recent drop into El Niño territory, the Southern Oscillation Index (SOI) has returned to neutral values over the past fortnight.
Model outlooks and current observations mean the Bureau’s El Niño WATCH remains in place, indicating double the normal chance (50%) of an El Niño over the coming months.
While still falling short of El Niño thresholds, the tropical Pacific Ocean remains warmer than average. When combined with recent cool water to the north of Australia, conditions favour below-average rainfall over much of Australia for the remainder of 2014.
The Indian Ocean Dipole (IOD) has returned to neutral recently after being consistently negative since June. Climate models surveyed by the Bureau indicate neutral conditions are very likely to remain during the last quarter of 2014.”
Let us look at the latest NOAA Hovmollers.
First Sea Surface Temperatures

Over to the left side of the graphic at 160E at the bottom you can see where the past two weeks looked like there might be some warming surface water. It is now more easily visibly this week. It is still not very impressive and appears to be becoming less of a factor and it is not yet moving east but it could become important down the road. See the later reference to the analysis by Bob Tisdale who probably tracks El Nino as carefully as anyone and who is paying careful attention to that part of the Pacific both the surface and subsurface as we do have sub-surface data along the Equator.
And now the low-level wind anomalies.

I noticed the westerly anomaly last week and it has dissipated a bit and to the right of it I also noticed an easterly anomaly which has expanded except close to shore. So that is the dynamic right now. Which will prevail? The Southern Oscillation Index (SOI) is still not cooperating or consistent with an El Nino. The daily readings from my source, the Queensland Australia Bureau of Meteorology, have not been updated since Friday (which is unusual) but the recent values have been the opposite of what is needed for an El Nino to grow.
And then the third part of the equation (there are more than three but I focus on three): Kelvin Waves.

And here we do have a signal of warm water moving east but it does not have the intensity of the Kelvin Wave earlier this year. Notice looking up at earlier dates that some Kelvin Waves fizzle out but this one does not seem to be fizzling out but continues to progress east. It is important to remember that water water at the surface is more prone to evaporate thus transferring heat from the ocean into the atmosphere. That is one reason why the El Nino phase of ENSO is generally short lived.
I believe that this Kelvin Wave is the only reason for continued optimism that we will have an El Nino this year but it will be late arriving it it arrives at all. At some point (probably fairly soon) we would expect to see the upwelling phase showing on this graphic which indicates the reversal of the surface warming and probably the termination of this El Nino or its transformation into a Modoki i.e. a Central Pacific El Nino which behaves very differently in terms of weather impacts than a traditional/canonical El Nino.
Bob Tisdale in my opinion does the most thorough job of assessing the progress of ENSO events and he recently issued this analysis. Notice the comparison he is now making is with the 2009 El Nino which turned out to be a Modoki Type II. Warm water off the coast of Alaska is the tip off that what may be developing could be a Modoki Type II which for the U.S. will behave more like a La Nina than a typical El Nino.
I do not see a traditional El Nino of any significant strength happening this winter. I believe that at some point NOAA will have to get real.
Now let us look at our oceans.
From Japan Met Global Environment and Marine Department Report
“The annual mean annual global average sea surface temperature in 2013 was +0.13°C above the 1981-2010 average, making it the 2nd highest since 1891. The long-term trend of the global average sea surface temperature for 1891-2013 was about 0.51°C per century. Although positive anomalies above the long-term trend have frequently been observed since the late 1990s, the global average sea surface temperature has generally remained at similar levels since the early 2000s.”
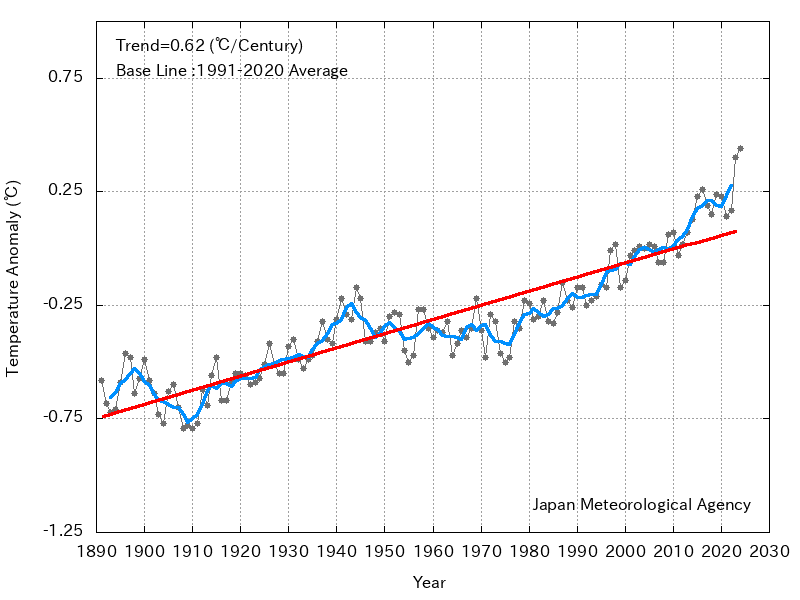
So clearly our oceans are getting warmer, but very slowly.
And this is a very interesting table (you can click on it to enlarge it) prepared by Bob Tisdale and you can find the full article here.
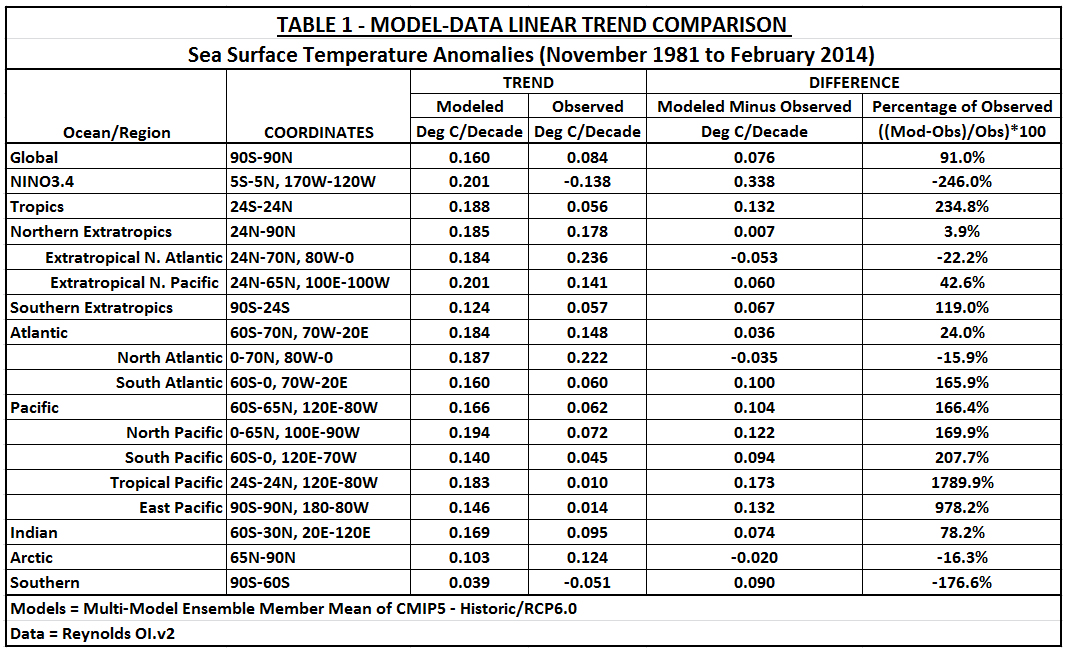
It shows the results of running the latest IPCC models from 1981 (using the RCP 6.0 scenario which in my mind is probably the most realistic of the four) and compares the model results with the observed values. This provides a lot of useful information. 1981 was an ENSO neutral year and PDO had recently turned positive and the AMO was solidly negative. The starting point is very significant when comparing observed values with the IPCC model results because the IPCC models have no ability to integrate low-frequency cycles like the AMO and questionable ability to integrate medium frequency cycles like ENSO.
So you see that:
A. Overall the models have been high by about 100% re sea surface temperatures. That is a large forecasting error.
B. Probably much of this has to do with the AMO which unlike many ocean cycles actually has a warm phase and a cold phase. This is different than the PDO which is really about the geospacial distribution of warm and cold water rather than the warming and cooling of the Pacific although the index every once in a while is adjusted to reflect the overall warming of the Pacific.
So you can see there is a lot of variability in the warming of the sea surface temperatures. There has been a lot of discussion about sub-surface temperatures but we have even less monitoring of that overall and weather is determined by the surface temperature. The subsurface temperature is a good guide to what future surface temperatures will be.
It should be obvious that the IPCC has a long way to go to improve their models to have them be reliable. That is especially true in terms of predicting the next fifty years. Many government agencies use the IPCC model results for planning purposes and that is foolhardy. The IPCC models were not designed for that purpose and the fact that many government agencies use the IPCC model results and downscale them to their local area raises some serious questions about the competence of those working for those agencies. The worse offender appears to be the U.S. Bureau of Reclamation. They may be subjecting the U.S. Government to some serious legal liability.
A professional should be expected to understand the limitations of models that they utilize. A professional who uses a model that they do not understand is I believe subject to tort liability. There is a presumption that a consultant is qualified to perform the work that they undertake and if so qualified they are generally not responsible for errors. But if they misrepresent their qualifications to take on an assignment, they are I believe at risk. I anticipate that legal action will be part of our future due to the misuse of the IPCC Models by those who simply do not understand their limitations for short-term forecasting.
I found this graphic developed by Bob Tisdale quite interesing and his full article on this can be found here.
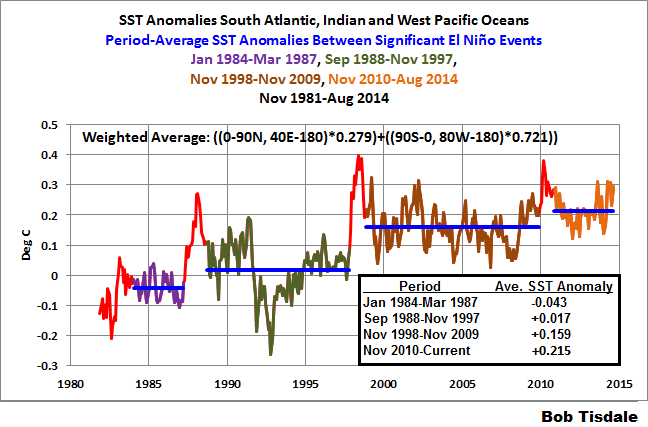
He and I strongly disagree on how to interpret the above. Bob Tisdale seems to be taking the position that ocean cycles not GHG are the cause of Global Warming. I disagree but do agree that ocean cycles influence the timing of both SST and atmospheric warming. The staircase phenomenon was discovered by British Met and I wrote about it at that time and my article can be found here.
Finally at this point both the PDO and AMO are positive. A few months readings are not highly reliable but if that patterns continues the U.S. pattern of drought will change as per below.
The seminal work on the impact of the PDO and AMO on U.S. climate can be found here. And here is a later version but I do not have a link that shows it in color but I believe the maps have not changed from the earlier version.
The key maps are shown below:

Drought frequency (in percent of years) for positive and negative regimes of the PDO and AMO. (A) Positive PDO, negative AMO. (B) Negative PDO, negative AMO. (C) Positive PDO, positive AMO. (D) Negative PDO, positive AMO.
We could be moving from condition D to C which would have a big impact on precipitation patterns in the U.S. It will also impact Europe and Africa and this is discussed to some extent in Part II of my report.
Click here for the Econintersect Weather and Climate Page Where You will Find:
- NOAA and other agency graphics (including international agencies) that auto update. So this includes both short term- and seasonal “updates”. It will ALWAYS be up to date even if my commentary on the graphics is not. I update my commentary when it seems necessary and certainly every Monday but some of these graphics auto update every six hours. This section of the report has been reorganized to make it easier to follow.
- Economic and other Impacts of major weather events. Not sure there is any other place to obtain this information consistently other than very specialized subscription services.
- Information on Climate Cycles both those which are fairly short term i.e. less than a decade in duration and multi-decadal cycles.
- Economic and other Impacts of those Climate Cycles which are referred to by the IPCC as Internal Variability as opposed to secular Climate Change which is always in the same direction. Again I am not sure if there is another source for this information where it is pulled together in one place as I have.
- Information on Anthropogenic Global Warming science i.e. the secular change in our climate that overlays both short term weather and historical climate cycles as well as black swan events like volcanic eruptions. I prefer to call this Global Warming as it is the warming that triggers the other changes.
- Economic and other Impacts of Global Warming. The IPCC AR5 WG2 attempts to describe and quantify these and I have some excerpts from their report. Over time I will go beyond their report.
For now this is all in one article which may be a little difficult to navigate but that will soon change and the information will be accessed easily by topic.


