
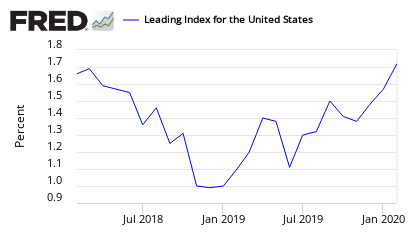
Econintersect: The July forecast now shows growth is projected at 1.6% over the next 6 months. A positive index number projects positive economic growth for the next 6 months. A review of all major leading indicators follows – and no leading index is particularily strong.
A positive number indicates growth.
The Federal Reserve Bank of Philadelphia has released the leading indexes for the 50 states for July 2014. The indexes are a six-month forecast of the state coincident indexes (also released by the Bank). Forty-five state coincident indexes are projected to grow over the next six months, while five are projected to decrease. For comparison purposes, the Philadelphia Fed has also developed a similar leading index for its U.S. coincident index, which is projected to grow 1.6 percent over the next six months.

This index has been noisy, but remains above 1%.
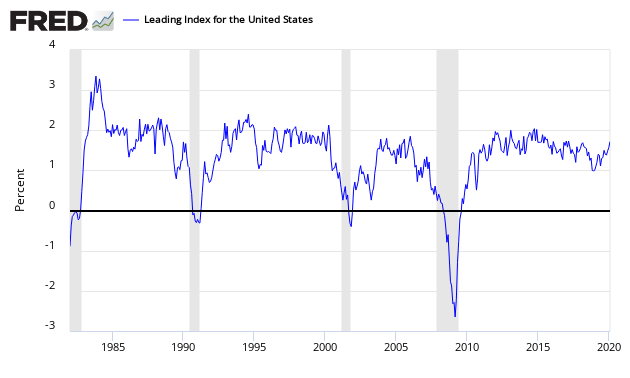
This index is subject to backward revision.
The Other Leading Indicators
The leading indicators are to a large extent monetary based. Econintersect‘s primary worry in using monetary based methodologies to forecast the economy is the current extraordinary monetary policy which may (or may not) be affecting historical relationships. This will only be known at some point in the future. Econintersect does not use any portion of the leading indicators in its economic index. All leading indices in this post look ahead six months – and are all subject to backward revision.
Chemical Activity Barometer (CAB) – The CAB is an exception to the other leading indices as it leads the economy by two to fourteen months, with an average lead of eight months. The CAB is a composite index which comprises indicators drawn from a range of chemicals and sectors. Its relatively new index has been remarkably accurate when the data has been back-fitted, however – its real time performance is unknown – you can read more here. A value above zero is suggesting the economy is expanding. Econintersect‘s analysis of this index is [here].

/images/z chemical_activity_barometer.png
ECRI’s WLI has been predicting economic expansion for over a year. Econintersect‘s review of this index is [here].
Current ECRI WLI Index

The Conference Board’s Leading Economic Indicator (LEI) – Looking at the historical relationships, this index’s 3 month rate of change must be in negative territory many months (6 or more) before a recession occurred. Ths index is in positive territory and improving – implying any recession is months away. Econintersect’s review of this index is [here].

Nonfinancial leverage subindex of the National Financial Conditions Index – a weekly index produced by the Chicago Fed signals both the onset and duration of financial crises and their accompanying recessions. Econintersect has some doubt about the viability of this index as its real time performance has been subject to significant backward revision. In other words the backward revision is so large that one really does not know what the current situation is. The chart below shows the current index values, and a recession can occur months to years following the dotted line below crossing above the zero line.

Leading Indicators Bottom Line – no recession in the next six months:
- Chemical Activity Barometer (CAB) is in expansion territory, and growth is accelerating marginally.
- ECRI’s WLI remains positive – and growth rate is currently decelerating.
- The Conference Board (LEI) is indicating modest and accelerating growth over the next 6 months.
- The Philly Fed’s Leading Index is indicating moderate economic growth – but the rate of growth will be unchanged.
- The Chicago Fed’s Nonfinancial leverage subindex is not warning a recession could be near.


