by Lee Adler, Wall Street Examiner
The seasonally finagled headline number for weekly initial unemployment claims was 311,000 last week, soundly trouncing the consensus wild guess of the Wall Street conomist crowd, who were looking for 330,000.
Seasonally adjusted (SA) data represents an idealized, fictional, dumbed down, smoothed, abstract impressionistic version of reality that is supposed to more clearly represent the trend. Admittedly, sometimes it comes close, but sometimes it doesn’t.

Rather than using the faked data that the mainstream media loves to idiotically parrot, I like to look at the actual number of claims reported to the Department of Labor (DOL) each week by the 50 state unemployment departments. When that actual data is plotted on a chart with a few filters it’s easy to see the actual trend. It’s easy to see whether the most recent data shows any material deviation from the trend. This is, in essence, the application of technical analysis to economic data. If you like charts and trendlines, you like this method. If you like smooth abstract impressionist propaganda, stick with the news headlines.
The media ignores it, but the DOL dutifully reports the actual not seasonally adjusted (NSA) data right along with the SA data each week. Here’s what it had to say today about last week:
The advance number of actual initial claims under state programs,unadjusted, totaled 273,411 in the week ending March 22, a decrease of 12,559 from the previous week. There were 315,620 initial claims in thecomparable week in 2013.
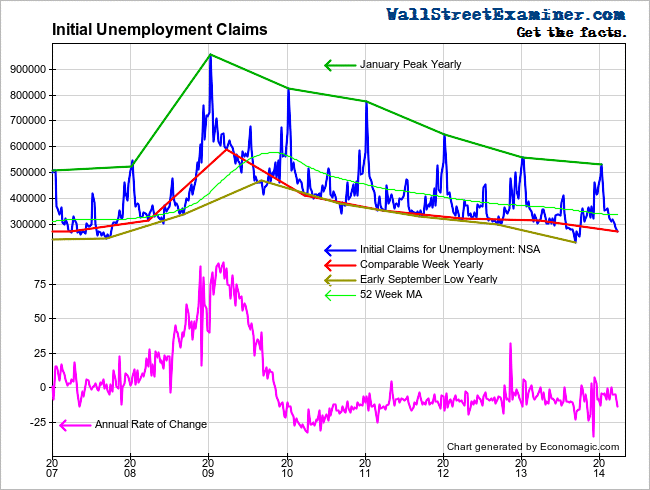
As a critical observer, I want to know how this compares with the trend, along with how this week’s change compares with the same week last year and with the historical average for the comparable week. It’s like going to the optometrist. Is it better or worse than the trend? Is it better or worse than average? Is it better or worse than this week last year? That information helps to make clear whether anything is actually changing, or if job losses are simply moving along the same curve which they’ve been on all along, subject to minor short term random squiggles.
In that vein, the drop of -12,559 last week compares with an increase of +14,669 in the comparable week last year.The current week was a good deal stronger than the same week last year. The 10 year average for the comparable week was a drop of -8,700. The current week was slightly better than that, not materially so. It was a pretty good week, all told.
The year to year rate of change was a decline of 13.4%. That is a significant strengthening from the momentum of the trend since January, which was typically in the zero to -5% range, and had been decelerating toward zero. However, while stronger than the past 3 months, it is consistent with the rate of change of the past 4 years since the recovery stabilized in mid 2010 following the initial bungee rebound from the extreme of 2009.

Initial Unemployment Claims Drop – Click to enlarge
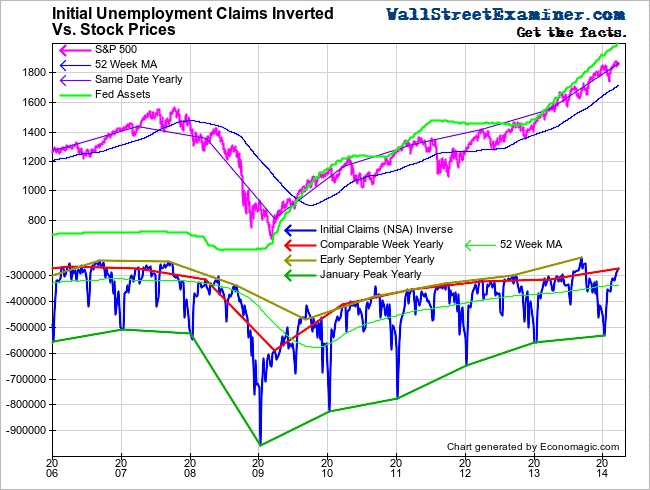
While the Fed’s QE program has had great success in its true intended goal of inflating stock prices (see Bernanke’s November 2010 Washington Post oped), it had no measurable impact on the rate of job losses. Those have remained in a stable trend for 4 years whether QE was going full blast or was in a long pause as in mid 2011 through late 2012. It was then that the Fed suddenly and inexplicably panicked and launched QE3-4.
Rampant speculation triggered by an inexhaustible supply of guaranteed free money for wild eyed leveraged speculators (but not for Ma and Pa Saver) has no impact on creating real jobs or real wealth. It only creates massive speculative bubbles, which eventually crash and have the unfortunate side effect of destroying real jobs.
Are approaching that point. Timing is, as always, the issue.

Stock Bubble Rages as Jobless Claims Slow At Steady Rate – Click to enlarge
How much is too much of a good thing? Current weekly initial claims of 273,411 is the lowest rate for this week since March of 2007 when it hit 273,432. That was just a few months before the stock market and economy began their epic collapse. It was when nobody at the Fed or in the Wall Street shill community, or among the mainstream reporters who curry their favor, saw any major problems on the horizon. They saw only hints of minor problems, which they thought could be easily contained with a few policy tweaks. Meanwhile, those of us on the outside looking in were screaming that the market and economy were in a massive credit and housing bubble that were collapsing.
A year earlier, in the comparable week of March 2006, in the dying days of that massive bubble, there were 265,370 initial jobless claims. That was equivalent to 0.2% of total nonfarm payrolls that month. In March of 2006, all looked rosy to the mainstream crowd. To them, there were no black clouds on the horizon.
The current weekly reading of the ratio of initial claims to nonfarm payrolls is…drum roll please… 0.2% of total nonfarm payrolls. By that standard, the current ZIRP-QE free money driven bubble, like the one in 2006, may have reached the as-good-as-it-gets stage. But this time really is different.
Or is it? The Fed stopped expanding its balance sheet in May of 2007. It is making noises about doing the same this time within just a few months. Once the unthinkable is done and the spigot is turned off, I suspect that this time won’t be different, or that if it is, it will be because it’s worse–a bigger, badder bubble–a central bank balance sheet bubble–with a bigger badder aftermath.


