by Lee Adler, Wall Street Examiner
Last week’s new home sales report from the Census Bureau triggered an ebullient response. Big media used words like “surge; soar; rise sharply; above expectations” to describe it.

The Wall Street Journal said:
“Sales of new, single-family homes rose by 5.7% to a seasonally adjusted annual rate of 552,000.”
The headline number they reported reflected the monthly seasonal adjustment and sampling error multiplied times 12. The number crushed analysts’ expectations. The pundits were giddy.
So what is the reality behind that headline number? In honor of the great Yogi Berra, I quote one of his most insightful quips. “You can observe a lot by watching.” I have been carefully watching the actual data in this report for many years. I have had the benefit of “watching” from the perspective of having had my boots on the ground. I sold houses, including new houses, early in my working life. I also worked for many years as a commercial real estate appraiser, where I frequently appraised new housing developments, both pre-development, during the sellout period, and in some cases, after they failed. I have experienced first hand how people actually act when purchasing houses.
So with that perspective, here are a few points that Big Media didn’t mention, that I think are important. First, the Census Bureau prominently points out that their headline, annualized, seasonally finagled number has an error range of +/- 16.2% at a 90% confidence interval. In other words, the headline number could be 641,000 when all the data is in, or it could be 463,000.
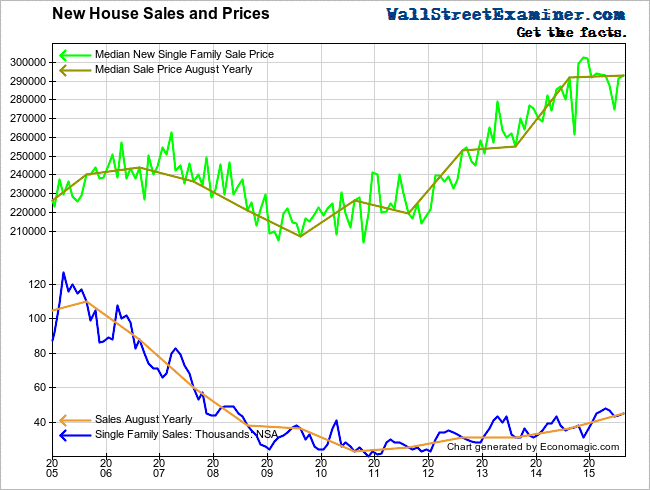
The Bureau estimated from its actual count of building permits plus a statistically derived estimate of contracts signed where permits had not yet been pulled, that 45,000 new houses sold (went under contract) in August. The Bureau will continue to hone in on the actual number over the next 4 months as more data becomes available from builders.
45,000 is 1,000 more than the July estimate. That’s actually pretty good, because over the past 10 years, August has typically been a down month from July, with an average decline of 2,000 units. This year the August gain was similar to last year’s 1,000 unit increase for the month. The total of 45,000 units was 25% higher than August 2014’s 36,000 units. And it is almost double the August 2010 total of just 23,000 units.
Liquidity moves markets!
Click here to learn how you can follow the money.
That sounds great, until you compare it with August 2005’s 110,000 sales. Of course, that was the top of the great housing bubble. So to get an idea of how 45,000 fits historical data, I calculated the average for August going back to the beginning of the data in 1963, when US population was less than half of what it is today. I calculated through August 2003, before the housing bubble really exploded. Average August sales over that 4 decade era totaled 59,000. The current figure for August is just 75% of the long term average for the month.
Ben Bernanke frequently justified ZIRP and QE because he said it would stimulate housing. So it bears pointing out that with ZIRP and QE the housing industry is at 75% of the average level for a 40 year period when there was no QE and mortgage rates were ALWAYS substantially higher than they are today. There were periods where mortgage rates where quadruple where they are today and sales were 50% or more higher than they are today.
I remember just how high mortgage rates were when I was selling houses in 1979 and 1980 in Center City Philadelphia. In August 1979, the 30 year fixed rate averaged 11.3%! 68,000 houses sold in the US that month. In August 1980, the mortgage rate had risen to to 12.6%. 61,000 houses sold that month.
Prior to that, the lowest August sales got was in August 1974, during the Watergate era, an energy crisis, and the worst bear market in stocks since the Great Depression. That month, sales were 45,000 units. Nixon had resigned on August 9.
From August 1974 through August 1978, mortgage rates were always in the 9% range, triple where they are now. Sales rose from 45,000 units in 1974 to 72,000 in 1978. They only began to materially decline when mortgage rates hit double digits. That effectively shut down the market until the mid 1980s.
So high rates did not appear to suppress the market until they hit double digits. Do low rates stimulate housing demand? In recent years there’s been a correlation, but there has also been a correlation with rising prices which reduces effective demand as house payments increase beyond the ability of increasing numbers of people to afford. Had rates been higher and prices lower, there would have been a tradeoff. Unfortunately, by printing money and pushing mortgage rates down, the Fed has pushed prices up commensurately, making the market now utterly dependant on low rates even at this depressed level of sales volume. If rates rise now, it is all but certain that there will be negative effects, either falling prices, or reduced sales volume. The Fed may give lip service to rising rates, but it has created a Gordian knot. It’s not mysterious why it is so reluctant to take any step toward a rate increase. Just like a drug pusher creates a dependent drug addict, the Fed have created an economy that is addicted to zero.
Low rates have clearly stimulated higher prices. That’s actually what the Fed wanted and why the Fed keeps saying it wants more inflation, because it makes the massive US housing debt look more secure when the collateral appears to be worth more. However, that’s a false impression created by limited supply in the existing home market. If more people sell, prices will fall and the collateral value will fall. Loans that appear backed by good collateral now will sink back below the water line and the jingle mail phenomenon will return. The value of the debt would not look as good as it does when inventory is restricted.
ZIRP restricts inventory because it discourages empty nesters from liquidating to invest in fixed income for retirement. Instead, they hold on to their properties. Allowing rates to rise to a reasonable degree would encourage some people to liquidate. The quid quo pro is that as rates rise, the demand pool shrinks. The act of printing money and forcing rates to zero has locked the market into these conditions permanently. There’s no way out that does not involve immense pain.
In the end, what ZIRP has given us is record high new home prices, and new home sales that are still at a historically depressed rate.
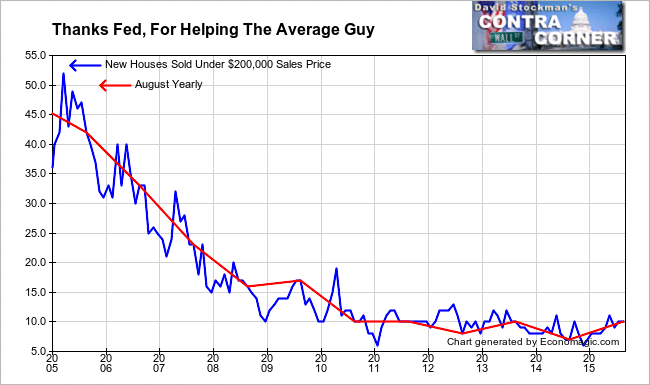
Because builders like profits, and it’s easier to sell fewer houses with bigger profits to people with more money, that’s what they do. Since the recovery began, all of the action has been in the higher price range. The benefit of Bernanke’s desire to help people spend money on housing has only accrued to those in the upper reaches of the income spectrum. As for the rest, there’s no trickle. The trickle has pooled at the top. There is no soup for the average Joe.
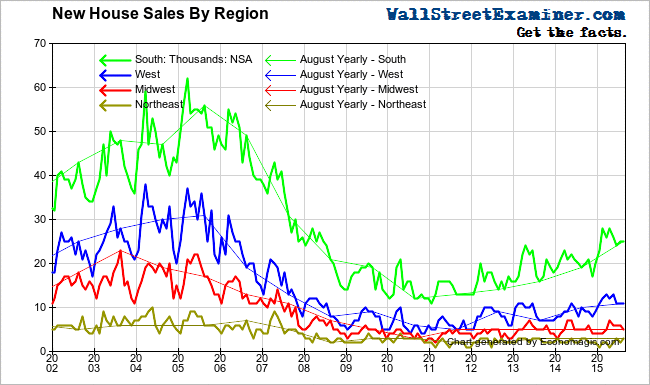
Lest you think that the increase in new house sales is a sign of a broad economic recovery, think again. All of the growth in housing has been in the South and West. The trend largely reflects migration of retirees as the huge baby boomer cohort departs their existing homes up north and heads for the sunshine. There has been no recovery and no growth in the Northeast or Midwest.
The vast majority of the new jobs being generated in this economy will not support the purchase of a house. Low interest rates won’t help that. In fact, by stimulating housing inflation, it exacerbates the problem. Those at the median income of $53,657 and below are hit disproportionately by house price inflation and rent inflation. These items are suppressed in the government measures of inflation particularly the PCE measure favored by the Fed. When a family is paying 40-50% of its income in rent, and rents are rising at 5-6% per year, their experience of inflation is very different than the sub 2% readings the US government has been reporting. Their purchasing power is being destroyed as their wages fail to keep up with their actual cost of living.
So the Fed continues to pursue policy that benefits the few at the expense of the many. As the majority struggle to keep up, they exert an ever increasing drag on the US economy. They are unable to sustain even a constant volume of purchases that contribute to the growth of the US economy. The upper income strata cannot carry the ever increasing share of the load necessary to drive increases in top line total measures of the US economy.
Yes, second quarter GDP did have an upward blip, but withholding tax data for Q3 (reported weekly in the Federal Revenues Pro Trader reports), shows the economy coming back to earth with a thud, with real growth barely above 1% year over year. In the not too distant future, the depression in the middle class will overtake the party at the top and total US economic growth measures will turn negative.
See also August 2015 New Home Sales Improves (GEI Economic Release).


