
by Timothy Taylor, Conversable Economist
“America’s commerce with the rest of the world must be and always is balanced when taking into account investment flows as well as the exchange of goods and services. … [O]ne key insight for public policy is that the total outflow of dollars each year from the United States to the rest of the world is matched by an equal inflow of dollars from the rest of the world to the United States. There is no need to worry about a `leakage’ of dollars siphoning off demand from the domestic economy. Dollars spent on imported goods and services return to the United States, if not to buy US goods and services, then to buy US assets in the form of an inward flow of investment. … When we account for all the dollars flowing into the United States, with an adjustment for the statistical discrepancy, it totals the exact same amount. The difference between dollars flowing out and dollars flowing in each year is zero.”

Please share this article – Go to very top of page, right hand side for social media buttons.
Thus writes Daniel Griswold in “Plumbing America’s Balance of Trade,” a paper published for the Mercatus Center at George Mason University. For noneconomist readers, Griswold’s statements may seem ideological or controversial. For those who needed to learn about trade statistics at some point, his statements are so obviously true–true as a matter of how the underlying terms are defined–that even writing them down feels pointless. To steal a phrase from Alan Walters (who was writing about how Milton Friedman’s effort to revise monetarism was perceived during the 1950s), it’s like “flogging a decomposing horse.” Here, I’ll take a stroll through the US trade statistics for 2016 as published by the US Bureau of Labor Statistics, making heavy use of Griswold’s explanations. Even for those familiar with basic trade statistics, flogging this particular decomposing horse may offer a few insights or surpises.
Here is the data for 2016 on the US current account and capital account (terms to be explained in a moment) from the US Bureau of Economic Analysis:
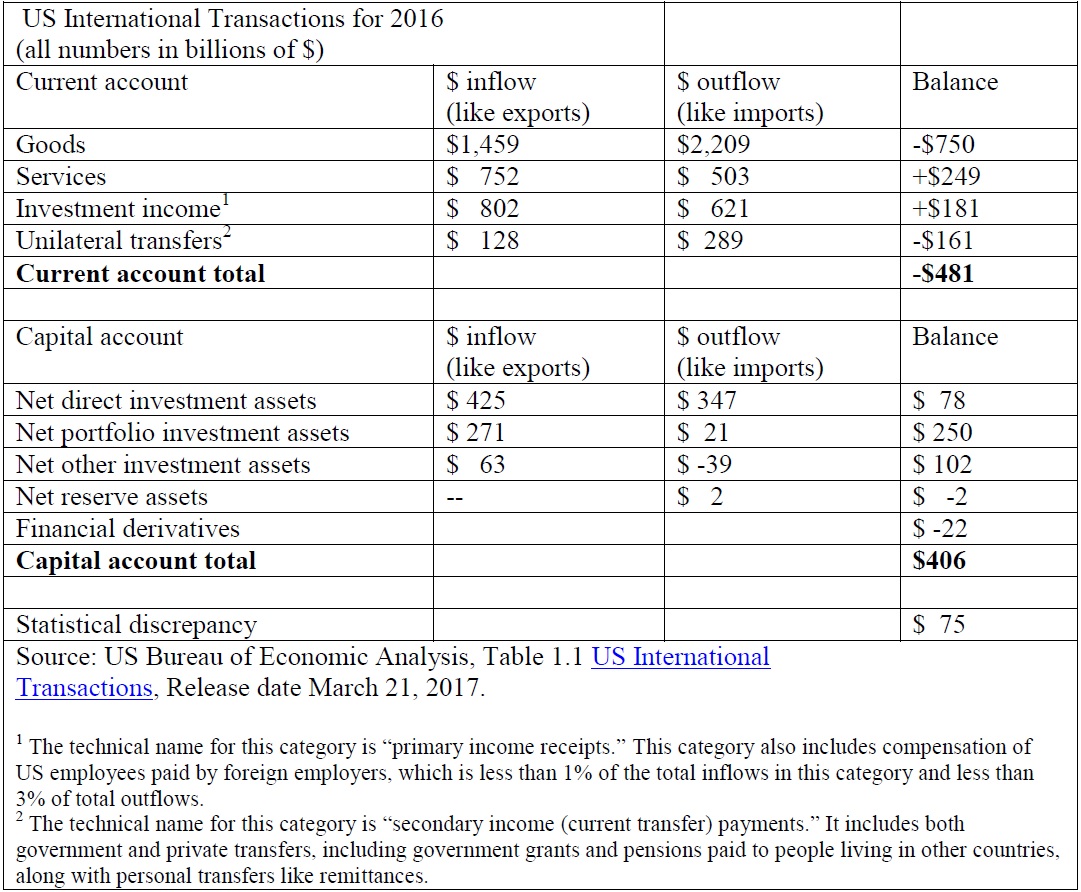
Start in the first row, with imports and exports of goods. In 2016, imports of goods exceeded exports by $750 billion, which is sometimes called the “merchandise trade deficit.” Griswold breaks this down into categories and notes that most of this trade in goods is about industrial supplies and inputs, not consumer products:
“The top two major categories of imports were (1) industrial supplies and materials and (2) capital goods except automotive goods. Together they account for 54 percent of US merchandise imports. Consumer goods account for 24 percent more, and automotive vehicles, parts, and engines were 13 percent of imports. … On the export side, the biggest inflow of dollars from abroad was to buy US industrial supplies and materials, followed by capital goods (except automotive goods); together they account for almost two-thirds of US exports. Consumer goods accounted for another 12 percent, and automobiles and auto parts for about 10 percent.”
In the category of services, the US ran a trade surplus in 2016 of $249 billion. Tourism is a major industry in the international trade of services: for example, a German tourist visiting the US is the economic equivalent of an export, because someone from another country is buying hotel and travel and tourist services produced in the US. Again, here’s the breakdown from Griswold:
“The largest outflow of dollars for services was from Americans traveling abroad: 82 percent for personal travel and the rest for business travel. The next-largest category was “other business services,” which includes business and management consulting and public relations, as well as technical services such as architectural and industrial engineering. A close third for spending on imported services was transportation, primarily ocean freight and air passenger services.10 On the export (credit) side of the services ledger, the largest inflow of dollars was also generated by travel, three-quarters for personal travel to the United States, including travel for education. The next largest generator of inflowing dollars was charges for the use of intellectual property, chiefly for industrial processes, computer software, trademarks, and movies and television programming. Close behind were other business services, primarily business and management consulting and public relations services, research and development (R&D) services, and technical services. Other major service exports are transportation, with almost half of the dollar inflow generated by air passenger services, and financial services such as financial management and credit card and other credit-related services.
Economists also view income from investments made in other countries as a form of trade. Instead of someone from another country buying a good or service, they are paying for the use of US investment capital. As Griswold points out, an interesting pattern here is that the absolute size of foreign investment in the US economy is bigger than the absolute size of US investment in other countries, but the investment income received by US investors is larger than the investment income received by foreign investors. The underlying reason is that foreign investors are more likely to turn to the US markets for fairly safe assets, with a correspondingly low rate of return, while US investors are more likely to take on risk when investing abroad, for which they are compensated with a higher return. Griswold writes:
“Americans earn a surplus on investment income even though the stock of foreign investment in the United States is about one-quarter larger than the stock of what Americans own abroad. Across all categories of assets, Americans earn a higher rate of return on their overseas investments than foreigners earn on their investments in the United States. In total investment returns, Americans earned 3.3 percent annually on the annual average of $23.4 trillion in assets they owned abroad during the 2011–2015 period. They earned 7.2 percent on their direct investments, 3.2 percent on portfolio investments, and 0.4 percent on all other investments abroad, including bank deposits and loans.15 Compare that to the more modest 1.9 percent that foreign savers earned each year on the stock of $29.1 trillion they owned in US assets on average for each year during the same period. They earned 3.2 percent on their direct investments, 2.4 percent on portfolio investments, and 0.2 percent on all other investments—all lower returns than Americans earned on their overseas investments in the same class of assets. We see the financial and capital accounts offering the same win-win benefits of trade as the current account. Foreign savers are willing to settle for a lower return on their investments in the United States in exchange for the security and liquidity offered by the US capital markets. American savers, in turn, are able to realize greater returns on their investments in exchange for their willingness to take more risk in overseas assets.”
The category of unilateral transfers refers to both government and private transfers, including foreign aid, charitable donations that cross borders, and remittances that workers in one country send back to family and relatives in another country. Griswold gives details:
“Year after year since World War II, the United States has unilaterally sent more goods, services, and assets (or their dollar equivalent) abroad than it has received. The one exception was 1991, when the United States received more than $30 billion in contribution payments from allies in the Gulf War, tipping unilateral transfers to a surplus. In the half decade of 2011–2015, the United States sent an annual average of $252 billion abroad in unilateral transfers and received $121 billion, for an annual deficit of $131 billion. More than three-quarters of the outflow of dollars was for private transfers, chief among them insurance-related transfers; withholding taxes paid by US companies; charitable donations by US entities; and remittances, which are personal transfers from US resident immigrants to foreign residents. The rest of the unilateral transfers were US government transfers, primarily nonmilitary and military assistance provided to foreigners in the form of goods, services, or cash under programs enacted by the US Congress. Other government transfers include Social Security and retirement benefits paid to former US residents who live abroad, and contributions to international organizations and commissions to meet the financial obligations of membership and to fund United Nations peacekeeping operations. The smaller inflow of dollars for unilateral transfers is also mostly private receipts. According to the US Department of Commerce, the private inflow consists primarily of insurance-related transfers; pensions and benefits received principally from Canada, Germany, and the United Kingdom; antitrust-related class-action lawsuits; and remittances received by US residents. The rest of the transfers come to the US government primarily in the form of withholding taxes received and fines levied by US government agencies.”
Add these four lines up, and you get the “current account balance,” which is clearly a broader view of the US balance of trade than just looking at the merchandise trade deficit. In 2016, the US had a current account balance (deficit) of -$481 billion.
But the current account balance is still only a portion of the overall picture. It captures flows of goods and services, investment income and unilateral transfers, but it doesn’t include actual flows of investment themselves. This portion of the statistics on international transactions is called the “capital account.” As a matter of definition and logic, the current account and the capital account are yin and yang, inteconnected and interdependent. When an foreign exporter sells in the US, and earns US dollars as a result, there are only two possible ultimate uses of those US dollars: either they are used to purchase dollar-denominated goods and services, or they are invested in a US-dollar denominated asset. Of course, the foreign exporting firm that earns the US dollars may not take these actions itself: it may just trade the US dollars for its home currency in foreign exchange markets. But the party that ends up with these US dollars must make the same choice of either buying US products or investing in US financial assets. Of course, this same process operates when US exporters sell in other countries and earn foreign currency.
The result of this pattern is that any current account deficit is always matched by a capital account surplus, and vice versa. As the quotation at the start said:
“America’s commerce with the rest of the world must be and always is balanced when taking into account investment flows as well as the exchange of goods and services …”
So what are these capital account flows for the US economy?
In looking at the different forms of capital account flows, it’s important to notice that each one is described as a “net” flow. When it comes to international investment in stocks and bonds, for example, there are enormous amounts of “gross investment” thundering around the world every minute of every day. The capital account measurements don’t measure these gross flows of capital; instead, they measure at the end of a given time period (a quarter or a year) how the overall size of these investments has changed. If the inflows and outflows of investment capital balance each other, the gross flows can be very large while the net flow is zero.
The result of this pattern is that any current account deficit is always matched by a capital account surplus, and vice versa.
Direct investment refers to a situation where the investor has a substantial degree of input into the management of the asset. As Griswold emphasizes, foreign direct investment by US firms, or FDI, is typically a way for US firms to expand their sales in foreign markets:
FDI occurs when a foreign investor acquires a controlling interest in the affiliate—defined as an equity stake of 10 percent or more. The gross flows of FDI are far smaller than portfolio investment because FDI investments are longer term, but FDI is hugely important because it represents not only a transfer of capital but also of management expertise and technology. … Contrary to a popular perception, US companies do not locate productive operations abroad primarily to export products back to the United States but instead to reach more customers abroad. A presence in the local market can help US affiliates refine their final products to meet local demand, to reduce transportation costs, and to better protect their brand name and intellectual property. Many types of services cannot be exported but must be delivered in the local market. In today’s global economy, US companies sell far more of their branded goods and services through foreign-based affiliates than by exporting from the United States. In 2014, US-owned affiliates supplied $4.49 trillion in goods to foreign customers compared to $1.63 trillion in exported goods. That same year, US-owned affiliates provided $1.66 trillion in services to foreign customers compared to $743 billion in services exports.29 That means that US producers earn almost three times more from the sale of goods through their affiliates abroad than they do by exporting from the United States, and they earn more than twice as much from the sale of services. Goods and services produced abroad by US-owned affiliates are overwhelmingly sold abroad. Of the more than $4 trillion in goods that foreign-owned affiliates supplied in 2014, 8 percent were sold as imports to the United States while 92 percent were sold in the host country or in third countries.
Here’s Griswold explaining the next category of portfolio investment, where the US outflow declined substantially from the previous few years:
“The financial account measures transactions for portfolio investment, which is passive, noncontrolling ownership of common stocks, bonds, or Treasury bills; for bank deposits or direct loans; and for direct investment, which involves the direct control of an asset by the investor. … Portfolio investment is defined as cross-border transactions and positions involving debt or equity securities other than those included in direct investment or reserve assets held by central banks. In the half decade of 2011–2015, foreign investors increased their holdings of US portfolio securities by an average of $504 billion a year, while American investors increased their holdings of foreign securities by an average of $310 billion, for a net annual inflow of $194 billion. Of the annual inflow of portfolio investment, 90 percent flowed into US debt securities, such as Treasury bills, and the rest flowed into equities, such as stocks and mutual funds. Of the annual outflow of portfolio investment, two-thirds flowed into foreign equity investment and one-third into debt securities.”
The other substantial category here is “other,” which as Griswold explains is mainly bank deposits and loans. There are also categories for financial derivatives and central bank reserve assets:
Another category of financial flows includes the sale of assets not included in portfolio investment or direct investment. The major sources of these flows are bank deposits and loans. In the 2011–2015 period, the average annual net inflow of dollars for deposits in US institutions or principle for loans from overseas was $42 billion—with a large inflow for bank deposits partially offset by an outflow for loan principle. The net annual outflow of dollars from the United States for loans and deposits during that same period was a negative $218 billion, which represents a net withdrawal from deposits that had been made abroad. That means that a pipe that would normally be expected to carry dollars from the United States to banks and other institutions abroad instead carried a net flow of dollars back to the United States during 2011–2015. Other categories of financial flows outside portfolio and direct investment are financial derivatives and reserve assets. Financial derivatives are instruments whose value is linked to the prices of underlying items, such as an asset or index. In the 2011–2015 period, an average annual net of $21 billion flowed out of the United States to buy financial derivatives. Reserve assets are cross-border assets that are generally owned by monetary authorities for direct financing of payment imbalances. These transactions are a small part of the overall balance of payments, averaging a net annual $1.5 billion in outflows in 2011–2015.
Taking these together, the US ran a capital account surplus of $406 billion in 2016. Conceptually, the capital account surplus should equal the current account deficit. But in the real world, the actual data on trade in goods and service, investment income, transfers, ownership of portfolio assets, foreign direct investment, and international bank accounts all come from different sources, and so it’s no surprise that they don’t match up directly. There’s always a “statistical discrepancy” as shown in the table. Griswold explains:
“The most likely categories contributing to the errors and omissions involve trade in services, delays in payments between reporting periods, interest and dividend receipts, and the temptation companies face to understate the value of exports or to overstate the value of imports in order to reduce tax liability. … In the 2011–2015 period, the average annual net inflow of dollars through the capital account was $1.5 billion and the average net outflow was $0.5 billion. … Statistical discrepancies were a small 1.5 percent of total annual inflows during 2011–2015.”
I won’t dive into the arguments about the causes and effects of current account trade deficits or capital account surpluses here. My point here is just that these categories are all inextricably interrelated, and any serious discussion of US international transactions needs to show some awareness of this entire picture.


