by Jill Mislinski, Advisor Perspectives/dshort.com
The University of Michigan Preliminary Consumer Sentiment for January came in at 94.4, down 1.5 from the December Final reading of 95.9. Investing.com had forecast 97.0.

Surveys of Consumers chief economist, Richard Curtin, makes the following comments:
While the preliminary January reading for the Sentiment Index was largely unchanged from last month (-1.5%), consumers evaluated current economic conditions less favorably (-4.6%). This small decrease in current conditions produced a small overall decline. Importantly, the survey recorded persistent strength in personal finances and buying plans, while favorable levels of buying conditions for household durables have receded to preholiday levels in early January, largely due to less attractive pricing. The Expectations Index remained virtually unchanged at 84.8. Tax reform was spontaneously mentioned by 34% of all respondents; 70% of those who mentioned tax reform thought the impact would be positive, and 18% said it would be negative. The disconnect between the future outlook assessment and the largely positive view of the tax reform is due to uncertainties about the delayed impact of the tax reforms on the consumers. Some of the uncertainty is related to how much a cut or an increase people, especially high income households who live in high-tax states, face. Near and long term gas price expectations inched upward in early January but remained significantly below their peak. While long term inflation expectation remained at its 2017 average level and short term inflation expectation inched upward, consumers continued to remain very optimistic about the low national unemployment rate. [More…]
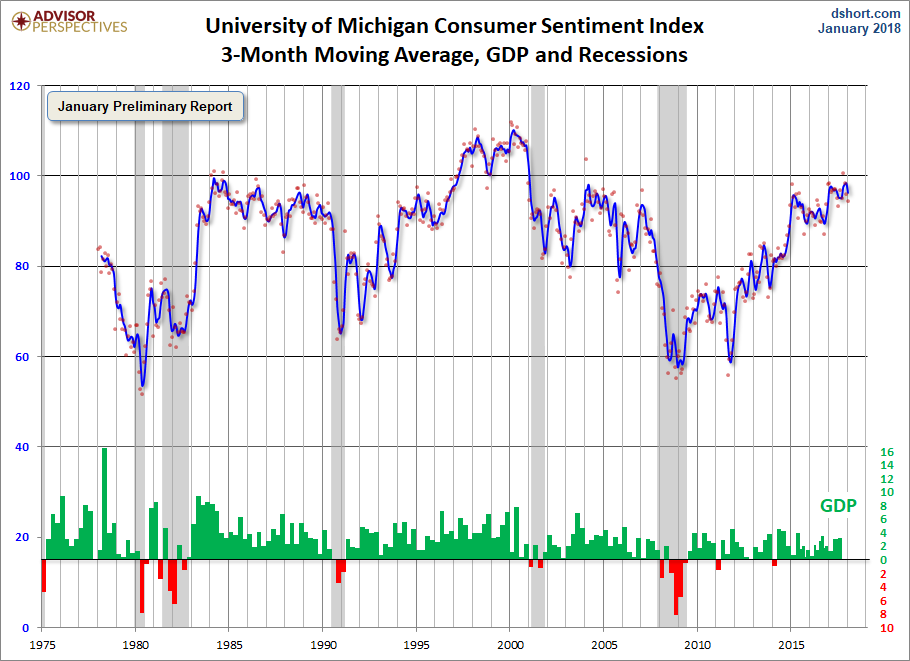
See the chart below for a long-term perspective on this widely watched indicator. Recessions and real GDP are included to help us evaluate the correlation between the Michigan Consumer Sentiment Index and the broader economy.

To put today’s report into the larger historical context since its beginning in 1978, consumer sentiment is 10.0 percent above the average reading (arithmetic mean) and 11.3 percent above the geometric mean. The current index level is at the 74th percentile of the 481 monthly data points in this series.
Note that this indicator is somewhat volatile, with a 3.0 point absolute average monthly change. The latest data point saw a 1.5 percent change from the previous month. For a visual sense of the volatility, here is a chart with the monthly data and a three-month moving average.
For the sake of comparison, here is a chart of the Conference Board’s Consumer Confidence Index (monthly update here). The Conference Board Index is the more volatile of the two, but the broad pattern and general trends have been remarkably similar to the Michigan Index.

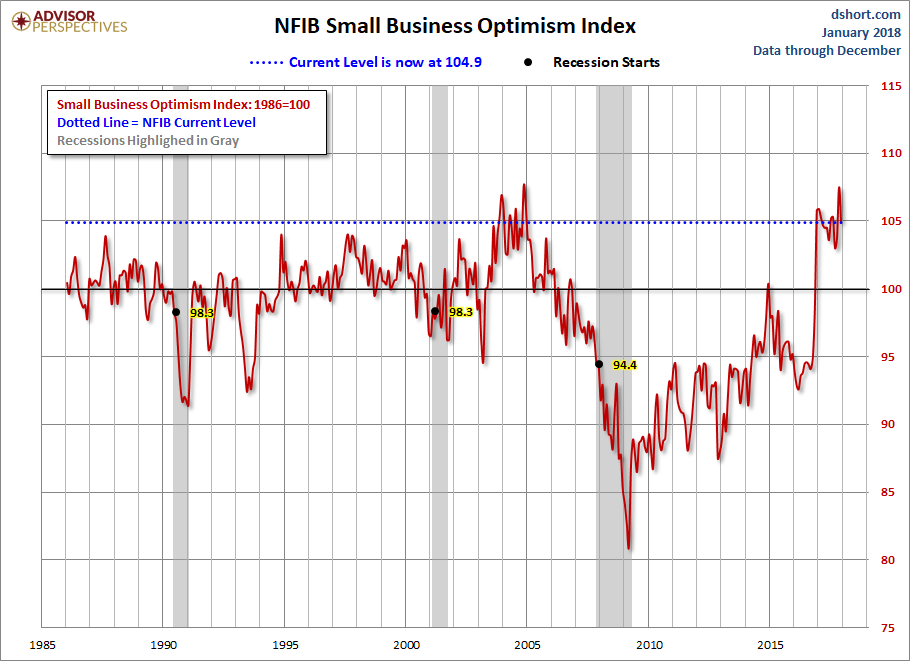
And finally, the prevailing mood of the Michigan survey is also similar to the mood of small business owners, as captured by the NFIB Business Optimism Index (monthly update here).
The general trend in the Michigan Sentiment Index since the Financial Crisis lows has been one of slow improvement.The survey findings since December 2015 saw gradual decline followed by a bounceback later in the year.
include(“/home/aleta/public_html/files/ad_openx.htm”); ?>


