
Written by Gary
Midday Market Commentary For 08-07-2014
In a somewhat surprising turn of events for the day is that the markets have turned down. The 5 day trend is down, but what is bullish, so far, that the SP500 has not closed below the 100 DMA. The DOW on the other hand is fighting to stay above the 200 DMA while the small caps are all over the charts adding to investor confusion.
By noon the major averages were all in the red on sometime moderate volume while the bulls and bears continue to battle it out. Much market weakness is seen and now ‘danger’ replaces the caution flag.

It is still believed the markets will recover and even test the historic highs, but this dip might be a warring of things to come.
The medium term indicators are leaning (barely) towards the hold side at the midday. The all important signs of reversal, up or down, have not been observed so we are mostly, at best, neutral and conservatively holding. The important DMA’s, volume and a host of other studies have not turned and that is not enough for me to start shorting. The SP500 MACD has turned down, but remains below zero at -9.96. I would advise caution in taking any position during this uncertain period although some technical indicators are starting to turn bearish.
Investing.com members’ sentiments are 45 % bearish and when it switches over to bullish, as it did on Tuesday 8-5, watch for the market bottom to fall out some are saying as the markets usually go against ‘Sheeple’ buying high and selling low.
Investors Intelligence sets the breath at 58.5 % bullish with the status at Bear Confirmed. (Chart Here )
StockChart.com NYSE Bullish Percent Index ($BPNYA) is at 62.39. (Chart Here) BELOW support.
StockChart.com S&P 500 Bullish Percent Index ($BPSPX) is at 71.00. (Chart Here) BELOW support.
The Market Is Overpriced But The Correction Will Likely Be Shallow
StockChart.com Overbought / Oversold Index ($NYMO) is at -58.32. (Chart Here) (Need to type in $NYMO) Oversold conditions on the NYSE McClellan Oscillator usually bounce back at anything over -50, but this time things may be different – where have I heard this before? Tuesday’s (8-5) numbers are definitely not a good sign, but today they are improving.
StockChart.com Consumer Discretionary ETF (XLY) is at 65.52. (Chart Here)
Chris Ciovacco says, “As long as the consumer discretionary ETF (NYSEARCA:XLY) holds above 67.06, all things being equal, it is a good sign for stocks and the U.S. economy.” (Actually the support looks to be in the 66.88 range) We have entered an area that concerns me should the XLY drops any further.
These last couple of years, there have been lots of little three percent dips where the markets recovered and melted upwards to new highs. This have been mostly due to the intervention of the Fed’s artificially insertion of ‘Market Viagra’ driven by Fed speak and high frequency trading (HFT). This market, as many will agree, is completely irrational and perhaps a bit corrupt.
Sometime in the future, there will be another three percent drop, only it will go to four, recover somewhat and the BTFDers will cry halleluiah and buy again. Only this time it doesn’t recover fully like in the past and drops again, increasing the net drop to seven percent and so on. Being so used to continual recoveries, the many ‘Sheeples’ out there will once again be sucked in by greed and sell in fear when they shouldn’t.
In Jeroen Blokland’s article below he writes about the recent ‘correction’ were are in and how it compares with others. He uses ‘stock are plunging’ a lot, but I would call it melting when considering the larger picture. Still, it is an interesting perspective when discussing past declines, or corrections, and those that await us in the future.
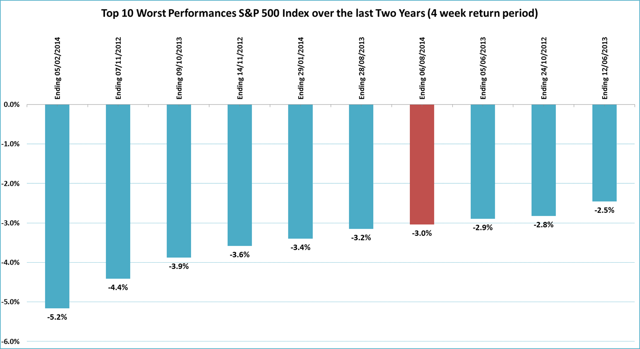
The Recent Stock Market Correction In Perspective
The graph [below] reveals that the current correction in the S&P 500 index (in red) makes the top 10. As of the close of [August 5th] the index fell by 3.0%, making it the 7th worst 4-week return in the last two years. That is still quite a bit less than the correction of February this year, when the index dropped over 5%. Moreover, a 3% stock correction is also pretty decent from a longer-term perspective.
The markets are still susceptible to climbing on ‘Bernankellen’ vapor, use caution!
If you would like to get advanced buy/sell tweets, sign-up in the column to the right of this post by clicking on the ‘Follow‘ button. Write me with suggestions and I promise not to bite.
The DOW at 12:30 is at 16390 down 56 or -0.34%.
The SP500 is at 1914 down 7 or -0.35%.
SPY is at 191.45 down 0.63 or -0.34%.
The $RUT is at 1122 down 4 or -0.34%.
NASDAQ is at 4347 down 8 or -0.19%.
NASDAQ 100 is at 3868 down 6 or -0.16%.
$VIX ‘Fear Index’ is at 16.70 up 0.33 or 2.02%. Bearish Movement
(Follow Real Time Market Averages at end of this article)
The longer trend is up, the past months trend is positive, the past 5 sessions have been net neutral and the current bias is negative.
Crude oil prices fall to six-month lows on refinery outlook
WTI oil is trading between 97.42 (resistance) and 96.55 (support) today. The session bias is neutral, volatile and is currently trading up at 97.14.
Brent Crude is trading between 105.16 (resistance) and 104.16 (support) today. The session bias is positive and is currently trading up at 105.11.
Gold rose from 1309.91 earlier to 1313.30 and is currently trading down at 1313.30. The current intra-session trend is positive and volatile.
Dr. Copper is at 3.180 rising from 3.158 earlier.
The US dollar is trading between 81.72 and 81.44 and is currently trading up at 81.64, the bias is currently positive and volatile.
Real Time Market Numbers
To contact me with questions, comments or constructive criticism is always encouraged and appreciated:
Written by Gary


