
FCHI, the French Index, has had a joyous rally from a very negative chart pattern on absolutely no pulse. What does this mean? The pulse indicator is NOT connected with volume. One might argue this has been a rally on low volume, which may be true. But this pulse indicator ignores volume. What it does suggest is that the selling is not over.
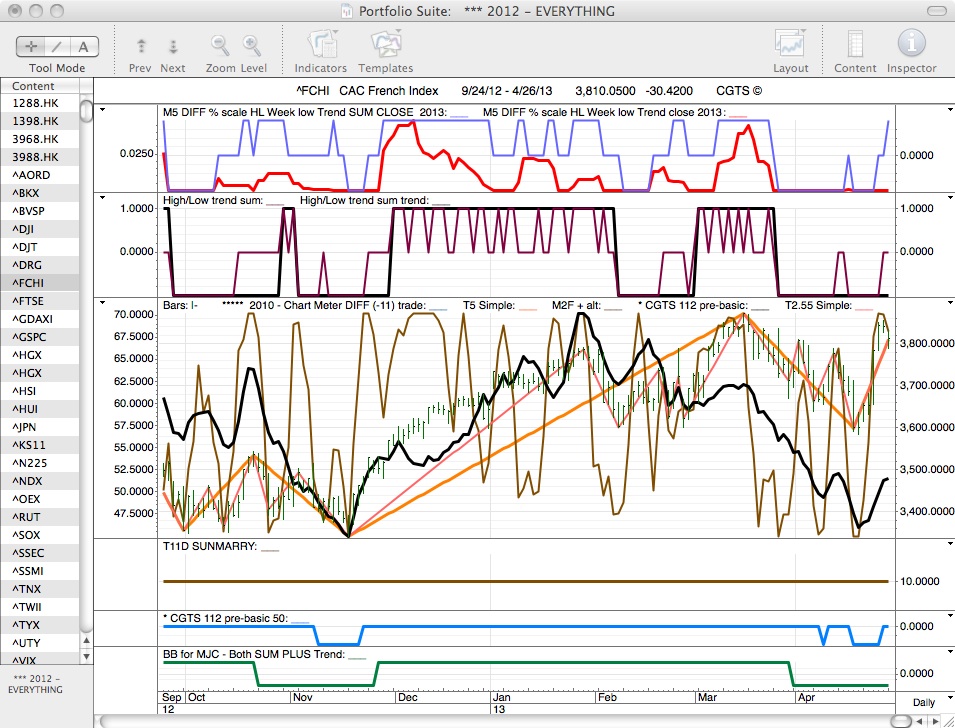
Click to enlarge
The FTSE Index, Great Britain’s stock index, is very similar to the French Index chart: a nice rally with no pulse and continued down-trending of the CGTS indicator.
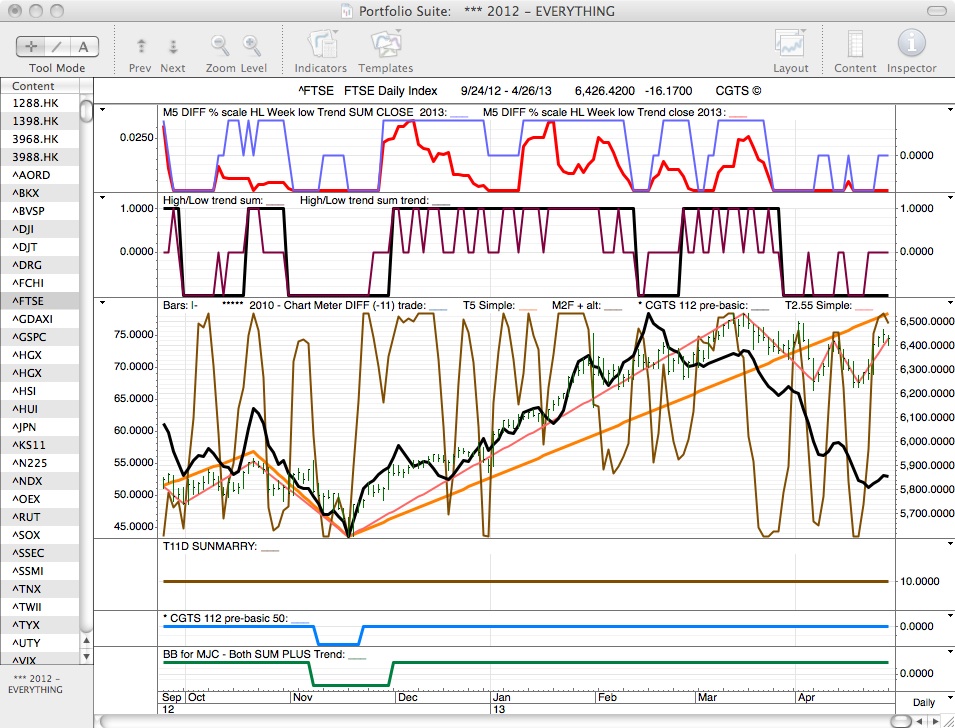
Click to enlarge
The German Index, GDAXI, is almost exactly the same as the other two charts. The Brown Line (M2F ALT) suggests the bounce-back rally should end or has already ended (is overbought) and the next decline will determine if we are going lower. If the CGTS indicator (black line, central pane) makes a new low, then we will go lower.

Click to enlarge
What about housing? Housing stocks have been impervious to pullback. But the rally in HGX has reached overbought levels with a rally having no pulse. It should go lower. Of course, betting against a market that is being fueled by Ben Bernanke with direct infusions is difficult and dangerous. But I ask again: where is the pulse?
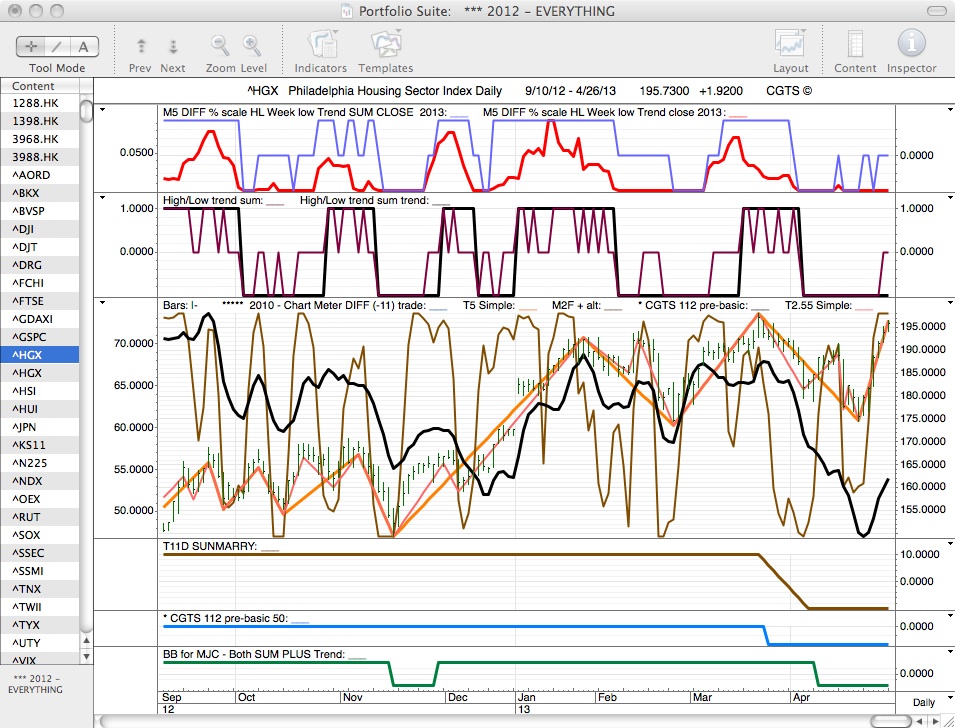
Click to enlarge


