
Written by Steven Hansen
 The markets are continuing to bounce around this past week – and I listen to pundits argue whether this is a beginning of a new bear market, or just a quick correction. Back in August of 2008, I wrote at Seeking Alpha,
……… we have been traveling from one credit crisis to another since 1987, each seems bigger than the previous one. The current one is so large it should take many years to work the effects through our financial system. Maybe, we are in a Dow Jones Industrial’s volatility cycle which will take many more years to finish.
My article at Seeking Alpha is republished below which is based on Dow Index cycles since 1950. The bottom line is that it predicted the next Dow Bull cycle to begin in 2015.
However, I decided to take another look at this subject even though I am not a believer in being able to time an investing cycle (or alternatively believing history repeats until it doesn’t).
What has been bouncing around in my head is:
- that the start and stop of cycles are subject to interpretation,
- that the length of cycles are not exact, and
- even the definition of what a cycle is questionable.
Not referring to my original article, I annotated the following graphic [click on image to enlarge].

In my original article, I implied Dow Cycles are 16 years, and that a bear cycle is defined as the period of time that the index enters and departs at the same level. In my new analysis, my review starts at the beginning of the 20th century, and the bear cycle remains the period between a major market peak and its recovery to that level.
The big difference is that complete cycles are not necessary 32 years as suggested by my original article – but between 24 years and 36 years. What this implies that if one believed in cycles – 2012 could be the beginning of a new bull cycle. On the other hand, it also implies the bull cycle could start as late as 2018.
All of this is dependent on whether one sees 1999 as the end of the bull cycle. It could be argued that 2007 was the end of the bull cycle – and this means another decade of pain.
Or if you are a born cynic, market cycles are just random data falling in a pattern which creates an illusion that cycles exist.

original article at Seeking Alpha:
The Case Against Investing in the Dow Industrials (For Now)
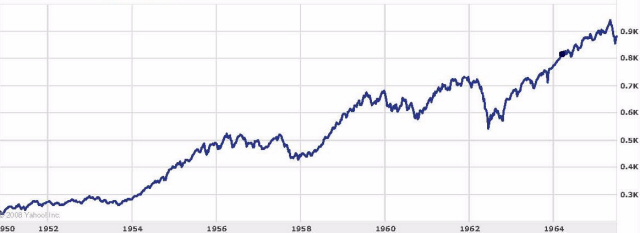
There appears to be 16 year Dow growth investing cycles followed by 16 years of volatility. The 16 year period of volatility began in 1999, and on a historical basis would end in 2015. The following Dow Jones Industrial Average charts illustrate this point.
click to enlarge images
Period 1950 to 1966 (source Yahoo! Finance) – Growth Investing Cycle
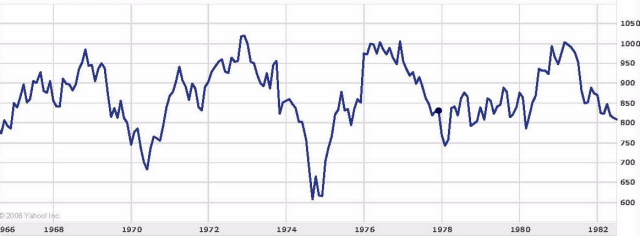
Period 1966 to 1982 (Source Yahoo! Finance) – Volatile Cycle
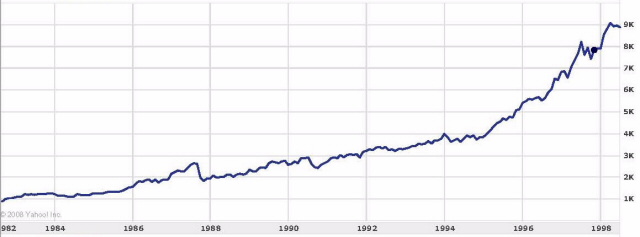
Period 1982 to 1998 (Source Yahoo! Finance) – Growth Investing Cycle
Period 1999 to 2015 (Source Yahoo! Finance & The Hand) – Volatile Cycle

It is interesting that recessions have occurred in each of the 4 cycles presented above.
To be honest, I do not really believe what the 1999 to 2015 chart is suggesting. I am not a big fan of using historical data to project the future (data can be twisted to support almost any supposition).
On the other hand, we have been traveling from one credit crisis to another since 1987, each seems bigger than the previous one. The current one is so large it should take many years to work the effects through our financial system. Maybe, we are in a Dow Jones Industrial’s volatility cycle which will take many more years to finish.


