
by David Grandey, All About Trends

Tuesday, September 13 we said the following (and it still held true as of noon Wednesday, when this was written):
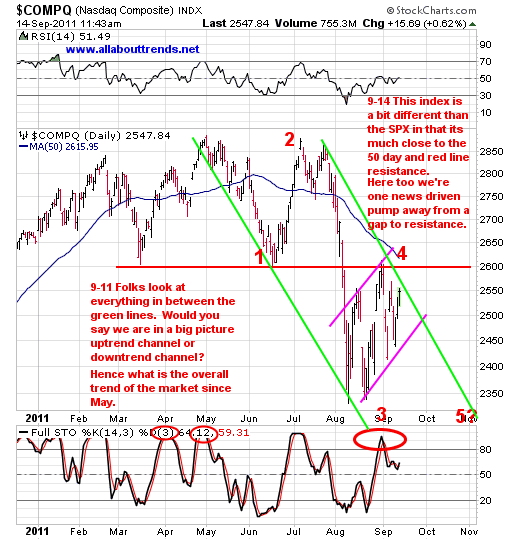
Right now the market is looking for something concrete it can hang its hat on. Its nervous and that is why every little news ditty makes it react either positive or negatively. When it bounces it chews the shorts alive, when it falls apart it chews the longs alive when all said and done the net result is nowhere but all within the channel. All makes for a wicked trend channel and a market looking for something real it can actually hang its hat on.

As for the 60 minute time frequency charts?
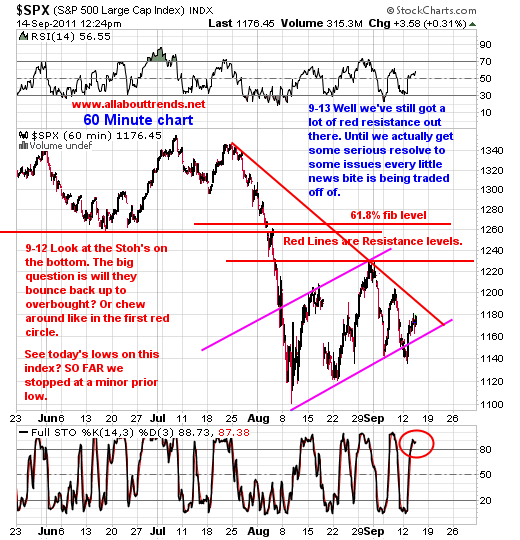

The NASDAQ Composite, and I suppose one could say the S&P 500 too, are starting to sport a new development all within the channel. Its called a symmetrical triangle whether it actually pans out is another story as we still have that big resistance level to contend with too in here at the red lines.
For more on this pattern one can go to chart school at stockcharts.com.
Chart Of The Day

Under The Surface Chatter
Anyone see Geithner PUNT when asked about whether EU banks would pass stress tests? Just saying.
In addition to that, in the realm of big time outside the box thoughts, I got a case of deja vu this morning. You see in 2008 before everything came unglued we also had an “All The Kings Men And All The Kings Horses Humpty Dumpty” moment similar event like Geithner’s today. All morning the headlines on TV are all about how everything is contained etc etc etc.
All I’m saying about it is that its eerily similar without sensationalizing it or jumping to any conclusions. It simply bothers me – just makes me even more cautious here on both sides of the market.
After the Battle Wednesday
Everything above was posted a little after noon on Wednesday (September 14). The markets rallied strongly in the afternoon but it didn’t didn’t resolve anything. The Nasdaq Composite traded right up to the first resistance level (high of 2600.78) and fell back to close at 2572.55.
The S&P 500 only got to a high of 1202.38 (first resistance levels at 1230-1260) and fell back to close 1188.68.
The rally today destroyed what might have been short-term developing flags. If the rally continues to take out resistance then perhaps we will have seen a flag signal bullish breakout today. We won’t know until we see the follow-through.
Related Articles
About the Author
 David Grandey is the founder and CEO of All About Trends, a subscription based newsletter service focused on helping individuals secure consistent profits in the market by trading what they see, not what they think, hear or fear. The focus is on how to trade uptrends, downtrends and changes in trends. All About Trends offers a free newsletter at www.allabouttrends.net and a free report — “How To Outperform 90% Of Wall Street With Just $500 A Week.”
Disclaimer from All About Trends
| THESE ARE NOT BUY RECOMMENDATIONS!Comments contained in the body of this report are technical opinions only. The material herein has been obtained from sources believed to be reliable and accurate, however, its accuracy and completeness cannot be guaranteed. All About Trends reserves the right to refuse service to anyone at anytime for any reason. Allabouttrends.netis not an investment advisor, hence it does not endorse or recommend any securities or other investments. Any recommendation contained in this report may not be suitable for all investors and it is not to be deemed an offer or solicitation on our part with respect to the purchase or sale of any securities. All trademarks, service marks and trade namesappearing in this report are the property of their respective owners, and are likewise used for identification purposes only. The member/subscriber agrees that he/she alone bears complete responsibility for his/her own investment/trading decisions. Allabouttrends.netshall not be liable to anyone for any loss, injury or damage resulting from the use of any information. Trade at you’re own risk, this information is strictly for educational and informational purposes only. Allabouttrends.net assumes NO responsibility whatsoever for any losses experienced by anyone who uses its educational materials to make financial decisions. All charts courtesy of stockcharts.com. Want to know more? Visit our web site. Have you enjoyed good results from our newsletter or have a comment or question? Contact us at [email protected]. We’d love to hear from you. If you enjoy these newsletters, tell a friend! Finally, we have a public list at www.stockcharts.com — you can help us out by voting for it each day. At the bottom of our list is a place to vote for us. Voting for us each day helps our list get closer to the top which means more visibility and more subscribers and more opportunity for us to help others like you be successful. |


