 by John Lounsbury
Recently Doug Short looked at a number of bubbles and came to the conclusion that gold does not fit the profile of most bubbles. However, that does not mean that gold cannot experience moves that might be called microbubbles. After a sharp runup August, gold has returned to the trend line established between early July and early August. This is shown in the following graph from the 5 Min. Forecast.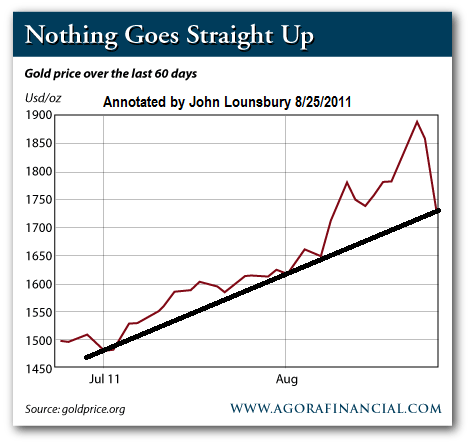
Other trend lines can be drawn. For example, even after the recent dramatic pullback, gold remains above the strong uptrend defined by Erik McCurdy in April.
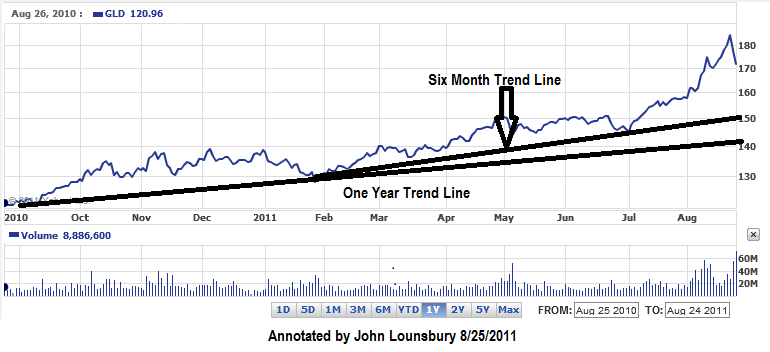
In the following graph from Yahoo we see six month and one year trend lines (support levels).
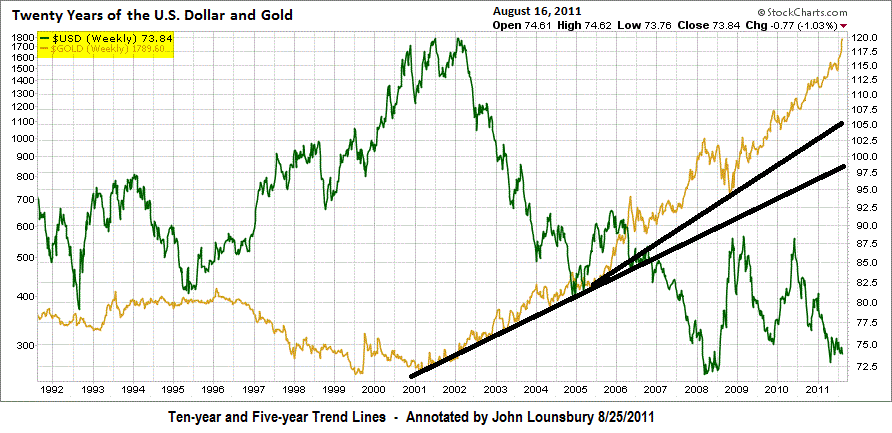
Five-year and ten-year trendlines are drawn on a graph provided by Advisor Perspectives – dshort.com.
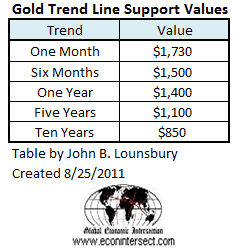
So before someone convinces you that the gold bull market is over, you should make sure what refernece they refer to. The trend lines with different time frames define different values for the market. The current trend line levels for gold are shown in the following table.
The following chart from thechartoftheday.com suggests that the long-term trading channel for gold should currently be $1,100 and $1,600. Recent prices have risen above that trading range, but there is no reason why prices could not return to that range and continue the uptrend.
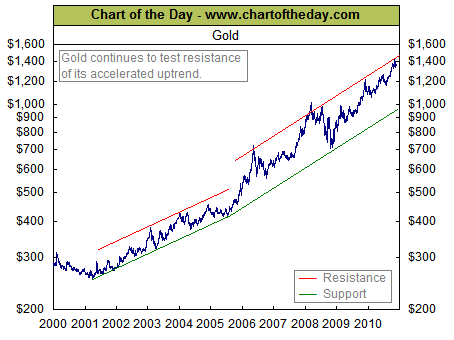
Note: The day after this article was published thechartoftheday.com released an update of the above chart which shows a new three year trading channel for the most recent time period. Gold is still in the upper part of that channel.

If gold is in a long term bubble it cannot be confirmed until the price drops below the long term trend line, currently at $850 and upwardly sloping. Gold could experience a short term bubble (1, 3 or even 5 years) and still have a long term bull market. If the ten year trend line remains intact for another ten years, the price of gold will have a support level near $3,000 in 2021. As Steven Hansen has said when comparing gold to silver and mining stocks:
“Gold, however is not a hot investment – just a tortoise.”
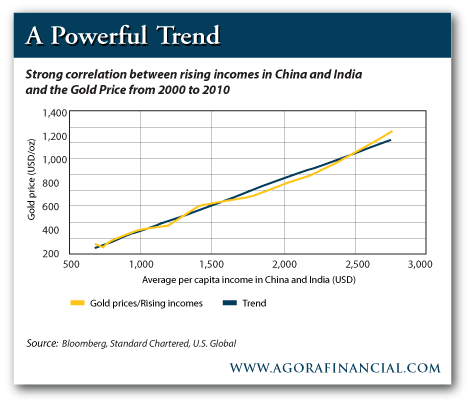
What could support such a trend? I posted another graphic from the 5 Min. Forecast a month ago that shows one driving force: rising incomes in Asia:
Related Articles
Gold Does Not Fit Profile of Most Bubbles by Doug Short
Gold Long-term Uptrend Remains Healthy by Erik McCurdy
Gold Is For Investors – Miners Are For Traders by Steven Hansen
China is Bullish for Silver by Keith Fitz-Gerald
Overview of the Markets by MacroTides


