
Econintersect Weather and Climate Forecast Update, 07 July 2014
Written by Sig Silber
The chances of an El Nino for next winter are reported as continuing to be quite high. Let’s take a deeper look at the situation and also begin the discussion of what happens after this probable El Nino. (See Part I)

Will the Pacific revert to ENSO (El Nino Southern Oscillation) normal conditions, or La Nina or perhaps something a bit more interesting?
First let us take a look at the view from Australia.
Some more El Niño-like patterns emerge, but no El Niño yet.
While the tropical Pacific Ocean surface temperature is currently at levels typically associated with a weak El Niño, waters below the surface have cooled and atmospheric patterns continue to remain neutral.
However, over the past fortnight changes have occurred in the atmosphere that may be a response to the warm surface waters–the Southern Oscillation Index has dropped by over 10 points, and weakened trade winds have re-appeared. These changes would need to persist for several weeks in order for an El Niño to be considered established, and it remains possible they are simply related to shorter term weather variability.
Climate models surveyed by the Bureau continue to indicate that El Niño is likely to develop by spring 2014. The Bureau’s ENSO Tracker remains at El Niño ALERT, indicating at least a 70% chance of El Niño developing in 2014.
For Australia, El Niño is often associated with below-average rainfall over southern and eastern inland areas and above-average daytime temperatures over southern parts of the continent.
The Indian Ocean Dipole (IOD) is currently neutral. Model outlooks suggest the IOD is most likely to remain neutral through winter and spring. The likelihood of a positive IOD event increases with El Niño. Positive IOD events are typically associated with large parts of southern and central Australia experiencing lower rainfall than usual.
And then, the view from Japan. Notice this is a two-year forecast unlike the one-year forecasts available from most meteorology bureaus.

The comments that accompany the model results are especially interesting. And Japan provides a running commentary of their comments so you can put them into historical perspective.
Here is the most recent commentary.
“June 18, 2014
ENSO forecast: The developing El Niño is expected to reach its height in late boreal summer and then continue at least through the winter. After the late winter, it will evolve into an El Niño Modoki.
Indian Ocean forecast: The probability of a negative IOD is very high in the tropical Indian Ocean during summer and fall. EDITORS NOTE: Japan and Australia do not seem to be on the same page here.
Regional forecast: Most part of Europe, Africa, Middle East, Russia, India, and Southeastern Asia will experience a warmer-than-normal summer owing to the development of El Niño. In contrast, the Far East including Japan will experience a cooler summer. In the Southern Hemisphere, most parts of Australia and South Africa will be colder-than-normal in austral winter while most parts of Africa and South American Continent will be warmer-than-normal. In the boreal fall, most parts of Europe, Africa, Middle East, Russia, India, Southeast Asia, and Mexico will be in a warmer-than-normal condition, whereas most parts of China, eastern-central part of U.S., southeastern Canada, Korea and Japan will be in a colder-than-normal condition. The unique combination of a negative IOD in the Indian Ocean and an El Nino in the Pacific is similar to the situation in 1993, a year of record-breaking cool summer in the northeastern part of Japan. Indian sub-continent will experience a drier than normal summer monsoon season. The Maritime Continent in Asia, Caribbean countries, and West Africa will also be in a drier-than-normal condition in the boreal summer and fall owing to the El Niño. On the other hand, wetter-than-normal condition is predicted for U.S., Peru, Colombia, Ecuador, and northern Brazil. Above normal precipitation is also expected in Japan in summer because of the active and somewhat prolonged Baiu-season. In the austral spring, the southern African region will be in a drier-than-normal condition.”
The full set of comments dating back to 2006 can be found here. You will have to scroll down through the notes.
What is this Modoki situation they are forecasting will follow the El Nino? I will talk more about that next week but for now just look at this diagram.

The El Nino Modoki is warming pretty much only in what is called the Nino 3.4 Region of the Equatorial Pacific with colder water to the east and west. We will talk more about this next week.
Let’s take a look at the situation with respect to the U.S. Here is the current weather map:

And here is the situation projected out seven days:

This is a little different than the chart I usually present which is the mid atmosphere highs and lows. This is the surface highs and lows which is not that different and the above has the advantage that it clearly shows what is going on in Mexico as well as CONUS (contiguous – or conterminous – United States).
I will show the mid-atmosphere 7-Day chart also as it provides a clearer picture and after all, the weather takes place above the ground not at ground level (fog excluded).

One interesting thing to do is to draw a circle around each high and low with an arrow on the circle showing the movement around the high in the northern hemisphere being clockwise and around the low, counter clockwise with air tending to move towards the low (to equalize things) and away from highs (to equalize them). In the summer expecially this provides a lot of clues as to how moisture off of the Pacific, Atlantic and Gulf of Mexico and Gulf of California will enter the circulation and impact precipitation.
Notice how the so-called Four Corners high moves around a lot which determines how moisture from the south enters the Southwest and on one of these charts you can see the Bermuda High which impacts the path of storms in the Atlantic and the low pressure off of the Pacific Northwest etc etc. There is a lot more to weather than highs and lows but they are very important. In the above chart you see the Four Corners High at high altitude moving a bit west of its usual location which I think might mean a slight shifting of the North American Monsoon impacts a bit to the west favoring Arizona. But that could shift in the other direction the following week.
From today’s Albuquerque Weather Service discussion:
“The moisture from tuesdays front will recycle efficiently on Wednesday. Theta-E ridge axis looks to be placed mainly over northern and western nm…as dry air lingers across the southeast. Meanwhile…the upper high that has generally been centered over Utah will shift over nm. Then on Thursday…the upper high looks to elongate eastward. This will generally steer the monsoonal plume into Arizona…though there may be some seepage into western nm. By Friday and the weekend…models want to split the high…but models dont agree on the location of the two high centers. The European model (ecmwf) shows one high center over Nevada and other over OK/TX…which would create a weakness over nm…allowing some moisture from the south to creep northward over western nm. However…the GFS shows one high center over the 4 corners and another over OK/AR. Some moisture could still seep northward in this scenario…but it would probably be further east…over central or eastern nm. In both situations… strong east to west 700-500 mb flow over northern Mexico will make it difficult for good monsoonal moisture to come up. Since the models have been changing daily in regards to the extended…not to believe any one model solution. Nonetheless…the low level moisture that will be in place after tomorrows front will likely recycle for quite a while in the form of diurnal thunderstorms. Thus…storms remain in the forecast…despite the lack of a traditional monsoon surge.
I have provided the above simply to illustrate the vagaries of summer weather and how you can get rain in the Southwest in the Summer even without a true traditional monsoon surge from Mexico. There is not much else of significance going on in the rest of the Conterminous U.S. (CONUS). Lot’s of the usual thunderstorm activity associated with summer but nothing exceptional to note. Or at least that is what I was planning to write up until the new forecast just came out which is indicating a significant intensification of the pattern of both the pressure gradients and temperature gradients suggesting that the situtuation in the Great Lakes/Midwest/Central part of the U.S. could get interesting in the near term (days 6 – 10) due to the intrusion of a Canadian Air Mass.
Now let us take a look at the latest NOAA/NWS.NCEP/CPC ENSO forecast.
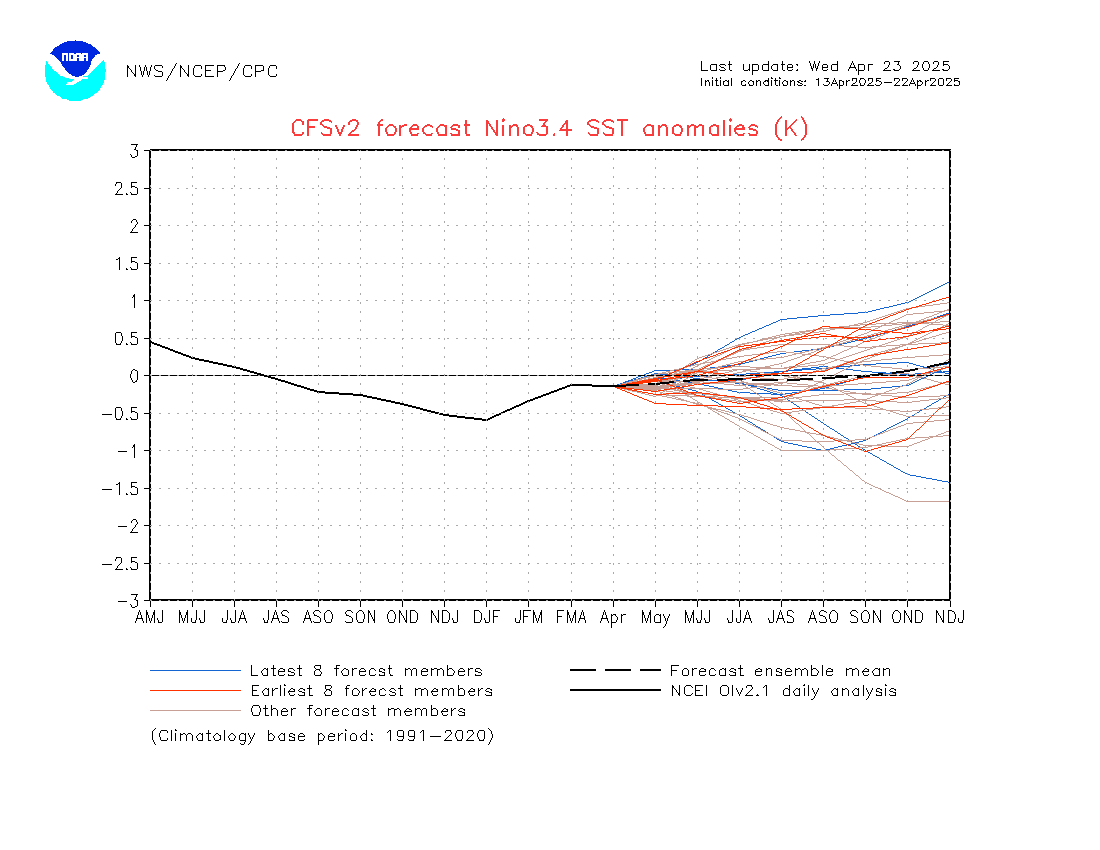 It is still showing the same pattern of a relatively short, moderate-strength El Nino which will definitely impact the coming winter in the U.S.
Below is a broader view looking out to Dec 2014 through Feb 2015 which looks at sea surface temperatures (SST) everywhere not just one area i.e. Nino 3.4 which is where the ONI Index shown in the earlier graphic is measured.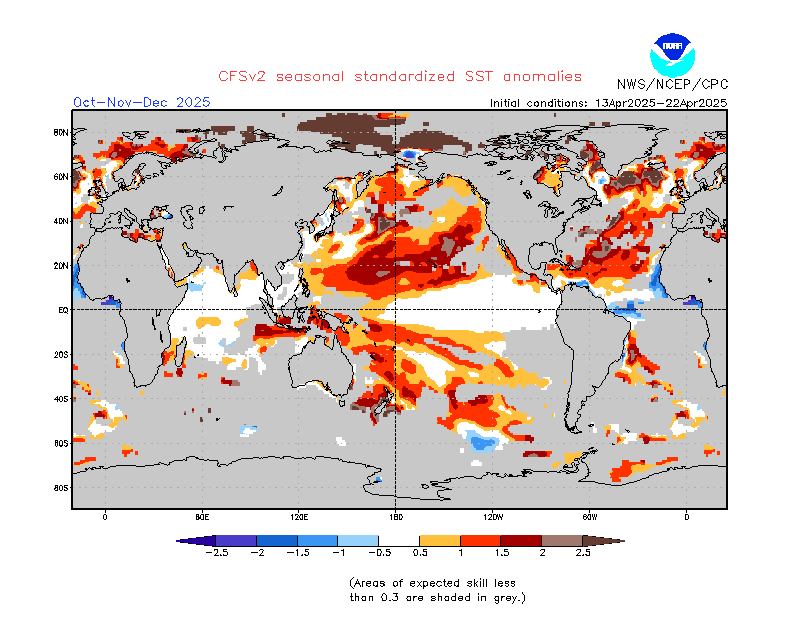
You can see the warm water off the coast of South America but it still does not look like a typical strong El Nino pattern.
Click here for the latest data from NOAA (National Oceanic and Atmospheric Administration) and other sources on the Econintersect Weather and Climate page.


