
 Econintersect: The International Monetary Fund (IMF) downgraded its world economic forecast saying the global recovery is stalling, and warning that downside risks are intensifying:
- that Europe is in a balancing act – it must must balance reform and deleveraging with maintaining economic stimulus.
- that emerging and developing economies must concentrate on internal growth in response slowing external growth.
- that the United States will suffer a political paralysis, cut back spending too quickly undoing the positive effect of the stimulus.
The global recovery is threatened by intensifying strains in the euro area and fragilities elsewhere. Financial conditions have deteriorated, growth prospects have dimmed, and downside risks have escalated. Global output is projected to expand by 3¼ percent in 2012 — a downward revision of about ¾ percentage point relative to the September 2011 World Economic Outlook (WEO).
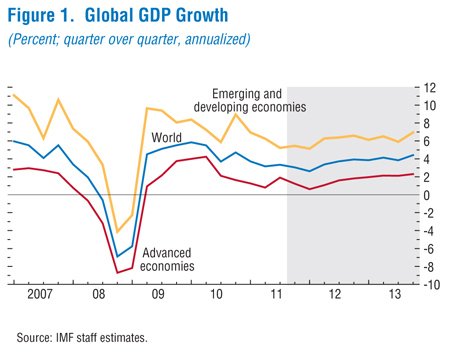
This is largely because the euro area economy is now expected to go into a mild recession in 2012 as a result of the rise in sovereign yields, the effects of bank deleveraging on the real economy, and the impact of additional fiscal consolidation. Growth in emerging and developing economies is also expected to slow because of the worsening external environment and a weakening of internal demand. The most immediate policy challenge is to restore confidence and put an end to the crisis in the euro area by supporting growth, while sustaining adjustment, containing deleveraging, and providing more liquidity and monetary accommodation. In other major advanced economies, the key policy requirements are to address medium-term fiscal imbalances and to repair and reform financial systems, while sustaining the recovery. In emerging and developing economies, near-term policy should focus on responding to moderating domestic growth and to slowing external demand from advanced economies.
The IMF stated that the USA is escaping an economic downgrade as “the growth impact of such spillovers is broadly offset by stronger underlying domestic demand dynamics in 2012.” The recommended course of action recommended for the global economy to weather this downturn:
• Fiscal adjustment. In the near term, sufficient fiscal adjustment is in motion in most advanced economies. Countries should let automatic stabilizers operate freely for as long as they can readily finance higher deficits. Among those countries, those with very low interest rates or other factors that create adequate fiscal space, including some in the euro area, should reconsider the pace of near-term fiscal consolidation. Overdoing fiscal adjustment in the short term to counter cyclical revenue losses will further undercut activity, diminish popular support for adjustment, and undermine market confidence. Among the major economies, a specific concern is that political paralysis in the United States will lead to an excessively rapid unwinding of stimulus spending. Regarding the medium term, the United States and Japan should push ahead in formulating and implementing credible medium-term consolidation plans, because neither country can take for granted its status as a safe haven. Measures could include reforms to slow the growth of health care and pension spending, caps on discretionary spending, and tax system reforms to boost fiscal revenue. Putting in place credible medium-term plans also will create policy room to support balance sheet repair, growth, and job creation. Fiscal policies are discussed in more detail in the January 2012 Fiscal Monitor Update.
• Liquidity. While fiscal consolidation proceeds in the advanced economies, monetary policy should continue to support growth, as long as inflation expectations remain anchored and unemployment stays high. If downside risks to growth materialize, further monetary stimulus—including through quantitative easing—may well be necessary. In this regard, targeted programs to help ease credit constraints on businesses and households would be useful in economies where monetary transmission is impaired. In the euro area, it is critical to break the adverse feedback loops between subpar growth, deteriorating fiscal positions, and weakening bank balance sheets, which may very well lead to a prolonged period of asset and consumer price deflation. Addressing this requires action on several fronts. First, additional and timely monetary easing by the ECB will be important, consistent with its mandate to ensure stable prices. Also, the ECB should continue to provide liquidity and stay fully engaged in securities purchases to help maintain confidence in the euro. And sufficient funding must be made available through the European Financial Stability Facility (EFSF) and the European Stability Mechanism (ESM) to countries facing severe funding constraints.
• Bank deleveraging. To break the adverse loops between weak growth and deteriorating bank balance sheets, more capital needs to be injected into the euro area banks (including from public sources) and supervisors must do whatever possible to avoid excessively fast deleveraging that could lead to a devastating credit crunch (see the January 2012 Global Financial Stability Report Update). Individual countries under pressure may well require recourse to euro-wide resources to facilitate bank recapitalization.
• Financial adjustment. Easy funding in the short-term must be coupled with continued progress to repair and reform financial systems. This is a critical element of normalizing credit conditions and would help reduce the burden on monetary and fiscal policy of supporting the recovery. Financial sector policies are discussed in more detail in the January 2012 Global Financial Stability Report Update.
| Table 1. Overview of the World Economic Outlook Projections (Percent change unless noted otherwise) | |||||||||||
| Year over Year | |||||||||||
| Projections | Difference from September 2011 WEO Projections | Q4 over Q4 | |||||||||
| Estimates | Projections | ||||||||||
| 2010 | 2011 | 2012 | 2013 | 2012 | 2013 | 2011 | 2012 | 2013 | |||
| World Output 1 | 5.2 | 3.8 | 3.3 | 3.9 | –0.7 | –0.6 | 3.3 | 3.4 | 4.0 | ||
| Advanced Economies | 3.2 | 1.6 | 1.2 | 1.9 | –0.7 | –0.5 | 1.3 | 1.3 | 2.1 | ||
| United States | 3.0 | 1.8 | 1.8 | 2.2 | 0.0 | –0.3 | 1.8 | 1.5 | 2.4 | ||
| Euro Area | 1.9 | 1.6 | –0.5 | 0.8 | –1.6 | –0.7 | 0.8 | –0.2 | 1.2 | ||
| Germany | 3.6 | 3.0 | 0.3 | 1.5 | –1.0 | 0.0 | 1.8 | 0.7 | 1.6 | ||
| France | 1.4 | 1.6 | 0.2 | 1.0 | –1.2 | –0.9 | 0.9 | 0.5 | 1.3 | ||
| Italy | 1.5 | 0.4 | –2.2 | –0.6 | –2.5 | –1.1 | –0.1 | –2.7 | 0.9 | ||
| Spain | –0.1 | 0.7 | –1.7 | –0.3 | –2.8 | –2.1 | 0.2 | –2.1 | 0.6 | ||
| Japan | 4.4 | –0.9 | 1.7 | 1.6 | –0.6 | –0.4 | –0.9 | 1.9 | 1.5 | ||
| United Kingdom | 2.1 | 0.9 | 0.6 | 2.0 | –1.0 | –0.4 | 0.8 | 1.0 | 2.4 | ||
| Canada | 3.2 | 2.3 | 1.7 | 2.0 | –0.2 | –0.5 | 2.1 | 1.7 | 2.0 | ||
| Other Advanced Economies 2 | 5.8 | 3.3 | 2.6 | 3.4 | –1.1 | –0.3 | 2.9 | 3.2 | 3.5 | ||
| Newly Industrialized Asian Economies | 8.4 | 4.2 | 3.3 | 4.1 | –1.2 | –0.3 | 3.8 | 4.3 | 3.8 | ||
| Emerging and Developing Economies 3 | 7.3 | 6.2 | 5.4 | 5.9 | –0.7 | –0.6 | 5.9 | 6.0 | 6.3 | ||
| Central and Eastern Europe | 4.5 | 5.1 | 1.1 | 2.4 | –1.6 | –1.1 | 3.4 | 1.4 | 3.0 | ||
| Commonwealth of Independent States | 4.6 | 4.5 | 3.7 | 3.8 | –0.7 | –0.6 | 3.2 | 3.5 | 3.7 | ||
| Russia | 4.0 | 4.1 | 3.3 | 3.5 | –0.8 | –0.5 | 3.5 | 2.8 | 4.0 | ||
| Excluding Russia | 6.0 | 5.5 | 4.4 | 4.7 | –0.7 | –0.4 | . . . | . . . | . . . | ||
| Developing Asia | 9.5 | 7.9 | 7.3 | 7.8 | –0.7 | –0.6 | 7.4 | 7.9 | 7.6 | ||
| China | 10.4 | 9.2 | 8.2 | 8.8 | –0.8 | –0.7 | 8.7 | 8.5 | 8.4 | ||
| India | 9.9 | 7.4 | 7.0 | 7.3 | –0.5 | –0.8 | 6.7 | 6.9 | 7.2 | ||
| ASEAN-5 4 | 6.9 | 4.8 | 5.2 | 5.6 | –0.4 | –0.2 | 3.7 | 7.4 | 5.0 | ||
| Latin America and the Caribbean | 6.1 | 4.6 | 3.6 | 3.9 | –0.4 | –0.2 | 3.9 | 3.3 | 5.0 | ||
| Brazil | 7.5 | 2.9 | 3.0 | 4.0 | –0.6 | –0.2 | 2.1 | 3.8 | 4.1 | ||
| Mexico | 5.4 | 4.1 | 3.5 | 3.5 | –0.1 | –0.2 | 4.1 | 3.1 | 3.6 | ||
| Middle East and North Africa (MENA) 5 | 4.3 | 3.1 | 3.2 | 3.6 | . . . | . . . | . . . | . . . | . . . | ||
| Sub-Saharan Africa | 5.3 | 4.9 | 5.5 | 5.3 | –0.3 | –0.2 | . . . | . . . | . . . | ||
| South Africa | 2.9 | 3.1 | 2.5 | 3.4 | –1.1 | –0.6 | 2.4 | 3.0 | 3.7 | ||
| Memorandum | |||||||||||
| European Union | 2.0 | 1.6 | –0.1 | 1.2 | –1.5 | –0.7 | 0.8 | 0.3 | 1.7 | ||
| World Growth Based on Market Exchange Rates | 4.1 | 2.8 | 2.5 | 3.2 | –0.7 | –0.4 | . . . | . . . | . . . | ||
| World Trade Volume (goods and services) | 12.7 | 6.9 | 3.8 | 5.4 | –2.0 | –1.0 | . . . | . . . | . . . | ||
| Imports | |||||||||||
| Advanced Economies | 11.5 | 4.8 | 2.0 | 3.9 | –2.0 | –0.8 | . . . | . . . | . . . | ||
| Emerging and Developing Economies | 15.0 | 11.3 | 7.1 | 7.7 | –1.0 | –1.0 | . . . | . . . | . . . | ||
| Exports | |||||||||||
| Advanced Economies | 12.2 | 5.5 | 2.4 | 4.7 | –2.8 | –0.8 | . . . | . . . | . . . | ||
| Emerging and Developing Economies | 13.8 | 9.0 | 6.1 | 7.0 | –1.7 | –1.6 | . . . | . . . | . . . | ||
| Commodity Prices (U.S. dollars) | |||||||||||
| Oil 6 | 27.9 | 31.9 | –4.9 | –3.6 | –1.8 | –3.1 | . . . | . . . | . . . | ||
| Nonfuel (average based on world commodity export weights) | 26.3 | 17.7 | –14.0 | –1.7 | –9.3 | 2.2 | . . . | . . . | . . . | ||
| Consumer Prices | |||||||||||
| Advanced Economies | 1.6 | 2.7 | 1.6 | 1.3 | 0.2 | –0.1 | 2.9 | 1.2 | 1.3 | ||
| Emerging and Developing Economies 3 | 6.1 | 7.2 | 6.2 | 5.5 | 0.3 | 0.4 | 6.5 | 5.6 | 4.8 | ||
| London Interbank Offered Rate (percent) 7 | |||||||||||
| On U.S. Dollar Deposits | 0.5 | 0.5 | 0.9 | 0.9 | 0.4 | 0.3 | . . . | . . . | . . . | ||
| On Euro Deposits | 0.8 | 1.4 | 1.1 | 1.2 | –0.1 | –0.4 | . . . | . . . | . . . | ||
| On Japanese Yen Deposits | 0.4 | 0.4 | 0.5 | 0.2 | 0.2 | 0.0 | . . . | . . . | . . . | ||
| Note: Real effective exchange rates are assumed to remain constant at the levels prevailing during November 14–December 12, 2011. When economies are not listed alphabetically, they are ordered on the basis of economic size. The aggregated quarterly data are seasonally adjusted. | |||||||||||
| 1The quarterly estimates and projections account for 90 percent of the world purchasing-power-parity weights. | |||||||||||
| 2Excludes the G7 and euro area countries. | |||||||||||
| 3The quarterly estimates and projections account for approximately 80 percent of the emerging and developing economies. | |||||||||||
| 4Indonesia, Malaysia, Philippines, Thailand, and Vietnam. | |||||||||||
| 5The September 2011 WEO projections did not include Libya due to the uncertain political situation, but Libya is included in these aggregate WEO calculations. Excluding Libya, MENA growth projections for 2012 and 2013 are lower by –1.6 and –1.2 percentage points, respectively, than in the September 2011 WEO. Note that the World and Emerging and Developing Economies aggregates are also not directly comparable with those in the September 2011 WEO because of Libya’s inclusion, but Libya’s weight in these aggregates is much lower. | |||||||||||
| 6Simple average of prices of U.K. Brent, Dubai, and West Texas Intermediate crude oil. The average price of oil in U.S. dollars a barrel was $104.23 in 2011; the assumed price based on futures markets is $99.09 in 2012 and $95.55 in 2013. | |||||||||||
| 7Six-month rate for the United States and Japan. Three-month rate for the euro area. | |||||||||||
For a complete text of the IMF statement, click on the source hyperlink below.
source: IMF


